
- Current
- Browse
- Collections
-
For contributors
- For Authors
- Instructions to authors
- Article processing charge
- e-submission
- For Reviewers
- Instructions for reviewers
- How to become a reviewer
- Best reviewers
- For Readers
- Readership
- Subscription
- Permission guidelines
- About
- Editorial policy
Search
- Page Path
- HOME > Search
- Metabolic Risk/Epidemiology
- Gestational Diabetes Mellitus and Its Implications across the Life Span
- Brandy Wicklow, Ravi Retnakaran
- Diabetes Metab J. 2023;47(3):333-344. Published online February 8, 2023
- DOI: https://doi.org/10.4093/dmj.2022.0348

- 5,306 View
- 417 Download
- 6 Web of Science
- 7 Crossref
-
 Abstract
 PDF
PDF PubReader
  ePub
ePub - Gestational diabetes mellitus (GDM) has historically been perceived as a medical complication of pregnancy that also serves as a harbinger of maternal risk of developing type 2 diabetes mellitus (T2DM) in the future. In recent decades, a growing body of evidence has detailed additional lifelong implications that extend beyond T2DM, including an elevated risk of ultimately developing cardiovascular disease. Furthermore, the risk factors that mediate this lifetime cardiovascular risk are evident not only after delivery but are present even before the pregnancy in which GDM is first diagnosed. The concept thus emerging from these data is that the diagnosis of GDM enables the identification of women who are already on an enhanced track of cardiometabolic risk that starts early in life. Studies of the offspring of pregnancies complicated by diabetes now suggest that the earliest underpinnings of this cardiometabolic risk profile may be determined in utero and may first manifest clinically in childhood. Accordingly, from this perspective, GDM is now seen as a chronic metabolic disorder that holds implications across the life span of both mother and child.
-
Citations
Citations to this article as recorded by
- ATP5me alleviates high glucose-induced myocardial cell injury
Qingsha Hou, Fang Yan, Xiuling Li, Huanling Liu, Xiang Yang, Xudong Dong
International Immunopharmacology.2024; 129: 111626. CrossRef - Prevalence and Predictors of Gestational Diabetes Mellitus and Overt Diabetes in Pregnancy: A Secondary Analysis of Nationwide Data from India
Saurav Basu, Vansh Maheshwari, Rutul Gokalani, Chandrakant Lahariya
Preventive Medicine: Research & Reviews.2024; 1(1): 52. CrossRef - Serum betaine and dimethylglycine in mid-pregnancy and the risk of gestational diabetes mellitus: a case-control study
Ziqing Zhou, Yao Yao, Yanan Sun, Xin Wang, Shang Huang, Jianli Hou, Lijun Wang, Fengxiang Wei
Endocrine.2024;[Epub] CrossRef - Quality assessment of videos on social media platforms related to gestational diabetes mellitus in China: A cross-section study
Qin-Yu Cai, Jing Tang, Si-Zhe Meng, Yi Sun, Xia Lan, Tai-Hang Liu
Heliyon.2024; 10(7): e29020. CrossRef - Inflammation and decreased cardiovagal modulation are linked to stress and depression at 36th week of pregnancy in gestational diabetes mellitus
Manoharan Renugasundari, Gopal Krushna Pal, Latha Chaturvedula, Nivedita Nanda, K. T. Harichandrakumar, Thiyagarajan Durgadevi
Scientific Reports.2023;[Epub] CrossRef - Women with gestational diabetes mellitus, controlled for plasma glucose level, exhibit maternal and fetal dyslipidaemia that may warrant treatment
Barbara J. Meyer, Colin Cortie, Marloes Dekker-Nitert, Helen L. Barrett, Dilys J. Freeman
Diabetes Research and Clinical Practice.2023; 204: 110929. CrossRef - Pregnancy diet to prevent gestational diabetes: study design and dietary assessments
Sylvia H. Ley
The American Journal of Clinical Nutrition.2023; 118(5): 847. CrossRef
- ATP5me alleviates high glucose-induced myocardial cell injury
- Basic Research
- Long Non-Coding RNA TUG1 Attenuates Insulin Resistance in Mice with Gestational Diabetes Mellitus via Regulation of the MicroRNA-328-3p/SREBP-2/ERK Axis
- Xuwen Tang, Qingxin Qin, Wenjing Xu, Xuezhen Zhang
- Diabetes Metab J. 2023;47(2):267-286. Published online January 19, 2023
- DOI: https://doi.org/10.4093/dmj.2021.0216
- 2,875 View
- 189 Download
- 6 Web of Science
- 5 Crossref
-
Abstract
PDF
 Supplementary MaterialPubReader ePub
 - Background
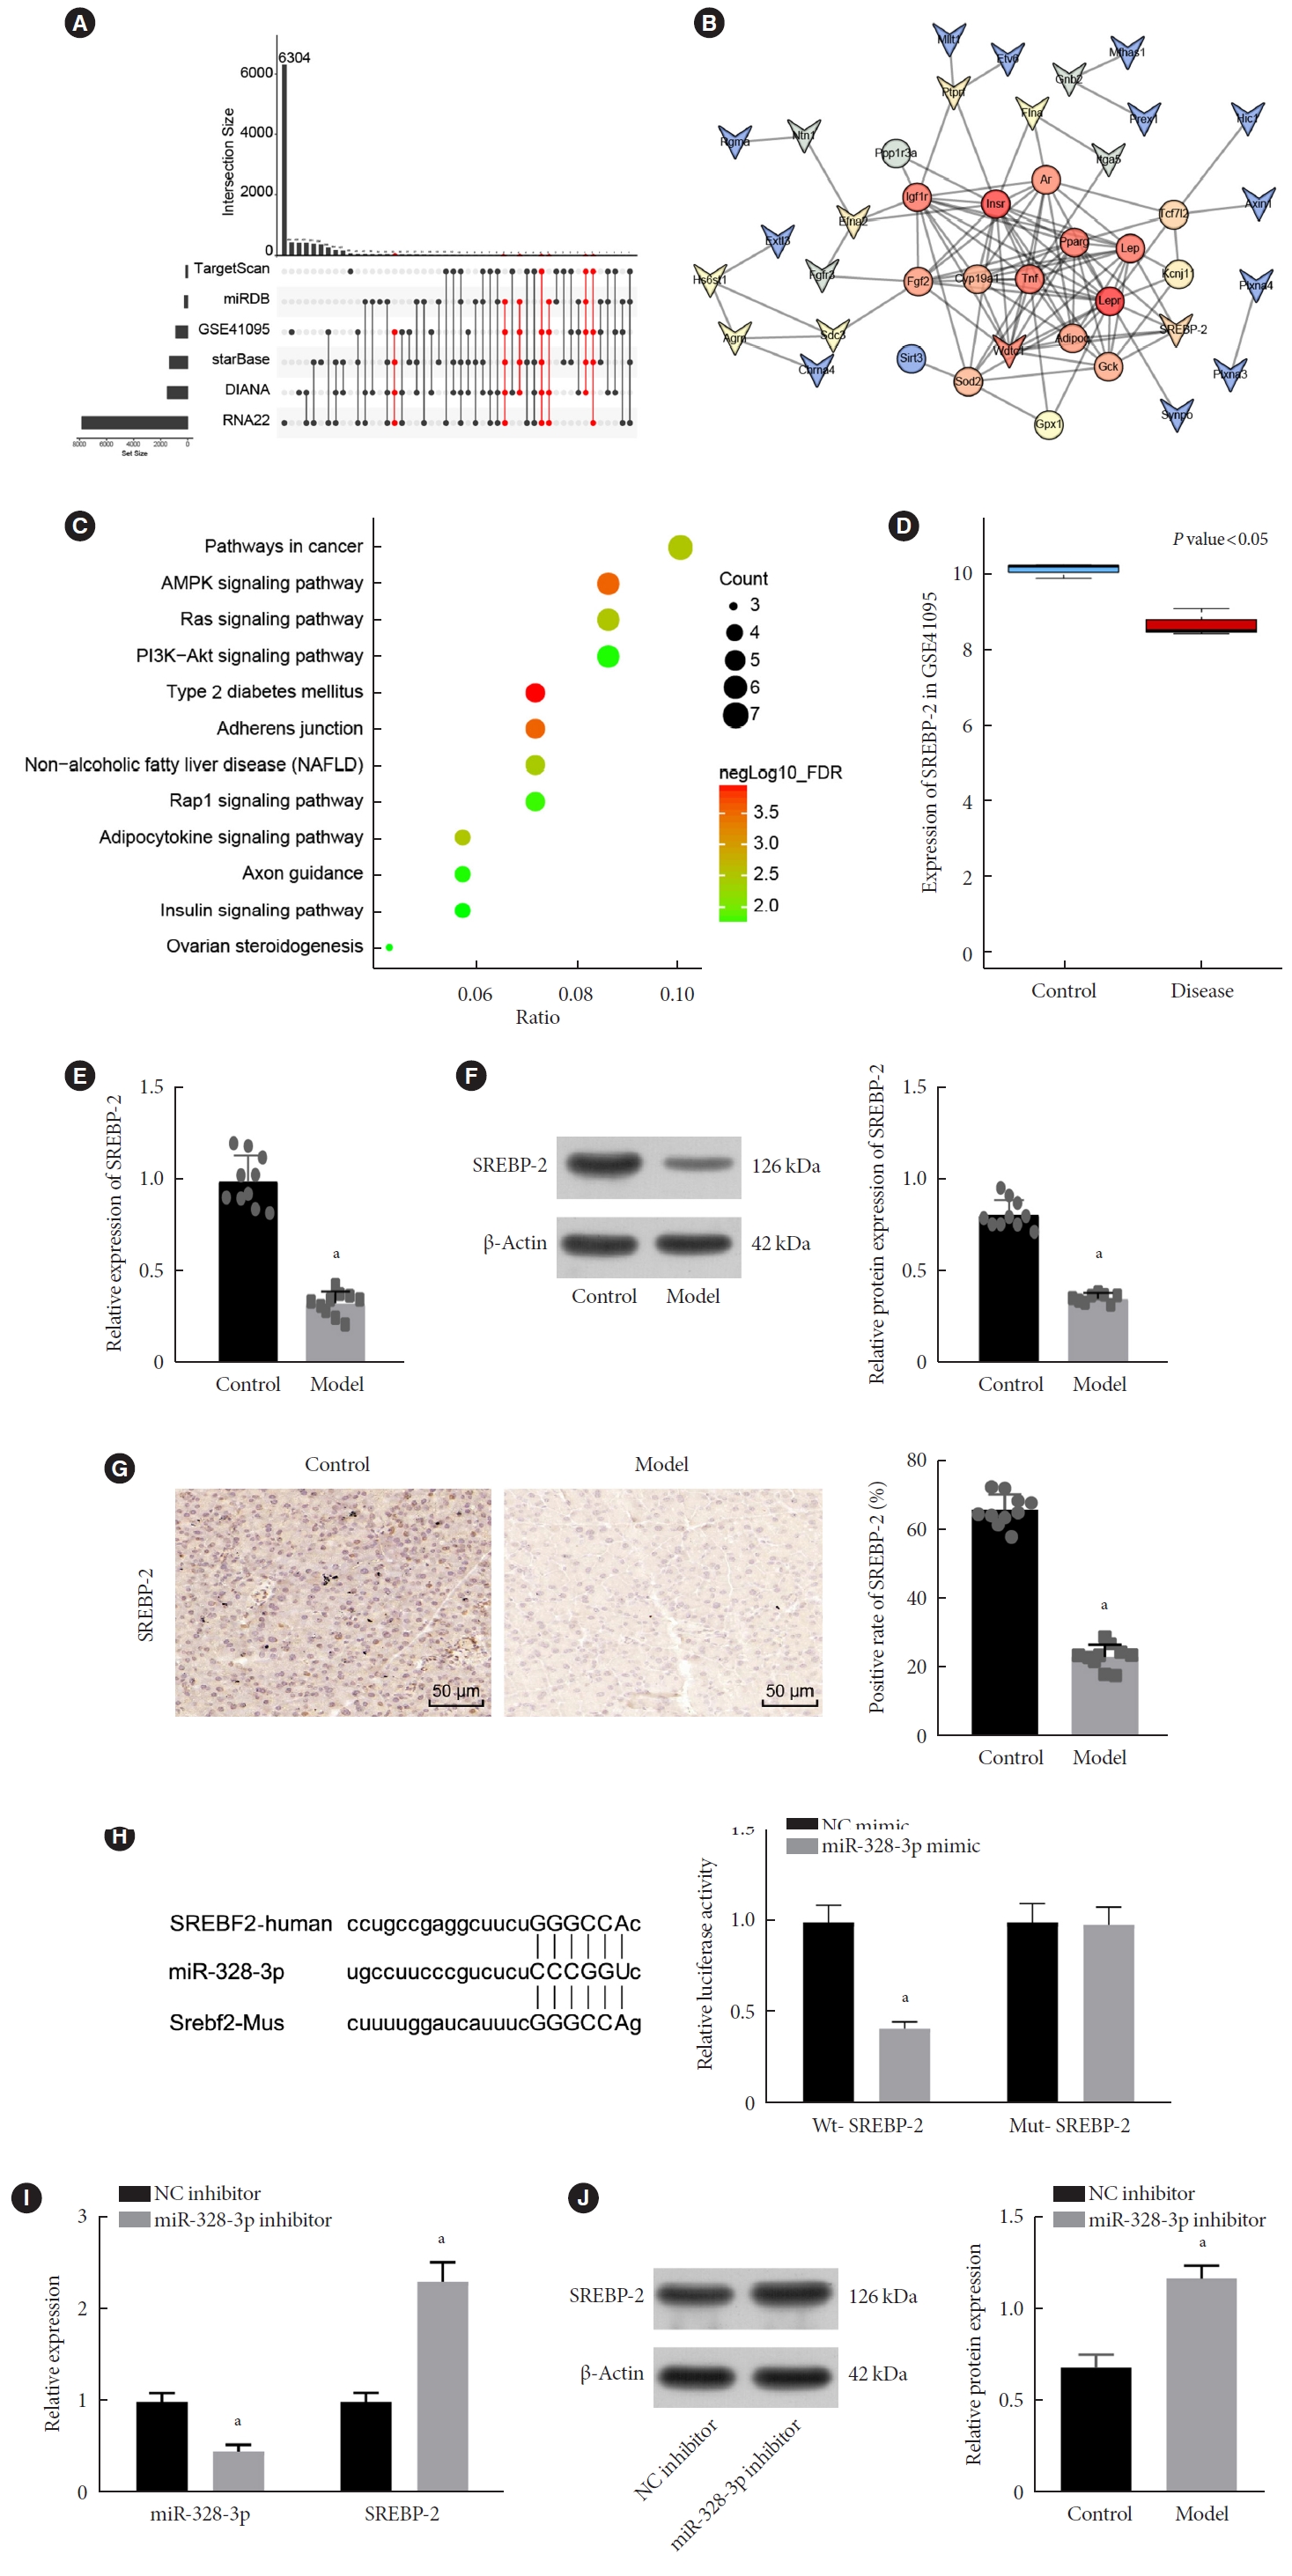
Long non-coding RNAs (lncRNAs) have been illustrated to contribute to the development of gestational diabetes mellitus (GDM). In the present study, we aimed to elucidate how lncRNA taurine upregulated gene 1 (TUG1) influences insulin resistance (IR) in a high-fat diet (HFD)-induced mouse model of GDM.
Methods
We initially developed a mouse model of HFD-induced GDM, from which islet tissues were collected for RNA and protein extraction. Interactions among lncRNA TUG1/microRNA (miR)-328-3p/sterol regulatory element binding protein 2 (SREBP-2) were assessed by dual-luciferase reporter assay. Fasting blood glucose (FBG), fasting insulin (FINS), homeostasis model assessment of insulin resistance (HOMA-IR), HOMA pancreatic β-cell function (HOMA-β), insulin sensitivity index for oral glucose tolerance tests (ISOGTT) and insulinogenic index (IGI) levels in mouse serum were measured through conducting gain- and loss-of-function experiments.
Results
Abundant expression of miR-328 and deficient expression of lncRNA TUG1 and SREBP-2 were characterized in the islet tissues of mice with HFD-induced GDM. LncRNA TUG1 competitively bound to miR-328-3p, which specifically targeted SREBP-2. Either depletion of miR-328-3p or restoration of lncRNA TUG1 and SREBP-2 reduced the FBG, FINS, HOMA-β, and HOMA-IR levels while increasing ISOGTT and IGI levels, promoting the expression of the extracellular signal-regulated kinase (ERK) signaling pathway-related genes, and inhibiting apoptosis of islet cells in GDM mice. Upregulation miR-328-3p reversed the alleviative effects of SREBP-2 and lncRNA TUG1 on IR.
Conclusion
Our study provides evidence that the lncRNA TUG1 may prevent IR following GDM through competitively binding to miR-328-3p and promoting the SREBP-2-mediated ERK signaling pathway inactivation. -
Citations
Citations to this article as recorded by- Diabetes and diabetic associative diseases: An overview of epigenetic regulations of TUG1
Mohammed Ageeli Hakami
Saudi Journal of Biological Sciences.2024; 31(5): 103976. CrossRef - Effect of Tinospora cordifolia on gestational diabetes mellitus and its complications
Ritu Rani, Havagiray Chitme, Avinash Kumar Sharma
Women & Health.2023; 63(5): 359. CrossRef - Therapeutic Effect of Tinospora cordifolia (Willd) Extracts on Letrozole-Induced Polycystic Ovarian Syndrome and its Complications in Murine Model
Ritu Rani, Avinash Kumar Sharma, Havagiray R Chitme
Clinical Medicine Insights: Endocrinology and Diabetes.2023;[Epub] CrossRef - The role of ncRNA regulatory mechanisms in diseases—case on gestational diabetes
Dong Gao, Liping Ren, Yu-Duo Hao, Nalini Schaduangrat, Xiao-Wei Liu, Shi-Shi Yuan, Yu-He Yang, Yan Wang, Watshara Shoombuatong, Hui Ding
Briefings in Bioinformatics.2023;[Epub] CrossRef - lncRNA TUG1 as potential novel biomarker for prognosis of cardiovascular diseases
Habib Haybar, Narjes Sadat Sadati, Daryush Purrahman, Mohammad Reza Mahmoudian-Sani, Najmaldin Saki
Epigenomics.2023; 15(23): 1273. CrossRef
- Diabetes and diabetic associative diseases: An overview of epigenetic regulations of TUG1
- Others
- Influence of Maternal Diabetes on the Risk of Neurodevelopmental Disorders in Offspring in the Prenatal and Postnatal Periods
- Verónica Perea, Xavier Urquizu, Maite Valverde, Marina Macias, Anna Carmona, Esther Esteve, Gemma Escribano, Nuria Pons, Oriol Giménez, Teresa Gironés, Andreu Simó-Servat, Andrea Domenech, Núria Alonso-Carril, Carme Quirós, Antonio J. Amor, Eva López, Maria José Barahona
- Diabetes Metab J. 2022;46(6):912-922. Published online April 29, 2022
- DOI: https://doi.org/10.4093/dmj.2021.0340
- 4,842 View
- 249 Download
- 5 Web of Science
- 5 Crossref
-
Abstract
PDFSupplementary MaterialPubReader ePub
- Background
This study aimed to evaluate the influence of maternal diabetes in the risk of neurodevelopmental disorders in offspring in the prenatal and postnatal periods.
Methods
This cohort study included singleton gestational diabetes mellitus (GDM) pregnancies >22 weeks’ gestation with live newborns between 1991 and 2008. The control group was randomly selected and matched (1:2) for maternal age, weeks of gestation and birth year. Cox regression models estimated the effect of GDM on the risk of attention-deficit/hyperactivity disorder (ADHD), autism spectrum disorder (ASD), and maternal type 2 diabetes mellitus (T2DM). Moreover, interaction between maternal T2DM and GDM-ADHD relationship was evaluated.
Results
Children (n=3,123) were included (1,073 GDM; 2,050 control group). The median follow-up was 18.2 years (interquartile range, 14.2 to 22.3) (n=323 with ADHD, n=36 with ASD, and n=275 from women who developed T2DM). GDM exposure was associated with ADHD (hazard ratio [HR]crude, 1.67; 95% confidence interval [CI], 1.33 to 2.07) (HRadjusted, 1.64; 95% CI, 1.31 to 2.05). This association remained significant regardless of the treatment (diet or insulin) and diagnosis after 26 weeks of gestation. Children of mothers who developed T2DM presented higher rates of ADHD (14.2 vs. 10%, P=0.029). However, no interaction was found when T2DM was included in the GDM and ADHD models (P>0.05). GDM was not associated with an increased risk of ASD (HRadjusted, 1.46; 95% CI, 0.74 to 2.84).
Conclusion
Prenatal exposure to GDM increases the risk of ADHD in offspring, regardless of GDM treatment complexity. However, postnatal exposure to maternal T2DM was not related to the development of ADHD. -
Citations
Citations to this article as recorded by- Effects of a Diabetic Microenvironment on Neurodegeneration: Special Focus on Neurological Cells
Vishal Chavda, Dhananjay Yadav, Snehal Patel, Minseok Song
Brain Sciences.2024; 14(3): 284. CrossRef - Maternal Diabetes Deregulates the Expression of Mecp2 via miR-26b-5p in Mouse Embryonic Neural Stem Cells
Sukanya Shyamasundar, Seshadri Ramya, Deepika Kandilya, Dinesh Kumar Srinivasan, Boon Huat Bay, Suraiya Anjum Ansari, S Thameem Dheen
Cells.2023; 12(11): 1516. CrossRef - Evaluating the prospects of using gestational diabetes mellitus model to find means of pharmacological correction of the disorders in rat offspring
A. S. Solomina, A. V. Rodina, K. S. Kachalov, A. D. Zakharov, A. D. Durnev
Pharmacokinetics and Pharmacodynamics.2023; (2): 45. CrossRef - Hair and cord blood element levels and their relationship with air pollution, dietary intake, gestational diabetes mellitus, and infant neurodevelopment
Yin-Yin Xia, Jamie V. de Seymour, Xiao-Jia Yang, Lin-Wei Zhou, Yue Liu, Yang Yang, Kathryn L. Beck, Cathryn A. Conlon, Toby Mansell, Boris Novakovic, Richard Saffery, Ting-Li Han, Hua Zhang, Philip N. Baker
Clinical Nutrition.2023; 42(10): 1875. CrossRef - Role of Excessive Weight Gain During Gestation in the Risk of ADHD in Offspring of Women With Gestational Diabetes
Verónica Perea, Andreu Simó-Servat, Carmen Quirós, Nuria Alonso-Carril, Maite Valverde, Xavier Urquizu, Antonio J Amor, Eva López, Maria-José Barahona
The Journal of Clinical Endocrinology & Metabolism.2022; 107(10): e4203. CrossRef
- Effects of a Diabetic Microenvironment on Neurodegeneration: Special Focus on Neurological Cells
- Metabolic Risk/Epidemiology
- Higher Muscle Mass Protects Women with Gestational Diabetes Mellitus from Progression to Type 2 Diabetes Mellitus
- Yujin Shin, Joon Ho Moon, Tae Jung Oh, Chang Ho Ahn, Jae Hoon Moon, Sung Hee Choi, Hak Chul Jang
- Diabetes Metab J. 2022;46(6):890-900. Published online April 28, 2022
- DOI: https://doi.org/10.4093/dmj.2021.0334
- 4,790 View
- 228 Download
- 2 Web of Science
- 3 Crossref
-
Abstract
PDFSupplementary MaterialPubReader ePub
- Background
We evaluated whether postpartum muscle mass affects the risk of type 2 diabetes mellitus (T2DM) in Korean women with gestational diabetes mellitus (GDM).
Methods
A total of 305 women with GDM (mean age, 34.9 years) was prospectively evaluated for incident prediabetes and T2DM from 2 months after delivery and annually thereafter. Appendicular skeletal muscle mass (ASM) was assessed with bioelectrical impedance analysis at the initial postpartum visit, and ASM, either divided by body mass index (BMI) or squared height, and the absolute ASM were used as muscle mass indices. The risk of incident prediabetes and T2DM was assessed according to tertiles of these indices using a logistic regression model.
Results
After a mean follow-up duration of 3.3 years, the highest ASM/BMI tertile group had a 61% lower risk of incident prediabetes and T2DM compared to the lowest tertile group, and this remained significant after we adjusted for covariates (adjusted odds ratio, 0.37; 95% confidence interval [CI], 0.15 to 0.92; P=0.032). Equivalent findings were observed in normal weight women (BMI <23 kg/m2), but this association was not significant for overweight women (BMI ≥23 kg/m2). Absolute ASM or ASM/height2 was not associated with the risk of postpartum T2DM.
Conclusion
A higher muscle mass, as defined by the ASM/BMI index, was associated with a lower risk of postpartum prediabetes and T2DM in Korean women with GDM. -
Citations
Citations to this article as recorded by- More appendicular lean mass relative to body mass index is associated with lower incident diabetes in middle-aged adults in the CARDIA study
Melanie S. Haines, Aaron Leong, Bianca C. Porneala, Victor W. Zhong, Cora E. Lewis, Pamela J. Schreiner, Karen K. Miller, James B. Meigs, Mercedes R. Carnethon
Nutrition, Metabolism and Cardiovascular Diseases.2023; 33(1): 105. CrossRef - The Association of the Triglyceride and Muscle to Fat Ratio During Early Pregnancy with the Development of Gestational Diabetes Mellitus
Fang Wang, Yuan-Yuan Bao, Kang Yu
Diabetes, Metabolic Syndrome and Obesity.2023; Volume 16: 3187. CrossRef - Correlation of body composition in early pregnancy on gestational diabetes mellitus under different body weights before pregnancy
Li Xintong, Xu Dongmei, Zhang Li, Cao Ruimin, Hao Yide, Cui Lingling, Chen Tingting, Guo Yingying, Li Jiaxin
Frontiers in Endocrinology.2022;[Epub] CrossRef
- More appendicular lean mass relative to body mass index is associated with lower incident diabetes in middle-aged adults in the CARDIA study
- Metabolic Risk/Epidemiology
- Gestational Diabetes Mellitus: Diagnostic Approaches and Maternal-Offspring Complications
- Joon Ho Moon, Hak Chul Jang
- Diabetes Metab J. 2022;46(1):3-14. Published online January 27, 2022
- DOI: https://doi.org/10.4093/dmj.2021.0335
- 14,803 View
- 900 Download
- 54 Web of Science
- 64 Crossref
-
 Graphical Abstract
Abstract
PDFPubReader ePub
Graphical Abstract
Abstract
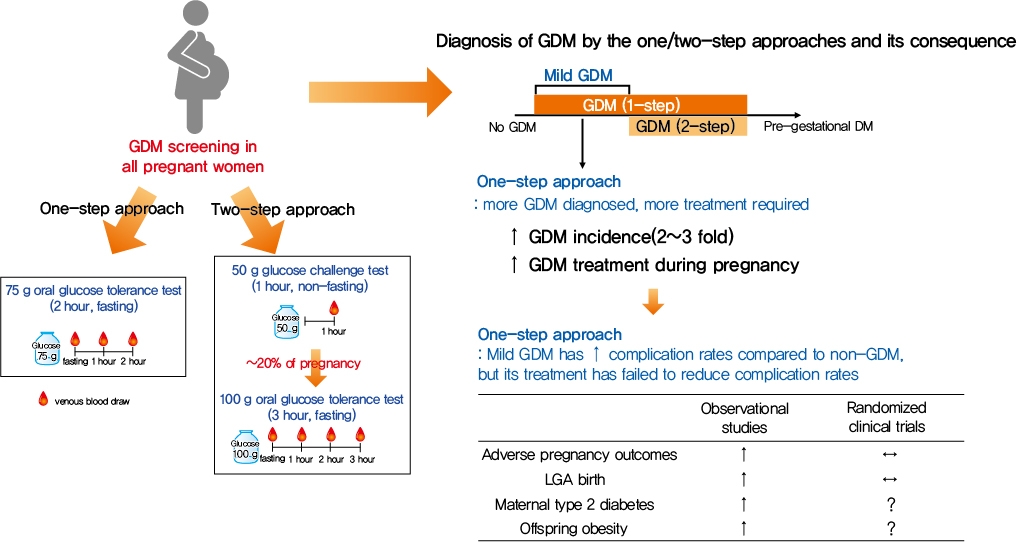
PDFPubReader ePub - Gestational diabetes mellitus (GDM) is the most common complication during pregnancy and is defined as any degree of glucose intolerance with onset or first recognition during pregnancy. GDM is associated with adverse pregnancy outcomes and long-term offspring and maternal complications. For GDM screening and diagnosis, a two-step approach (1-hour 50 g glucose challenge test followed by 3-hour 100 g oral glucose tolerance test) has been widely used. After the Hyperglycemia and Adverse Pregnancy Outcome study implemented a 75 g oral glucose tolerance test in all pregnant women, a one-step approach was recommended as an option for the diagnosis of GDM after 2010. The one-step approach has more than doubled the incidence of GDM, but its clinical benefit in reducing adverse pregnancy outcomes remains controversial. Long-term complications of mothers with GDM include type 2 diabetes mellitus and cardiovascular disease, and complications of their offspring include childhood obesity and glucose intolerance. The diagnostic criteria of GDM should properly classify women at risk for adverse pregnancy outcomes and long-term complications. The present review summarizes the strengths and weaknesses of the one-step and two-step approaches for the diagnosis of GDM based on recent randomized controlled trials and observational studies. We also describe the long-term maternal and offspring complications of GDM.
-
Citations
Citations to this article as recorded by- Prophylactic administration of metformin reduces gestational diabetes mellitus incidence in the high-risk populations: a meta-analysis
Hui Yu, Jinling Sun, Honglei Hu
Irish Journal of Medical Science (1971 -).2024; 193(1): 199. CrossRef - Association of dietary inflammatory index with risk of gestational diabetes mellitus and preeclampsia: a systematic review and meta-analysis
Li Hong, Liyuan Zhu, Jinru Zhang, Yueqi Fu, Xiaoyan Qi, Mei Zhao
British Journal of Nutrition.2024; 131(1): 54. CrossRef - Ferritin and iron supplements in gestational diabetes mellitus: less or more?
Tianlian Li, Jingfan Zhang, Ping Li
European Journal of Nutrition.2024; 63(1): 67. CrossRef - Comparing the screening methods for gestational diabetes mellitus before and during the COVID‐19 pandemic: A systematic review
Xingge Sun, Clare McKeaveney, Helen Noble, Hannah O’Hara, Oliver Perra
Journal of Diabetes Investigation.2024; 15(4): 500. CrossRef - Protective Effects of Paeoniflorin Against Inflammation and Oxidative Stress in Rats with Gestational Diabetes Mellitus via Inhibiting the RhoA/ROCK Signaling Pathway
Cheng kun Yuan, Yan Gao, Jinglu Yu, Limin Peng
Revista Brasileira de Farmacognosia.2024; 34(3): 536. CrossRef - METTL14‐mediated lncRNA XIST silencing alleviates GDM progression by facilitating trophoblast cell proliferation and migration via the miR‐497‐5p/FOXO1 axis
Yanchuan Li, Yanfeng Liu, Xiao Yao, Haili Wang, Ziyun Shi, Meiqing He
Journal of Biochemical and Molecular Toxicology.2024;[Epub] CrossRef - Evaluation of insulin secretion and insulin sensitivity in pregnant women: Application value of simple indices
Shuying Ren, Dan Wu, Ping Li
Clinica Chimica Acta.2024; 554: 117753. CrossRef - ATP5me alleviates high glucose-induced myocardial cell injury
Qingsha Hou, Fang Yan, Xiuling Li, Huanling Liu, Xiang Yang, Xudong Dong
International Immunopharmacology.2024; 129: 111626. CrossRef - Aberrant NK cell profile in gestational diabetes mellitus with fetal growth restriction
Yujing Xiong, Yazhen Wang, Mengqi Wu, Shuqiang Chen, Hui Lei, Hui Mu, Haikun Yu, Yongli Hou, Kang Tang, Xutao Chen, Jie Dong, Xiaohong Wang, Lihua Chen
Frontiers in Immunology.2024;[Epub] CrossRef - Maternal Diabetes and Risk of Hypospadias: A Systemic Review and Meta-Analysis
Zhiyuan Liu, Chengjun Yu, Shuhan Yang, Jin Luo, Jie Zhang, Xiao Wang, Chun Wei, Qinlin Shi, Yi Hua, Xing Liu, Guanghui Wei
Urologia Internationalis.2024; 108(2): 108. CrossRef - Maternal birth weight as an indicator of early and late gestational diabetes mellitus: The Japan Environment and Children's Study
Kazuma Tagami, Noriyuki Iwama, Hirotaka Hamada, Hasumi Tomita, Rie Kudo, Natsumi Kumagai, Hongxin Wang, Seiya Izumi, Zen Watanabe, Mami Ishikuro, Taku Obara, Nozomi Tatsuta, Hirohito Metoki, Chiharu Ota, Takashi Sugiyama, Shinichi Kuriyama, Takahiro Arima
Journal of Diabetes Investigation.2024;[Epub] CrossRef - Perinatal characteristics and pregnancy outcomes of advanced maternal age women with gestational diabetes mellitus: A retrospective cohort study
Chen Jiang, Haiyan Wen, Tingting Hu, Yanfei Liu, Xiaoqing Dai, Yiming Chen
Health Science Reports.2024;[Epub] CrossRef - Phenotypic characterisation of regulatory T cells in patients with gestational diabetes mellitus
Ya-nan Zhang, Qin Wu, Yi-hui Deng
Scientific Reports.2024;[Epub] CrossRef - Healthy behaviors and gestational diabetes mellitus in an Iranian setting: A cross-sectional study
Maryam Zare, Afrouz Mardi, Paria Yeghanenia, Daniel Hackett
Medicine.2024; 103(9): e36431. CrossRef - Post‐load glucose is a stronger predictor of adverse pregnancy outcomes than first‐trimester HbA1c in women without gestational diabetes
Shahin Keshtkar Rajabi, Elham Toghraee, Golnoosh Nejatipour
Journal of Diabetes Investigation.2024;[Epub] CrossRef - Triglyceride-glucose index in early pregnancy predicts the risk of gestational diabetes: a prospective cohort study
Yufeng Guo, Junwen Lu, Mailiman Bahani, Guifeng Ding, Lei Wang, Yuxia Zhang, Huanmei Zhang, Chengyao Liu, Lijun Zhou, Xiaolan Liu, Fangshen Li, Xiaoli Wang, Hong Ding
Lipids in Health and Disease.2024;[Epub] CrossRef - A study on behavior, diet patterns and physical activity among selected GDM and non-GDM women in south India
S Sindhu, S Uma Mageshwari
Journal of Diabetology.2024; 15(1): 86. CrossRef - The Implication of Diabetes-Specialized Nurses in Aiming for the Better Treatment and Management of Patients with Diabetes Mellitus: A Brief Narrative Review
Yefang Zhu, Hongmei Zhang, Ying Xi, Hongli Zhu, Yan Lu, Xue Luo, Zhangui Tang, Hong Lei
Diabetes Therapy.2024; 15(5): 917. CrossRef - Triglyceride-glucose index: A promising biomarker for predicting risks of adverse pregnancy outcomes in Hangzhou, China
Jinghua Zhang, Binbin Yin, Ya Xi, Yongying Bai
Preventive Medicine Reports.2024; 41: 102683. CrossRef - Associations of education attainment with gestational diabetes mellitus and the mediating effects of obesity: A Mendelian randomization study
Xiaoyan Wang, Ying Lan, Na Li, Jinfeng Gao, Dejiao Meng, Shuchuan Miao
Heliyon.2024; 10(7): e29000. CrossRef - Quality assessment of videos on social media platforms related to gestational diabetes mellitus in China: A cross-section study
Qin-Yu Cai, Jing Tang, Si-Zhe Meng, Yi Sun, Xia Lan, Tai-Hang Liu
Heliyon.2024; 10(7): e29020. CrossRef - One abnormal value in oral glucose tolerance test during pregnancy and type 2 diabetes risk: Insights from a 5-Year Follow-Up study
Rawia Hussein-Aro, Esther Maor-Sagie, Yoel Toledano, Mordechai Hallak, Rinat Gabbay-Benziv
Diabetes Research and Clinical Practice.2024; 211: 111659. CrossRef - Assessment of the Level of Knowledge About Risk Factors, Prevention, and Treatment of Gestational Diabetes Mellitus in a Community Sample From Saudi Arabia
Suzan A Morsy, Ayat M Tawfik, Samar Y Badayyan, Lameer K Shaikh, Shaden AzizKhan, AlKhansaa A Zakari
Cureus.2024;[Epub] CrossRef - Genetic Susceptibility, Mendelian Randomization, and Nomogram Model Construction of Gestational Diabetes Mellitus
Qiulian Liang, Ming Li, Gongchen Huang, Ruiqi Li, Linyuan Qin, Ping Zhong, Xuekun Xing, Xiangyuan Yu
The Journal of Clinical Endocrinology & Metabolism.2024;[Epub] CrossRef - Study on the regulation of trophoblast activity by abnormally expressed hsa_circ_0024838/miR-543/HIF1A in patients with gestational diabetes mellitus
Qian Liu, Faminzi Li, Juan Gui, Lianzhi Wu
Placenta.2024;[Epub] CrossRef - Association between sleep duration during pregnancy and gestational diabetes mellitus: a systematic review and meta-analysis
Yuandong Li, Chao Liang, Cui Wu, Zheng Nan
Frontiers in Medicine.2024;[Epub] CrossRef - Ultrasonographic Diagnosis of Fetal Hemodynamic Parameters in Pregnant Women with Diabetes Mellitus in the Third Trimester of Pregnancy
Dongmei Cai, Su Yan
Heliyon.2024; : e30352. CrossRef - Gestational diabetes mellitus and development of intergenerational non-alcoholic fatty liver disease (NAFLD) after delivery: a systematic review and meta-analysis
Ru Xun Foo, Jenny Junyi Ma, Ruochen Du, George Boon Bee Goh, Yap Seng Chong, Cuilin Zhang, Ling-Jun Li
eClinicalMedicine.2024; 72: 102609. CrossRef - U-shaped Association Between Folic Acid Supplementation and the Risk of Gestational Diabetes Mellitus in Chinese Women
Jiuming Zou, Qiang Fu, Xiaoliu Huang, Zhao Yao, Weiye Wang
Canadian Journal of Diabetes.2023; 47(1): 78. CrossRef - Vitamin D Supplementation for the Outcomes of Patients with Gestational Diabetes Mellitus and Neonates: A Meta-Analysis and Systematic Review
Chunfeng Wu, Yang Song, Xueying Wang, Pier P. Sainaghi
International Journal of Clinical Practice.2023; 2023: 1. CrossRef - Lipolysis and gestational diabetes mellitus onset: a case-cohort genome-wide association study in Chinese
Miao Zhang, Qing Li, Kai-Lin Wang, Yao Dong, Yu-Tong Mu, Yan-Min Cao, Jin Liu, Zi-Heng Li, Hui-Lu Cui, Hai-Yan Liu, An-Qun Hu, Ying-Jie Zheng
Journal of Translational Medicine.2023;[Epub] CrossRef - Interactive effect of prepregnancy overweight/obesity and GDM history on prevalence of GDM in biparous women
Xia Xu, Feipeng Huang, Yanni Guo, Lianghui Zheng, Jianying Yan
Frontiers in Endocrinology.2023;[Epub] CrossRef - Microbiome Changes in Pregnancy Disorders
Luca Giannella, Camilla Grelloni, Dayana Quintili, Alessia Fiorelli, Ramona Montironi, Sonila Alia, Giovanni Delli Carpini, Jacopo Di Giuseppe, Arianna Vignini, Andrea Ciavattini
Antioxidants.2023; 12(2): 463. CrossRef - Effects of early standardized management on the growth trajectory of offspring with gestational diabetes mellitus at 0–5 years old: a preliminary longitudinal study
Bingbing Guo, Jingjing Pei, Yin Xu, Yajie Wang, Xinye Jiang
Scientific Reports.2023;[Epub] CrossRef - Prediction model for gestational diabetes mellitus using the XG Boost machine learning algorithm
Xiaoqi Hu, Xiaolin Hu, Ya Yu, Jia Wang
Frontiers in Endocrinology.2023;[Epub] CrossRef - Prevalence and outcomes of gestational diabetes mellitus in Indian women: Insights from a large real-world study over ten years at tertiary care research institute
Sanjay Gupte, Gayatri Venkataraman, Aarti S. Shah, Shalaka Jamenis, Chandrakant Rao, Shweta M. Jangam, Kaveri M. Adki, Onkar C. Swami
International Journal of Diabetes in Developing Countries.2023; 43(4): 511. CrossRef - Gestational diabetes mellitus: state of art
S. A. Pletneva, E. V. Enkova, O. V. Khoperskaya, S. V. Shamarin, V. V. Enkova
Meditsinskiy sovet = Medical Council.2023; (5): 136. CrossRef - Effect of folic acid supplementation in the association between short sleep duration and gestational diabetes mellitus
Zhen Yang, Sisi Hu, Wei Tong, Zhihao Xu, Xiaoliu Huang, Weiye Wang
Sleep and Breathing.2023; 27(6): 2509. CrossRef - Birth weight and large for gestational age trends in offspring of pregnant women with gestational diabetes mellitus in southern China, 2012-2021
Li-Rong He, Li Yu, Yong Guo
Frontiers in Endocrinology.2023;[Epub] CrossRef - Root causes of long-term complications of gestational diabetes mellitus: Metabolic disturbances of the host and gut microbiota
Mingjin Tao, Gaochen Lu, Sheng Zhang, Pan Li
Clinica Chimica Acta.2023; 548: 117490. CrossRef - Analysis on Related Risk Factors for Gestational Diabetes Mellitus (GDM) in Subsequent Pregnancies in Multiparous Women with No History of GDM
文静 张
Advances in Clinical Medicine.2023; 13(07): 11628. CrossRef - Fetoplacental endothelial dysfunction in gestational diabetes mellitus and maternal obesity: A potential threat for programming cardiovascular disease
Mariana S. Diniz, Ursula Hiden, Inês Falcão-Pires, Paulo J. Oliveira, Luis Sobrevia, Susana P. Pereira
Biochimica et Biophysica Acta (BBA) - Molecular Basis of Disease.2023; 1869(8): 166834. CrossRef - Diagnosis and management of gestational diabetes mellitus
Tae Jung Oh
Journal of the Korean Medical Association.2023; 66(7): 414. CrossRef - Hypoglycemia in Children: Major Endocrine-Metabolic Causes and Novel Therapeutic Perspectives
Alessia Quarta, Daniela Iannucci, Miriana Guarino, Annalisa Blasetti, Francesco Chiarelli
Nutrients.2023; 15(16): 3544. CrossRef - Relation between weight gain during pregnancy and postpartum reclassification in gestational diabetes
Sofia Coelho, Marta Canha, Ana Rita Leite, João Sérgio Neves, Ana Isabel Oliveira, Davide Carvalho, Maria do Céu Ameida
Endocrine.2023; 82(2): 296. CrossRef - Nurturing through Nutrition: Exploring the Role of Antioxidants in Maternal Diet during Pregnancy to Mitigate Developmental Programming of Chronic Diseases
Mariana S. Diniz, Carina C. Magalhães, Carolina Tocantins, Luís F. Grilo, José Teixeira, Susana P. Pereira
Nutrients.2023; 15(21): 4623. CrossRef - Blood manganese level and gestational diabetes mellitus: a systematic review and meta-analysis
Yingmei Sun, Yu Zhang
Journal of Obstetrics and Gynaecology.2023;[Epub] CrossRef - Multiparity increases the risk of diabetes by impairing the proliferative capacity of pancreatic β cells
Joon Ho Moon, Joonyub Lee, Kyun Hoo Kim, Hyun Jung Kim, Hyeongseok Kim, Hye-Na Cha, Jungsun Park, Hyeonkyu Lee, So-young Park, Hak Chul Jang, Hail Kim
Experimental & Molecular Medicine.2023; 55(10): 2269. CrossRef - Physiological Mechanisms Inherent to Diabetes Involved in the Development of Dementia: Alzheimer’s Disease
Himan Mohamed-Mohamed, Victoria García-Morales, Encarnación María Sánchez Lara, Anabel González-Acedo, Teresa Pardo-Moreno, María Isabel Tovar-Gálvez, Lucía Melguizo-Rodríguez, Juan José Ramos-Rodríguez
Neurology International.2023; 15(4): 1253. CrossRef - Synergistic effect between pre-pregnancy smoking and assisted reproductive technology on gestational diabetes mellitus in twin pregnancies
Lingyu Zhang, Yan Huang, Mingjin Zhang, Yanqi Jin
Acta Diabetologica.2023; 61(2): 205. CrossRef - A Comprehensive Review of Gestational Diabetes Mellitus: Impacts on Maternal Health, Fetal Development, Childhood Outcomes, and Long-Term Treatment Strategies
Vaishnavi S Nakshine, Sangita D Jogdand
Cureus.2023;[Epub] CrossRef - The role of dietary fiber on preventing gestational diabetes mellitus in an at-risk group of high triglyceride-glucose index women: a randomized controlled trial
Yannan Cao, Jing Sheng, Dongyao Zhang, Li Chen, Ying Jiang, Decui Cheng, Yao Su, Yuexin Yu, Haoyi Jia, Pengyuan He, Li Wang, Xianming Xu
Endocrine.2023; 82(3): 542. CrossRef - Correlation between PAPP-A serum levels in the first trimester of pregnancy with the occurrence of gestational diabetes, a multicenter cohort study
Sedigheh Borna, Masoumeh Ashrafzadeh, Marjan Ghaemi, Nasim Eshraghi, Nafiseh Hivechi, Sedigheh Hantoushzadeh
BMC Pregnancy and Childbirth.2023;[Epub] CrossRef - Impact of COVID-19 lockdown on glycemic levels during pregnancy: A retrospective analysis
Erika Di Zazzo, Sergio Davinelli, Serena Panichella, Giovanni Scapagnini, Mariano Intrieri, Silvio Garofalo
Open Medicine.2023;[Epub] CrossRef - Advancements in Nutritional Strategies for Gestational Diabetes Management: A Systematic Review of Recent Evidence
Juan Carlos Sánchez-García, Ines Saraceno López-Palop, Beatriz Piqueras-Sola, Jonathan Cortés-Martín, Elena Mellado-García, Inmaculada Muñóz Sánchez, Raquel Rodríguez-Blanque
Journal of Clinical Medicine.2023; 13(1): 37. CrossRef - Comparative efficacy and safety of glyburide, metformin, and insulin in treatment of gestational diabetes mellitus
Jing Lin, Rong-zu Tu, Xun-yu Hong
Medicine.2022;[Epub] CrossRef - Stacking Ensemble Method for Gestational Diabetes Mellitus Prediction in Chinese Pregnant Women: A Prospective Cohort Study
Ruiyi Liu, Yongle Zhan, Xuan Liu, Yifang Zhang, Luting Gui, Yimin Qu, Hairong Nan, Yu Jiang, Mehdi Gheisari
Journal of Healthcare Engineering.2022; 2022: 1. CrossRef - Secular increase in the prevalence of gestational diabetes and its associated adverse pregnancy outcomes from 2014 to 2021 in Hebei province, China
Mei-Ling Tian, Li-Yan Du, Guo-Juan Ma, Ting Zhang, Xu-Yuan Ma, Ying-Kui Zhang, Zeng-Jun Tang
Frontiers in Endocrinology.2022;[Epub] CrossRef - Aquaporin-8 overexpression is involved in vascular structure and function changes in placentas of gestational diabetes mellitus patients
Yanxing Shan, Jiawen Cui, Xinyi Kang, Weichun Tang, Yiling Lu, Ying Gao, Liping Chen
Open Life Sciences.2022; 17(1): 1473. CrossRef - Vitamin D status and levels of pro-inflammatory cytokines in newborns born to mothers with endocrine diseases
N. E. Verisokina, L. Ya. Klimov, I. N. Zakharova, A. L. Zaplatnikov, V. V. Zubkov, A. A. Momotova, V. A. Kuryaninova, R. A. Atanesyan, T. V. Zhelezniakova, M. A. Petrosyan, D. V. Bobryshev, D. A. Volkov, Z. A. Magomadova
Meditsinskiy sovet = Medical Council.2022; (19): 9. CrossRef - IL-6 and IL-8: An Overview of Their Roles in Healthy and Pathological Pregnancies
Aleksandra Vilotić, Mirjana Nacka-Aleksić, Andrea Pirković, Žanka Bojić-Trbojević, Dragana Dekanski, Milica Jovanović Krivokuća
International Journal of Molecular Sciences.2022; 23(23): 14574. CrossRef - Higher Muscle Mass Protects Women with Gestational Diabetes Mellitus from Progression to Type 2 Diabetes Mellitus
Yujin Shin, Joon Ho Moon, Tae Jung Oh, Chang Ho Ahn, Jae Hoon Moon, Sung Hee Choi, Hak Chul Jang
Diabetes & Metabolism Journal.2022; 46(6): 890. CrossRef - Identification of human placenta-derived circular RNAs and autophagy related circRNA-miRNA-mRNA regulatory network in gestational diabetes mellitus
Yindi Bao, Jun Zhang, Yi Liu, Lianzhi Wu, Jing Yang
Frontiers in Genetics.2022;[Epub] CrossRef - The Role of Dietary Polyphenols in Pregnancy and Pregnancy-Related Disorders
Mirjana Nacka-Aleksić, Andrea Pirković, Aleksandra Vilotić, Žanka Bojić-Trbojević, Milica Jovanović Krivokuća, Francesca Giampieri, Maurizio Battino, Dragana Dekanski
Nutrients.2022; 14(24): 5246. CrossRef
- Prophylactic administration of metformin reduces gestational diabetes mellitus incidence in the high-risk populations: a meta-analysis
- Metabolic Risk/Epidemiology
- Postprandial Free Fatty Acids at Mid-Pregnancy Increase the Risk of Large-for-Gestational-Age Newborns in Women with Gestational Diabetes Mellitus
- So-Yeon Kim, Young Shin Song, Soo-Kyung Kim, Yong-Wook Cho, Kyung-Soo Kim
- Diabetes Metab J. 2022;46(1):140-148. Published online August 9, 2021
- DOI: https://doi.org/10.4093/dmj.2021.0023
- 5,016 View
- 160 Download
- 3 Web of Science
- 3 Crossref
-
Graphical Abstract
Abstract
PDFSupplementary MaterialPubReader ePub
- Background
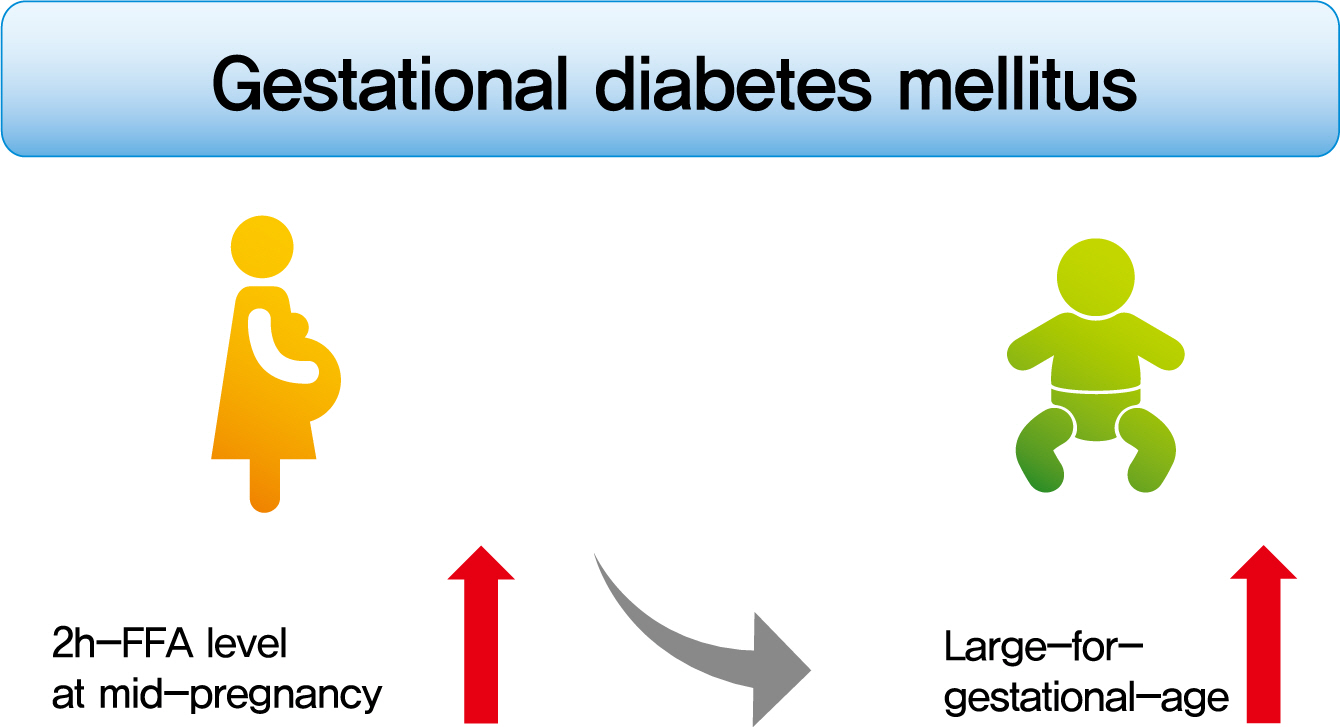
To investigate the association between free fatty acid (FFA) level at mid-pregnancy and large-for-gestational-age (LGA) newborns in women with gestational diabetes mellitus (GDM).
Methods
We enrolled 710 pregnant women diagnosed with GDM from February 2009 to October 2016. GDM was diagnosed by a ‘two-step’ approach with Carpenter and Coustan criteria. We measured plasma lipid profiles including fasting and 2-hour postprandial FFA (2h-FFA) levels at mid-pregnancy. LGA was defined if birthweights of newborns were above the 90th percentile for their gestational age.
Results
Mean age of pregnant women in this study was 33.1 years. Mean pre-pregnancy body mass index (BMI) was 22.4 kg/m2. The prevalence of LGA was 8.3% (n=59). Levels of 2h-FFA were higher in women who delivered LGA newborns than in those who delivered non-LGA newborns (416.7 μEq/L vs. 352.5 μEq/L, P=0.006). However, fasting FFA was not significantly different between the two groups. The prevalence of delivering LGA newborns was increased with increasing tertile of 2h-FFA (T1, 4.3%; T2, 9.8%; T3, 10.7%; P for trend <0.05). After adjustment for maternal age, pre-pregnancy BMI, and fasting plasma glucose, the highest tertile of 2h-FFA was 2.38 times (95% confidence interval, 1.11 to 5.13) more likely to have LGA newborns than the lowest tertile. However, there was no significant difference between groups according to fasting FFA tertiles.
Conclusion
In women with GDM, a high 2h-FFA level (but not fasting FFA) at mid-pregnancy is associated with an increasing risk of delivering LGA newborns. -
Citations
Citations to this article as recorded by- Advances in free fatty acid profiles in gestational diabetes mellitus
Haoyi Du, Danyang Li, Laura Monjowa Molive, Na Wu
Journal of Translational Medicine.2024;[Epub] CrossRef - Modulation of gut microbiota and lipid metabolism in rats fed high-fat diets by Ganoderma lucidum triterpenoids
Aijun Tong, Weihao Wu, Zhengxin Chen, Jiahui Wen, Ruibo Jia, Bin Liu, Hui Cao, Chao Zhao
Current Research in Food Science.2023; 6: 100427. CrossRef - Fetal Abdominal Obesity Detected at 24 to 28 Weeks of Gestation Persists until Delivery Despite Management of Gestational Diabetes Mellitus (Diabetes Metab J 2021;45:547-57)
Wonjin Kim, Soo Kyung Park, Yoo Lee Kim
Diabetes & Metabolism Journal.2021; 45(6): 970. CrossRef
- Advances in free fatty acid profiles in gestational diabetes mellitus
- Metabolic Risk/Epidemiology
- Fetal Abdominal Obesity Detected At 24 to 28 Weeks of Gestation Persists Until Delivery Despite Management of Gestational Diabetes Mellitus
- Wonjin Kim, Soo Kyung Park, Yoo Lee Kim
- Diabetes Metab J. 2021;45(4):547-557. Published online March 5, 2021
- DOI: https://doi.org/10.4093/dmj.2020.0078
- 5,863 View
- 185 Download
- 7 Web of Science
- 5 Crossref
-
Graphical Abstract
Abstract
PDFSupplementary MaterialPubReader ePub
- Background
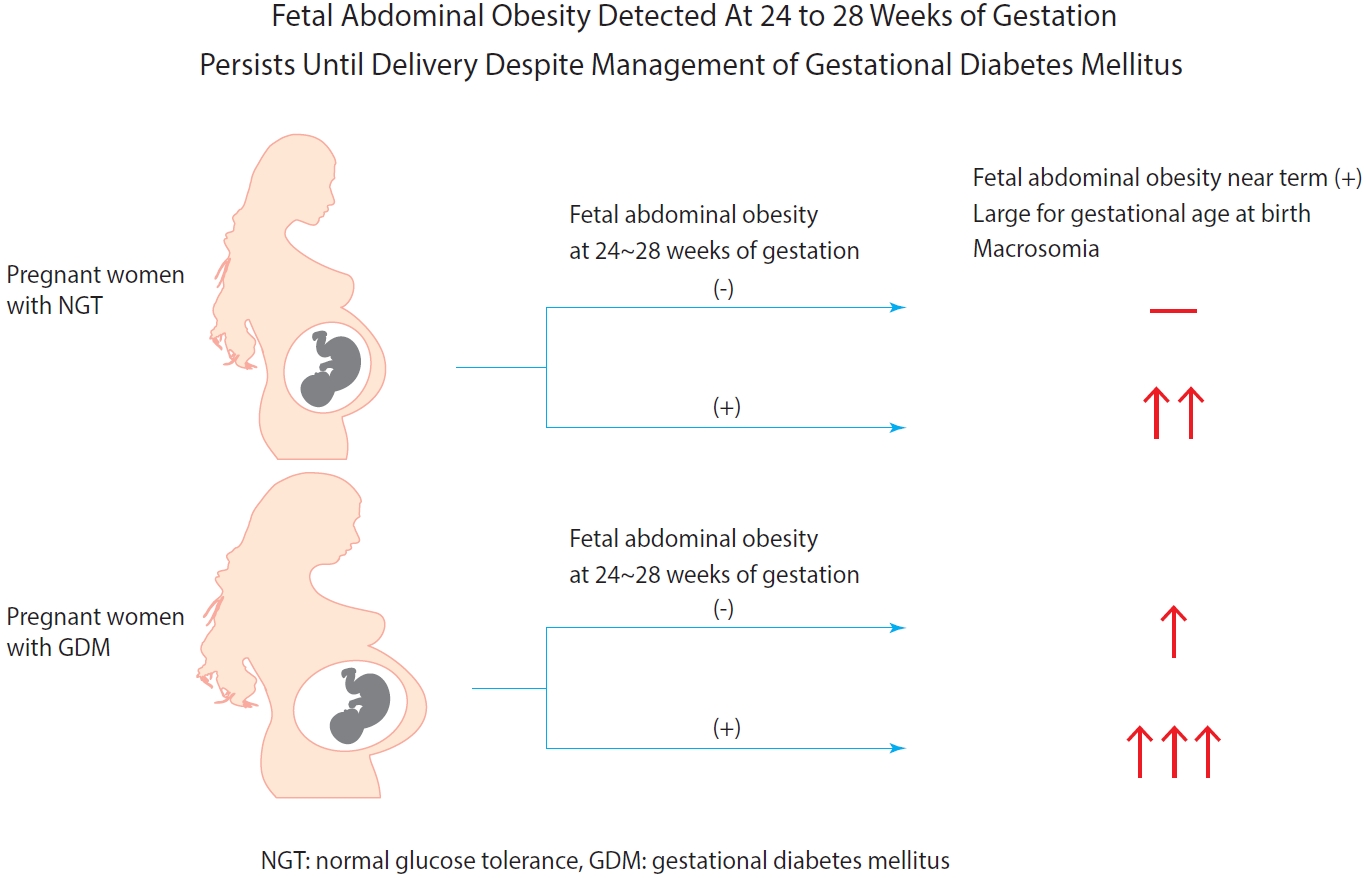
Fetal abdominal obesity (FAO) has been reported to be affected at gestational diabetes mellitus (GDM) diagnosis at 24 to 28 weeks of gestation in older and/or obese women. This study investigated whether the management of GDM improves FAO in GDM subjects near term.
Methods
Medical records of 7,099 singleton pregnant women delivering at CHA Gangnam Medical Center were reviewed retrospectively. GDM was diagnosed by 100-g oral glucose tolerance test after 50-g glucose challenge test based on Carpenter–Coustan criteria. GDM subjects were divided into four study groups according to maternal age and obesity. FAO was defined as ≥90th percentile of fetal abdominal overgrowth ratios (FAORs) of the ultrasonographically estimated gestational age (GA) of abdominal circumference per actual GA by the last menstruation period, biparietal diameter, or femur length, respectively.
Results
As compared with normal glucose tolerance (NGT) subjects near term, FAORs and odds ratio for FAO were significantly higher in old and/or obese women with GDM but not in young and nonobese women with GDM. For fetuses of GDM subjects with FAO at the time of GDM diagnosis, the odds ratio for exhibiting FAO near term and being large for GA at birth were 7.87 (95% confidence interval [CI], 4.38 to 14.15) and 10.96 (95% CI, 5.58 to 20.53) compared with fetuses of NGT subjects without FAO at GDM diagnosis.
Conclusion
Despite treatment, FAO detected at the time of GDM diagnosis persisted until delivery. Early diagnosis and treatment might be necessary to prevent near term FAO in high-risk older and/or obese women. -
Citations
Citations to this article as recorded by- The effects of gestational diabetes mellitus on fetal growth: is it different for low-risk and medium–high-risk pregnant women?
Jie Wang, Xin Cheng, Zhen-Hua Li, Yi-Cheng Mao, Xin-Qiang Wang, Kang-Di Zhang, Wen-Jie Yu, Ying-Qing Li, Jia-wen Zhao, Mao-Lin Chen, Guo-peng Gao, Cheng-Yang Hu, Xiu-Jun Zhang
Archives of Gynecology and Obstetrics.2023;[Epub] CrossRef - Fetal abdominal obesity and the ensuing adverse perinatal outcomes in older obese pregnant women with or without obesity and with normal glucose tolerance
Wonjin Kim, Soo Kyung Park, Yoo Lee Kim
Scientific Reports.2023;[Epub] CrossRef - Early-life exposure to gestational diabetes mellitus predisposes offspring to pediatric nonalcoholic fatty liver disease
Qian-Ren Zhang, Yan Dong, Jian-Gao Fan
Hepatobiliary & Pancreatic Diseases International.2023;[Epub] CrossRef - Gestational diabetes mellitus and adverse pregnancy outcomes: systematic review and meta-analysis
Wenrui Ye, Cong Luo, Jing Huang, Chenglong Li, Zhixiong Liu, Fangkun Liu
BMJ.2022; : e067946. CrossRef - Fetal abdominal overgrowth is already present at 20–24 gestational weeks prior to diagnosis of gestational diabetes mellitus
Wonjin Kim, Soo Kyung Park, Yoo Lee Kim
Scientific Reports.2021;[Epub] CrossRef
- The effects of gestational diabetes mellitus on fetal growth: is it different for low-risk and medium–high-risk pregnant women?
- Metabolic Risk/Epidemiology
- Maternal Hyperglycemia during Pregnancy Increases Adiposity of Offspring
- Hye Rim Chung, Joon Ho Moon, Jung Sub Lim, Young Ah Lee, Choong Ho Shin, Joon-Seok Hong, Soo Heon Kwak, Sung Hee Choi, Hak Chul Jang
- Diabetes Metab J. 2021;45(5):730-738. Published online February 22, 2021
- DOI: https://doi.org/10.4093/dmj.2020.0154
- 5,739 View
- 180 Download
- 6 Web of Science
- 6 Crossref
-
Graphical Abstract
Abstract
PDFSupplementary MaterialPubReader ePub
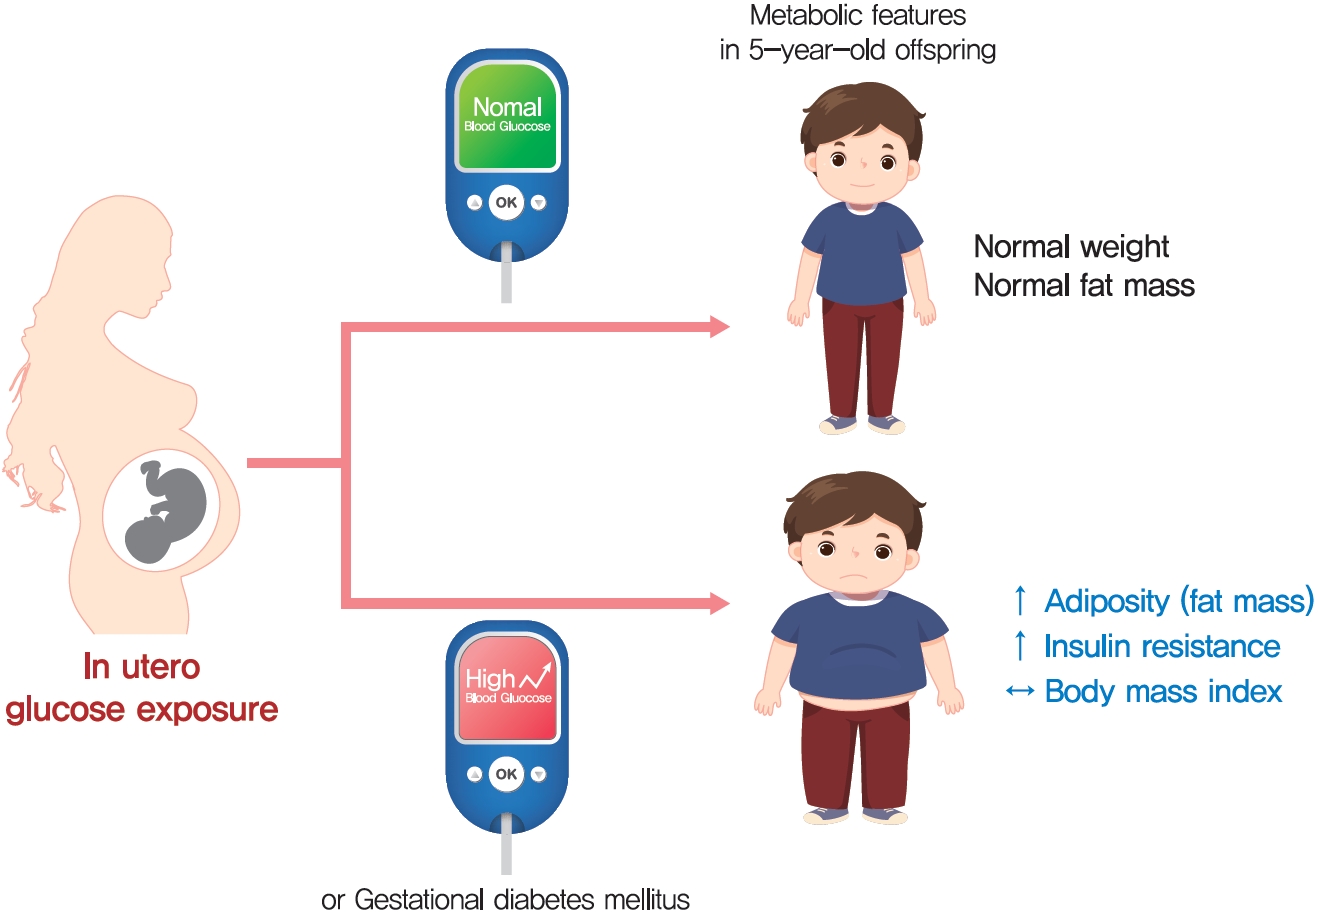
- Background
The effect of intrauterine hyperglycemia on fat mass and regional fat proportion of the offspring of mothers with gestational diabetes mellitus (OGDM) remains to be determined.
Methods
The body composition of OGDM (n=25) and offspring of normoglycemic mothers (n=49) was compared using dualenergy X-ray absorptiometry at age 5 years. The relationship between maternal glucose concentration during a 100 g oral glucose tolerance test (OGTT) and regional fat mass or proportion was analyzed after adjusting for maternal prepregnancy body mass index (BMI).
Results
BMI was comparable between OGDM and control (median, 16.0 kg/m2 vs. 16.1 kg/m2 ). Total, truncal, and leg fat mass were higher in OGDM compared with control (3,769 g vs. 2,245 g, P=0.004; 1,289 g vs. 870 g, P=0.017; 1,638 g vs. 961 g, P=0.002, respectively), whereas total lean mass was lower in OGDM (15,688 g vs. 16,941 g, P=0.001). Among OGDM, total and truncal fat mass were correlated with fasting and 3-hour glucose concentrations of maternal 100 g OGTT during pregnancy (total fat mass, r=0.49, P=0.018 [fasting], r=0.473, P=0.023 [3-hour]; truncal fat mass, r=0.571, P=0.004 [fasting], r=0.558, P=0.006 [3-hour]), but there was no correlation between OGDM leg fat mass and maternal OGTT during pregnancy. Regional fat indices were not correlated with concurrent maternal 75 g OGTT values.
Conclusion
Intrauterine hyperglycemia is associated with increased fat mass, especially truncal fat, in OGDM aged 5 years. -
Citations
Citations to this article as recorded by- Advances in free fatty acid profiles in gestational diabetes mellitus
Haoyi Du, Danyang Li, Laura Monjowa Molive, Na Wu
Journal of Translational Medicine.2024;[Epub] CrossRef - High-fat diet during pregnancy lowers fetal weight and has a long-lasting adverse effect on brown adipose tissue in the offspring
Mihoko Yamaguchi, Jun Mori, Nozomi Nishida, Satoshi Miyagaki, Yasuhiro Kawabe, Takeshi Ota, Hidechika Morimoto, Yusuke Tsuma, Shota Fukuhara, Takehiro Ogata, Takuro Okamaura, Naoko Nakanishi, Masahide Hamaguchi, Hisakazu Nakajima, Michiaki Fukui, Tomoko I
Journal of Developmental Origins of Health and Disease.2023; 14(2): 261. CrossRef - Prediction of gestational diabetes mellitus in Asian women using machine learning algorithms
Byung Soo Kang, Seon Ui Lee, Subeen Hong, Sae Kyung Choi, Jae Eun Shin, Jeong Ha Wie, Yun Sung Jo, Yeon Hee Kim, Kicheol Kil, Yoo Hyun Chung, Kyunghoon Jung, Hanul Hong, In Yang Park, Hyun Sun Ko
Scientific Reports.2023;[Epub] CrossRef - Effects of early standardized management on the growth trajectory of offspring with gestational diabetes mellitus at 0–5 years old: a preliminary longitudinal study
Bingbing Guo, Jingjing Pei, Yin Xu, Yajie Wang, Xinye Jiang
Scientific Reports.2023;[Epub] CrossRef - Gestational Diabetes Mellitus: Diagnostic Approaches and Maternal-Offspring Complications
Joon Ho Moon, Hak Chul Jang
Diabetes & Metabolism Journal.2022; 46(1): 3. CrossRef - Increased Pro-Inflammatory T Cells, Senescent T Cells, and Immune-Check Point Molecules in the Placentas of Patients With Gestational Diabetes Mellitus
Yea Eun Kang, Hyon-Seung Yi, Min-Kyung Yeo, Jung Tae Kim, Danbit Park, Yewon Jung, Ok Soon Kim, Seong Eun Lee, Ji Min Kim, Kyong Hye Joung, Ju Hee Lee, Bon Jeong Ku, Mina Lee, Hyun Jin Kim
Journal of Korean Medical Science.2022;[Epub] CrossRef
- Advances in free fatty acid profiles in gestational diabetes mellitus
- Metabolic Risk/Epidemiology
- A Vegetable Dietary Pattern Is Associated with Lowered Risk of Gestational Diabetes Mellitus in Chinese Women
- Qiong Chen, Weiwei Wu, Hailan Yang, Ping Zhang, Yongliang Feng, Keke Wang, Ying Wang, Suping Wang, Yawei Zhang
- Diabetes Metab J. 2020;44(6):887-896. Published online September 11, 2020
- DOI: https://doi.org/10.4093/dmj.2019.0138
- 6,591 View
- 135 Download
- 10 Web of Science
- 10 Crossref
-
Abstract
PDFSupplementary MaterialPubReader ePub
- Background
Identification of modifiable dietary factors, which are involved in the development of gestational diabetes mellitus (GDM), could inform strategies to prevent GDM.
Methods
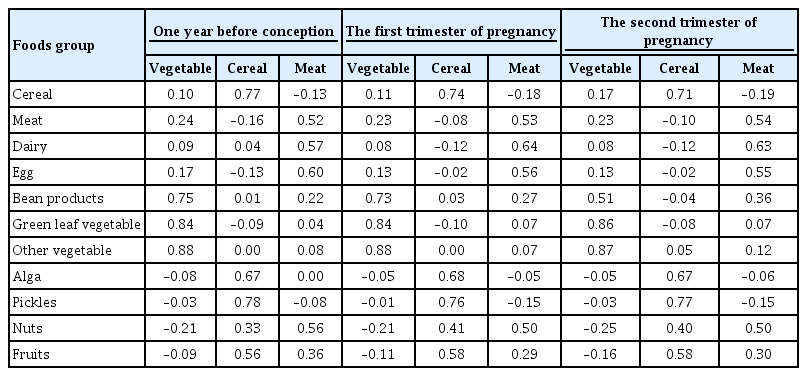
We examined the dietary patterns in a Chinese population and evaluated their relationship with GDM risk using a case-control study including 1,464 cases and 8,092 control subjects. Propensity score matching was used to reduce the imbalance of covariates between cases and controls. Dietary patterns were identified using factor analysis while their associations with GDM risk were evaluated using logistic regression models.
Results
A “vegetable” dietary pattern was characterized as the consumption of green leafy vegetables (Chinese little greens and bean seedling), other vegetables (cabbages, carrots, tomatoes, eggplants, potatoes, mushrooms, peppers, bamboo shoots, agarics, and garlic), and bean products (soybean milk, tofu, kidney beans, and cowpea). For every quartile increase in the vegetables factor score during 1 year prior to conception, the first trimester, and the second trimester of pregnancy, the GDM risk lowered by 6% (odds ratio [OR], 0.94; 95% confidence interval [CI], 0.89 to 0.99), 7% (OR, 0.94; 95% CI, 0.88 to 0.99), and 9% (OR, 0.91; 95% CI, 0.86 to 0.96).
Conclusion
In conclusion, our study suggests that the vegetable dietary pattern is associated with lower GDM risk; however, the interpretation of the result should with caution due to the limitations in our study, and additional studies are necessary to explore the underlying mechanism of this relationship. -
Citations
Citations to this article as recorded by- Maternal dietary components in the development of gestational diabetes mellitus: a systematic review of observational studies to timely promotion of health
Victoria Lambert, Sonia Edith Muñoz, Carla Gil, María Dolores Román
Nutrition Journal.2023;[Epub] CrossRef - Fruit, vegetable, and fruit juice consumption and risk of gestational diabetes mellitus: a systematic review and meta-analysis
Yan-Ping Liao, Qing-Xiang Zheng, Xiu-Min Jiang, Xiao-Qian Chen, Xiao-Xia Gao, Yu-Qing Pan
Nutrition Journal.2023;[Epub] CrossRef - The effects of plant-based dietary patterns on the risk of developing gestational diabetes mellitus: A systematic review and meta-analysis
Yu Zhu, QingXiang Zheng, Ling Huang, XiuMin Jiang, XiaoXia Gao, JiaNing Li, RuLin Liu, Kent Lai
PLOS ONE.2023; 18(10): e0291732. CrossRef - Molecular pathways and nutrigenomic review of insulin resistance development in gestational diabetes mellitus
Patricia Guevara-Ramírez, Elius Paz-Cruz, Santiago Cadena-Ullauri, Viviana A. Ruiz-Pozo, Rafael Tamayo-Trujillo, Maria L. Felix, Daniel Simancas-Racines, Ana Karina Zambrano
Frontiers in Nutrition.2023;[Epub] CrossRef - Effectiveness of pre-pregnancy lifestyle in preventing gestational diabetes mellitus—a systematic review and meta-analysis of 257,876 pregnancies
Swetha Sampathkumar, Durga Parkhi, Yonas Ghebremichael-Weldeselassie, Nithya Sukumar, Ponnusamy Saravanan
Nutrition & Diabetes.2023;[Epub] CrossRef - Gestational Diabetes Mellitus: The Crosslink among Inflammation, Nitroxidative Stress, Intestinal Microbiota and Alternative Therapies
Elaine Luiza Santos Soares de Mendonça, Marilene Brandão Tenório Fragoso, Jerusa Maria de Oliveira, Jadriane Almeida Xavier, Marília Oliveira Fonseca Goulart, Alane Cabral Menezes de Oliveira
Antioxidants.2022; 11(1): 129. CrossRef - Ferulic acid targets ACSL1 to ameliorate lipid metabolic disorders in db/db mice
Jie Gao, Xue Gu, Manqian Zhang, Xingwang Zu, Fukui Shen, Xiaotao Hou, Erwei Hao, Gang Bai
Journal of Functional Foods.2022; 91: 105009. CrossRef - Effect of dietary pattern on pregnant women with gestational diabetes mellitus and its clinical significance
Jianping Wang, Zuoliang Xie, Peipei Chen, Yuhuan Wang, Baoqing Li, Fen Dai
Open Life Sciences.2022; 17(1): 202. CrossRef - Dietary Protein Patterns during Pregnancy Are Associated with Risk of Gestational Diabetes Mellitus in Chinese Pregnant Women
Weijia Wu, Nu Tang, Jingjing Zeng, Jin Jing, Li Cai
Nutrients.2022; 14(8): 1623. CrossRef - Dietary Acid Load Is Positively Associated With Risk of Gestational Diabetes Mellitus in a Prospective Cohort of Chinese Pregnant Women
Rui Zhao, Leilei Zhou, Gang Lei, Shanshan Wang, Yan Li, Xuefeng Yang, Guoping Xiong, Liping Hao
Frontiers in Nutrition.2022;[Epub] CrossRef
- Maternal dietary components in the development of gestational diabetes mellitus: a systematic review of observational studies to timely promotion of health
- Metabolic Risk/Epidemiology
- A Comparison of Predictive Performances between Old versus New Criteria in a Risk-Based Screening Strategy for Gestational Diabetes Mellitus
- Subeen Hong, Seung Mi Lee, Soo Heon Kwak, Byoung Jae Kim, Ja Nam Koo, Ig Hwan Oh, Sohee Oh, Sun Min Kim, Sue Shin, Won Kim, Sae Kyung Joo, Errol R. Norwitz, Souphaphone Louangsenlath, Chan-Wook Park, Jong Kwan Jun, Joong Shin Park
- Diabetes Metab J. 2020;44(5):726-736. Published online April 13, 2020
- DOI: https://doi.org/10.4093/dmj.2019.0126
- 6,629 View
- 123 Download
- 9 Web of Science
- 9 Crossref
-
Abstract
PDFSupplementary MaterialPubReader ePub
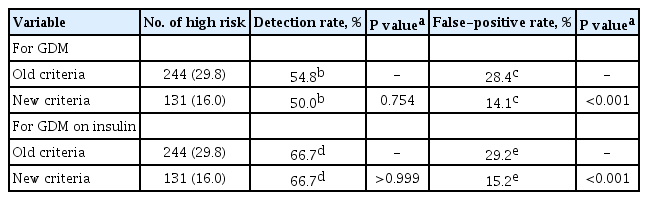
Background The definition of the high-risk group for gestational diabetes mellitus (GDM) defined by the American College of Obstetricians and Gynecologists was changed from the criteria composed of five historic/demographic factors (old criteria) to the criteria consisting of 11 factors (new criteria) in 2017. To compare the predictive performances between these two sets of criteria.
Methods This is a secondary analysis of a large prospective cohort study of non-diabetic Korean women with singleton pregnancies designed to examine the risk of GDM in women with nonalcoholic fatty liver disease. Maternal fasting blood was taken at 10 to 14 weeks of gestation and measured for glucose and lipid parameters. GDM was diagnosed by the two-step approach.
Results Among 820 women, 42 (5.1%) were diagnosed with GDM. Using the old criteria, 29.8% (
n =244) of women would have been identified as high risk versus 16.0% (n =131) using the new criteria. Of the 42 women who developed GDM, 45.2% (n =19) would have been mislabeled as not high risk by the old criteria versus 50.0% (n =21) using the new criteria (1-sensitivity, 45.2% vs. 50.0%,P >0.05). Among the 778 patients who did not develop GDM, 28.4% (n =221) would have been identified as high risk using the old criteria versus 14.1% (n =110) using the new criteria (1-specificity, 28.4% vs. 14.1%,P <0.001).Conclusion Compared with the old criteria, use of the new criteria would have decreased the number of patients identified as high risk and thus requiring early GDM screening by half (from 244 [29.8%] to 131 [16.0%]).
-
Citations
Citations to this article as recorded by- Predicting the Risk of Insulin-Requiring Gestational Diabetes before Pregnancy: A Model Generated from a Nationwide Population-Based Cohort Study in Korea
Seung-Hwan Lee, Jin Yu, Kyungdo Han, Seung Woo Lee, Sang Youn You, Hun-Sung Kim, Jae-Hyoung Cho, Kun-Ho Yoon, Mee Kyoung Kim
Endocrinology and Metabolism.2023; 38(1): 129. CrossRef - Metabolic Dysfunction-Associated Fatty Liver Disease and Subsequent Development of Adverse Pregnancy Outcomes
Seung Mi Lee, Young Mi Jung, Eun Saem Choi, Soo Heon Kwak, Ja Nam Koo, Ig Hwan Oh, Byoung Jae Kim, Sun Min Kim, Sang Youn Kim, Gyoung Min Kim, Sae Kyung Joo, Bo Kyung Koo, Sue Shin, Errol R. Norwitz, Chan-Wook Park, Jong Kwan Jun, Won Kim, Joong Shin Park
Clinical Gastroenterology and Hepatology.2022; 20(11): 2542. CrossRef - Nonalcoholic fatty liver disease and early prediction of gestational diabetes mellitus using machine learning methods
Seung Mi Lee, Suhyun Hwangbo, Errol R. Norwitz, Ja Nam Koo, Ig Hwan Oh, Eun Saem Choi, Young Mi Jung, Sun Min Kim, Byoung Jae Kim, Sang Youn Kim, Gyoung Min Kim, Won Kim, Sae Kyung Joo, Sue Shin, Chan-Wook Park, Taesung Park, Joong Shin Park
Clinical and Molecular Hepatology.2022; 28(1): 105. CrossRef - Nonalcoholic fatty liver disease-based risk prediction of adverse pregnancy outcomes: Ready for prime time?
Seung Mi Lee, Won Kim
Clinical and Molecular Hepatology.2022; 28(1): 47. CrossRef - Postprandial Free Fatty Acids at Mid-Pregnancy Increase the Risk of Large-for-Gestational-Age Newborns in Women with Gestational Diabetes Mellitus
So-Yeon Kim, Young Shin Song, Soo-Kyung Kim, Yong-Wook Cho, Kyung-Soo Kim
Diabetes & Metabolism Journal.2022; 46(1): 140. CrossRef - Effect of Different Types of Diagnostic Criteria for Gestational Diabetes Mellitus on Adverse Neonatal Outcomes: A Systematic Review, Meta-Analysis, and Meta-Regression
Fahimeh Ramezani Tehrani, Marzieh Saei Ghare Naz, Razieh Bidhendi-Yarandi, Samira Behboudi-Gandevani
Diabetes & Metabolism Journal.2022; 46(4): 605. CrossRef - Development of early prediction model for pregnancy-associated hypertension with graph-based semi-supervised learning
Seung Mi Lee, Yonghyun Nam, Eun Saem Choi, Young Mi Jung, Vivek Sriram, Jacob S. Leiby, Ja Nam Koo, Ig Hwan Oh, Byoung Jae Kim, Sun Min Kim, Sang Youn Kim, Gyoung Min Kim, Sae Kyung Joo, Sue Shin, Errol R. Norwitz, Chan-Wook Park, Jong Kwan Jun, Won Kim,
Scientific Reports.2022;[Epub] CrossRef - The Clinical Characteristics of Gestational Diabetes Mellitus in Korea: A National Health Information Database Study
Kyung-Soo Kim, Sangmo Hong, Kyungdo Han, Cheol-Young Park
Endocrinology and Metabolism.2021; 36(3): 628. CrossRef - The risk of pregnancy‐associated hypertension in women with nonalcoholic fatty liver disease
Young Mi Jung, Seung Mi Lee, Subeen Hong, Ja Nam Koo, Ig Hwan Oh, Byoung Jae Kim, Sun Min Kim, Sang Youn Kim, Gyoung Min Kim, Sae Kyung Joo, Sue Shin, Errol R. Norwitz, Chan‐Wook Park, Jong Kwan Jun, Won Kim, Joong Shin Park
Liver International.2020; 40(10): 2417. CrossRef
- Predicting the Risk of Insulin-Requiring Gestational Diabetes before Pregnancy: A Model Generated from a Nationwide Population-Based Cohort Study in Korea
- Metabolic Risk/Epidemiology
- Glucose Effectiveness from Short Insulin-Modified IVGTT and Its Application to the Study of Women with Previous Gestational Diabetes Mellitus
- Micaela Morettini, Carlo Castriota, Christian Göbl, Alexandra Kautzky-Willer, Giovanni Pacini, Laura Burattini, Andrea Tura
- Diabetes Metab J. 2020;44(2):286-294. Published online January 13, 2020
- DOI: https://doi.org/10.4093/dmj.2019.0016
- 4,940 View
- 82 Download
- 4 Web of Science
- 3 Crossref
-
Abstract
PDFPubReader
Background This study aimed to design a simple surrogate marker (i.e., predictor) of the minimal model glucose effectiveness (SG), namely calculated SG (CSG), from a short insulin-modified intravenous glucose tolerance test (IM-IVGTT), and then to apply it to study women with previous gestational diabetes mellitus (pGDM).
Methods CSG was designed using the stepwise model selection approach on a population of subjects (
n =181) ranging from normal tolerance to type 2 diabetes mellitus (T2DM). CSG was then tested on a population of women with pGDM (n =57). Each subject underwent a 3-hour IM-IVGTT; women with pGDM were observed early postpartum and after a follow-up period of up to 7 years and classified as progressors (PROG) or non-progressors (NONPROG) to T2DM. The minimal model analysis provided a reference SG.Results CSG was described as CSG=1.06×10⁻²+5.71×10⁻²×KG/Gpeak, KG being the mean slope (absolute value) of loge glucose in 10–25- and 25–50-minute intervals, and Gpeak being the maximum of the glucose curve. Good agreement between CSG and SG in the general population and in the pGDM group, both at baseline and follow-up (even in PROG and NONPROG subgroups), was shown by the Bland-Altman plots (<5% observations outside limits of agreement), and by the test for equivalence (equivalence margin not higher than one standard deviation). At baseline, the PROG subgroup showed significantly lower SG and CSG values compared to the NONPROG subgroup (
P <0.03).Conclusion CSG is a valid SG predictor. In the pGDM group, glucose effectiveness appeared to be impaired in women progressing to T2DM.
-
Citations
Citations to this article as recorded by- Postprandial Free Fatty Acids at Mid-Pregnancy Increase the Risk of Large-for-Gestational-Age Newborns in Women with Gestational Diabetes Mellitus
So-Yeon Kim, Young Shin Song, Soo-Kyung Kim, Yong-Wook Cho, Kyung-Soo Kim
Diabetes & Metabolism Journal.2022; 46(1): 140. CrossRef - Unraveling the Factors Determining Development of Type 2 Diabetes in Women With a History of Gestational Diabetes Mellitus Through Machine-Learning Techniques
Ludovica Ilari, Agnese Piersanti, Christian Göbl, Laura Burattini, Alexandra Kautzky-Willer, Andrea Tura, Micaela Morettini
Frontiers in Physiology.2022;[Epub] CrossRef - The Clinical Characteristics of Gestational Diabetes Mellitus in Korea: A National Health Information Database Study
Kyung-Soo Kim, Sangmo Hong, Kyungdo Han, Cheol-Young Park
Endocrinology and Metabolism.2021; 36(3): 628. CrossRef
- Postprandial Free Fatty Acids at Mid-Pregnancy Increase the Risk of Large-for-Gestational-Age Newborns in Women with Gestational Diabetes Mellitus
- Clinical Diabetes & Therapeutics
- Early Assessment of the Risk for Gestational Diabetes Mellitus: Can Fasting Parameters of Glucose Metabolism Contribute to Risk Prediction?
- Veronica Falcone, Grammata Kotzaeridi, Melanie Hanne Breil, Ingo Rosicky, Tina Stopp, Gülen Yerlikaya-Schatten, Michael Feichtinger, Wolfgang Eppel, Peter Husslein, Andrea Tura, Christian S. Göbl
- Diabetes Metab J. 2019;43(6):785-793. Published online March 12, 2019
- DOI: https://doi.org/10.4093/dmj.2018.0218
- 8,031 View
- 80 Download
- 20 Web of Science
- 24 Crossref
-
Abstract
PDFPubReader
Background An early identification of the risk groups might be beneficial in reducing morbidities in patients with gestational diabetes mellitus (GDM). Therefore, this study aimed to assess the biochemical predictors of glycemic conditions, in addition to fasting indices of glucose disposal, to predict the development of GDM in later stage and the need of glucose-lowering medication.
Methods A total of 574 pregnant females (103 with GDM and 471 with normal glucose tolerance [NGT]) were included. A metabolic characterization was performed before 15+6 weeks of gestation by assessing fasting plasma glucose (FPG), fasting insulin (FI), fasting C-peptide (FCP), and glycosylated hemoglobin (HbA1c). Thereafter, the patients were followed-up until the delivery.
Results Females with NGT had lower levels of FPG, FI, FCP, or HbA1c at the early stage of pregnancy, and therefore, showed an improved insulin action as compared to that in females who developed GDM. Higher fasting levels of FPG and FCP were associated with a higher risk of developing GDM. Moreover, the predictive accuracy of this metabolic profiling was also good to distinguish the patients who required glucose-lowering medications. Indices of glucose disposal based on C-peptide improved the predictive accuracy compared to that based on insulin. A modified quantitative insulin sensitivity check index (QUICKIc) showed the best differentiation in terms of predicting GDM (area under the receiver operating characteristics curve [ROC-AUC], 72.1%) or need for pharmacotherapy (ROC-AUC, 83.7%).
Conclusion Fasting measurements of glucose and C-peptide as well as the surrogate indices of glycemic condition could be used for stratifying pregnant females with higher risk of GDM at the beginning of pregnancy.
-
Citations
Citations to this article as recorded by- Maternal fasting serum C-peptide concentrations in the first and second trimesters and subsequent risk of gestational diabetes mellitus: A nested case-control study among Chinese women
Chuanyu Zhao, Haiyan Liu, Yuzhi Deng, Hanbin Wu, Shuo Wang, Xinyi Lyu, Jueming Lei, Haishan Yang, Meina Hu, Yinzhu Zhao, Xu Ma, Xiaoxuan Zou, Ying Yang
Diabetes Research and Clinical Practice.2024; 208: 111111. CrossRef - Future clinical prospects of C-peptide testing in the early diagnosis of gestational diabetes
Charalampos Milionis, Ioannis Ilias, Anastasia Lekkou, Evangelia Venaki, Eftychia Koukkou
World Journal of Experimental Medicine.2024;[Epub] CrossRef - Early prediction of gestational diabetes mellitus using maternal demographic and clinical risk factors
Yanqi Wu, Paul Hamelmann, Myrthe van der Ven, Sima Asvadi, M. Beatrijs van der Hout-van der Jagt, S. Guid Oei, Massimo Mischi, Jan Bergmans, Xi Long
BMC Research Notes.2024;[Epub] CrossRef - Gestationsdiabetes (GDM) (Update 2023)
Alexandra Kautzky-Willer, Yvonne Winhofer, Herbert Kiss, Veronica Falcone, Angelika Berger, Monika Lechleitner, Raimund Weitgasser, Jürgen Harreiter
Wiener klinische Wochenschrift.2023; 135(S1): 115. CrossRef - MIDO GDM: an innovative artificial intelligence-based prediction model for the development of gestational diabetes in Mexican women
Héctor Gallardo-Rincón, María Jesús Ríos-Blancas, Janinne Ortega-Montiel, Alejandra Montoya, Luis Alberto Martinez-Juarez, Julieta Lomelín-Gascón, Rodrigo Saucedo-Martínez, Ricardo Mújica-Rosales, Victoria Galicia-Hernández, Linda Morales-Juárez, Lucía Ma
Scientific Reports.2023;[Epub] CrossRef - Progress in the Prediction of Gestational Diabetes Mellitus by the Combined Detection of Fasting Blood Glucose and Hemoglobin in Early Pregnancy
欢欢 赵
Advances in Clinical Medicine.2023; 13(06): 9980. CrossRef - HOMA‐IR as a risk factor of gestational diabetes mellitus and a novel simple surrogate index in early pregnancy
Shuoning Song, Yuemei Zhang, Xiaolin Qiao, Yanbei Duo, Jiyu Xu, Zhenyao Peng, Jing Zhang, Yan Chen, Xiaorui Nie, Qiujin Sun, Xianchun Yang, Zechun Lu, Shixuan Liu, Tianyi Zhao, Tao Yuan, Yong Fu, Yingyue Dong, Weigang Zhao, Wei Sun, Ailing Wang
International Journal of Gynecology & Obstetrics.2022; 157(3): 694. CrossRef - The diagnostic value of glycosylated hemoglobin for gestational diabetes mellitus in Asian populations: A systematic review and meta‐analysis
Jiani Zhang, Fan Zhou, Tingting Xu, Jinfeng Xu, Yaqian Li, Li Lin, Qi Cao, Xiaodong Wang
Journal of Obstetrics and Gynaecology Research.2022; 48(4): 902. CrossRef - Postprandial Free Fatty Acids at Mid-Pregnancy Increase the Risk of Large-for-Gestational-Age Newborns in Women with Gestational Diabetes Mellitus
So-Yeon Kim, Young Shin Song, Soo-Kyung Kim, Yong-Wook Cho, Kyung-Soo Kim
Diabetes & Metabolism Journal.2022; 46(1): 140. CrossRef - Gestational Diabetes Mellitus in Pregnant Women with Beta-Thalassemia Minor: A Matched Case-Control Study
Veronica Falcone, Florian Heinzl, Bianca Karla Itariu, Theresa Reischer, Stephanie Springer, Dana Anaïs Muin, Petra Pateisky, Philipp Foessleitner, Johannes Ott, Alex Farr, Klara Rosta
Journal of Clinical Medicine.2022; 11(7): 2050. CrossRef - Maternal metabolic factors and the association with gestational diabetes: A systematic review and meta‐analysis
Nahal Habibi, Aya Mousa, Chau Thien Tay, Mahnaz Bahri Khomami, Rhiannon K. Patten, Prabha H. Andraweera, Molla Wassie, Jared Vandersluys, Ali Aflatounian, Tina Bianco‐Miotto, Shao J. Zhou, Jessica A. Grieger
Diabetes/Metabolism Research and Reviews.2022;[Epub] CrossRef - Impact Of Prepregnancy Overweight And Obesity On Treatment Modality And Pregnancy Outcome In Women With Gestational Diabetes Mellitus
Tina Linder, Anna Eder, Cécile Monod, Ingo Rosicky, Daniel Eppel, Katharina Redling, Franziska Geissler, Evelyn A. Huhn, Irene Hösli, Christian S. Göbl
Frontiers in Endocrinology.2022;[Epub] CrossRef - Identification of potential gene markers in gestational diabetes mellitus
Weichun Tang, Xiaoyu Wang, Liping Chen, Yiling Lu, Xinyi Kang
Journal of Clinical Laboratory Analysis.2022;[Epub] CrossRef - Association between early-pregnancy serum C-peptide and risk of gestational diabetes mellitus: a nested case–control study among Chinese women
Xue Yang, Yi Ye, Yi Wang, Ping Wu, Qi Lu, Yan Liu, Jiaying Yuan, Xingyue Song, Shijiao Yan, Xiaorong Qi, Yi-Xin Wang, Ying Wen, Gang Liu, Chuanzhu Lv, Chun-Xia Yang, An Pan, Jianli Zhang, Xiong-Fei Pan
Nutrition & Metabolism.2022;[Epub] CrossRef - Early Predictors of Gestational Diabetes Mellitus in IVF-Conceived Pregnancies
Ayla Coussa, Hayder A. Hasan, Thomas M. Barber
Endocrine Practice.2021; 27(6): 579. CrossRef - The Clinical Characteristics of Gestational Diabetes Mellitus in Korea: A National Health Information Database Study
Kyung-Soo Kim, Sangmo Hong, Kyungdo Han, Cheol-Young Park
Endocrinology and Metabolism.2021; 36(3): 628. CrossRef - Early Gestational Diabetes Mellitus: Diagnostic Strategies and Clinical Implications
Saptarshi Bhattacharya, Lakshmi Nagendra, Aishwarya Krishnamurthy, Om J. Lakhani, Nitin Kapoor, Bharti Kalra, Sanjay Kalra
Medical Sciences.2021; 9(4): 59. CrossRef - Early markers of gestational diabetes mellitus
Vedrana Ivić, Jasenka Wagner, Andrijana Müller, Lada Zibar, Marta Kadivnik, Barbara Viljetić, Jelena Omazić
Biochemia medica.2021; 31(3): 416. CrossRef - Response: Early Assessment of the Risk for Gestational Diabetes Mellitus: Can Fasting Parameters of Glucose Metabolism Contribute to Risk Prediction? (Diabetes Metab J 2019;43:785–93)
Christian S. Göbl, Andrea Tura
Diabetes & Metabolism Journal.2020; 44(1): 209. CrossRef - First-trimester fasting glycemia as a predictor of gestational diabetes (GDM) and adverse pregnancy outcomes
G. Sesmilo, P. Prats, S. Garcia, I. Rodríguez, A. Rodríguez-Melcón, I. Berges, B. Serra
Acta Diabetologica.2020; 57(6): 697. CrossRef - Letter: Early Assessment of the Risk for Gestational Diabetes Mellitus: Can Fasting Parameters of Glucose Metabolism Contribute to Risk Prediction? (Diabetes Metab J 2019;43:785–93)
Ye Seul Yang, Hye Seung Jung
Diabetes & Metabolism Journal.2020; 44(1): 199. CrossRef - Auch schon im 1. Trimenon ist Nüchternglukose Prädiktor für Gestationsdiabetes
Jens Stupin
Info Diabetologie.2020; 14(2): 14. CrossRef - Comparison of Machine Learning Methods and Conventional Logistic Regressions for Predicting Gestational Diabetes Using Routine Clinical Data: A Retrospective Cohort Study
Yunzhen Ye, Yu Xiong, Qiongjie Zhou, Jiangnan Wu, Xiaotian Li, Xirong Xiao
Journal of Diabetes Research.2020; 2020: 1. CrossRef - Predictive Power of Unconjugated Estriol in Diagnosis of Gestational Diabetes: A Cohort Study
Azam Amirian, Nourossadat Kariman, Mehdi Hedayati, Nasrin Borumandnia, Zohre Sheikhan
Iranian Red Crescent Medical Journal.2019;[Epub] CrossRef
- Maternal fasting serum C-peptide concentrations in the first and second trimesters and subsequent risk of gestational diabetes mellitus: A nested case-control study among Chinese women
- Clinical Care/Education
- Pregnancy Outcomes of Women Additionally Diagnosed as Gestational Diabetes by the International Association of the Diabetes and Pregnancy Study Groups Criteria
- Min Hyoung Kim, Soo Heon Kwak, Sung-Hoon Kim, Joon Seok Hong, Hye Rim Chung, Sung Hee Choi, Moon Young Kim, Hak C. Jang
- Diabetes Metab J. 2019;43(6):766-775. Published online February 28, 2019
- DOI: https://doi.org/10.4093/dmj.2018.0192
- 5,995 View
- 89 Download
- 26 Web of Science
- 28 Crossref
-
Abstract
PDFPubReader
Background We investigated the pregnancy outcomes in women who were diagnosed with gestational diabetes mellitus (GDM) by the International Association of the Diabetes and Pregnancy Study Groups (IADPSG) criteria but not by the Carpenter-Coustan (CC) criteria.
Methods A total of 8,735 Korean pregnant women were identified at two hospitals between 2014 and 2016. Among them, 2,038 women participated in the prospective cohort to investigate pregnancy outcomes. Diagnosis of GDM was made via two-step approach with 50-g glucose challenge test for screening followed by diagnostic 2-hour 75-g oral glucose tolerance test. Women were divided into three groups: non-GDM, GDM diagnosed exclusively by the IADPSG criteria, and GDM diagnosed by the CC criteria.
Results The incidence of GDM was 2.1% according to the CC criteria, and 4.1% by the IADPSG criteria. Women diagnosed with GDM by the IADPSG criteria had a higher body mass index (22.0±3.1 kg/m2 vs. 21.0±2.8 kg/m2,
P <0.001) and an increased risk of preeclampsia (odds ratio [OR], 6.90; 95% confidence interval [CI], 1.84 to 25.87;P =0.004) compared to non-GDM women. Compared to neonates of the non-GDM group, those of the IADPSG GDM group had an increased risk of being large for gestational age (OR, 2.39; 95% CI, 1.50 to 3.81;P <0.001), macrosomia (OR, 2.53; 95% CI, 1.26 to 5.10;P =0.009), and neonatal hypoglycemia (OR, 3.84; 95% CI, 1.01 to 14.74;P =0.049); they were also at an increased risk of requiring phototherapy (OR, 1.57; 95% CI, 1.07 to 2.31;P =0.022) compared to the non-GDM group.Conclusion The IADPSG criteria increased the incidence of GDM by nearly three-fold, and women diagnosed with GDM by the IADPSG criteria had an increased risk of adverse pregnancy outcomes in Korea.
-
Citations
Citations to this article as recorded by- Gestational diabetes mellitus and adverse maternal and perinatal outcomes in twin and singleton pregnancies: a systematic review and meta-analysis
Elena Greco, Maria Calanducci, Kypros H. Nicolaides, Eleanor V.H. Barry, Mohammed S.B. Huda, Stamatina Iliodromiti
American Journal of Obstetrics and Gynecology.2024; 230(2): 213. CrossRef - Neonatal outcomes according to different glucose threshold values in gestational diabetes: a register-based study
Kaisa Kariniemi, Marja Vääräsmäki, Tuija Männistö, Sanna Mustaniemi, Eero Kajantie, Sanna Eteläinen, Elina Keikkala, Anneli Pouta, Risto Kaaja, Johan G Eriksson, Hannele Laivuori, Mika Gissler
BMC Pregnancy and Childbirth.2024;[Epub] CrossRef - Pregnancy complications in women with pregestational and gestational diabetes mellitus
Lukas Reitzle, Christin Heidemann, Jens Baumert, Matthias Kaltheuner, Heinke Adamczewski, Andrea Icks, Christa Scheidt-Nave
Deutsches Ärzteblatt international.2023;[Epub] CrossRef - Predicting the Risk of Insulin-Requiring Gestational Diabetes before Pregnancy: A Model Generated from a Nationwide Population-Based Cohort Study in Korea
Seung-Hwan Lee, Jin Yu, Kyungdo Han, Seung Woo Lee, Sang Youn You, Hun-Sung Kim, Jae-Hyoung Cho, Kun-Ho Yoon, Mee Kyoung Kim
Endocrinology and Metabolism.2023; 38(1): 129. CrossRef - Treatment of women with mild gestational diabetes mellitus decreases the risk of adverse perinatal outcomes
Fanny Goyette, Bi Lan Wo, Marie-Hélène Iglesias, Evelyne Rey, Ariane Godbout
Diabetes & Metabolism.2023; 49(4): 101458. CrossRef - Maternal and fetal outcomes of pregnancies associated with single versus double abnormal values in 100 gr glucose tolerance test
Mohammadali Shahriari, Ali Shahriari, Maryam Khooshideh, Anahita Dehghaninezhad, Arezoo Maleki-Hajiagha, Rana Karimi
Journal of Diabetes & Metabolic Disorders.2023; 22(2): 1347. CrossRef - Diagnosis and management of gestational diabetes mellitus
Tae Jung Oh
Journal of the Korean Medical Association.2023; 66(7): 414. CrossRef - Update on gestational diabetes and adverse pregnancy outcomes
Bryan Ugwudike, ManHo Kwok
Current Opinion in Obstetrics & Gynecology.2023; 35(5): 453. CrossRef - Effects of early standardized management on the growth trajectory of offspring with gestational diabetes mellitus at 0–5 years old: a preliminary longitudinal study
Bingbing Guo, Jingjing Pei, Yin Xu, Yajie Wang, Xinye Jiang
Scientific Reports.2023;[Epub] CrossRef - Can Triglyceride/Glucose Index (TyG) and Triglyceride/HDL-Cholesterol Ratio (TG/HDL-c) Predict Gestational Diabetes Mellitus?
Seval YILMAZ ERGANİ, Tolgay Tuyan İLHAN, Betül TOKGÖZ, Burak BAYRAKTAR, Mevlüt BUCAK, Müjde Can İBANOĞLU, Kadriye YAKUT YÜCEL, Kadriye ERDOĞAN, Cantekin İSKENDER, Yaprak ÜSTÜN
Ankara Eğitim ve Araştırma Hastanesi Tıp Dergisi.2023; 56(2): 117. CrossRef - Risk factors for postpartum urinary incontinence: The impact of early-onset and late-onset Gestational Diabetes Mellitus in a nested case-control study
Carlos I. Sartorão Filho, Fabiane A. Pinheiro, Luiz Takano, Caroline B. Prudêncio, Sthefanie K. Nunes, Hallur RLS, Iracema M.P. Calderon, Angélica M.P. Barbosa, Marilza V.C. Rudge
European Journal of Obstetrics & Gynecology and Reproductive Biology.2023; 290: 5. CrossRef - Review of the Screening Guidelines for Gestational Diabetes Mellitus: How to Choose Wisely
Ravleen Kaur Bakshi, Akshay Kumar, Vandana Gupta, A.G. Radhika, Puneet Misra, Pankaj Bhardwaj
Indian Journal of Community Medicine.2023; 48(6): 828. CrossRef - Postprandial Free Fatty Acids at Mid-Pregnancy Increase the Risk of Large-for-Gestational-Age Newborns in Women with Gestational Diabetes Mellitus
So-Yeon Kim, Young Shin Song, Soo-Kyung Kim, Yong-Wook Cho, Kyung-Soo Kim
Diabetes & Metabolism Journal.2022; 46(1): 140. CrossRef - Gestational Diabetes Mellitus: Diagnostic Approaches and Maternal-Offspring Complications
Joon Ho Moon, Hak Chul Jang
Diabetes & Metabolism Journal.2022; 46(1): 3. CrossRef - Risk and Risk Factors for Postpartum Type 2 Diabetes Mellitus in Women with Gestational Diabetes: A Korean Nationwide Cohort Study
Mi Jin Choi, Jimi Choi, Chae Weon Chung
Endocrinology and Metabolism.2022; 37(1): 112. CrossRef - Gestational diabetes mellitus: current screening problems
N. I. Volkova, S. O. Panenko
Diabetes mellitus.2022; 25(1): 72. CrossRef - Gestational diabetes mellitus and adverse pregnancy outcomes: systematic review and meta-analysis
Wenrui Ye, Cong Luo, Jing Huang, Chenglong Li, Zhixiong Liu, Fangkun Liu
BMJ.2022; : e067946. CrossRef - Effect of Different Types of Diagnostic Criteria for Gestational Diabetes Mellitus on Adverse Neonatal Outcomes: A Systematic Review, Meta-Analysis, and Meta-Regression
Fahimeh Ramezani Tehrani, Marzieh Saei Ghare Naz, Razieh Bidhendi-Yarandi, Samira Behboudi-Gandevani
Diabetes & Metabolism Journal.2022; 46(4): 605. CrossRef - Triglyceride and glucose index and the risk of gestational diabetes mellitus: A nationwide population-based cohort study
Jung A Kim, Jinsil Kim, Eun Roh, So-hyeon Hong, You-Bin Lee, Sei Hyun Baik, Kyung Mook Choi, Eunjin Noh, Soon Young Hwang, Geum Joon Cho, Hye Jin Yoo
Diabetes Research and Clinical Practice.2021; 171: 108533. CrossRef - Effect of the IADPSG screening strategy for gestational diabetes on perinatal outcomes in Switzerland
Evelyne M. Aubry, Luigi Raio, Stephan Oelhafen
Diabetes Research and Clinical Practice.2021; 175: 108830. CrossRef - Estimated impact of introduction of new diagnostic criteria for gestational diabetes mellitus
Leon de Wit, Anna B Zijlmans, Doortje Rademaker, Christiana A Naaktgeboren, J Hans DeVries, Arie Franx, Rebecca C Painter, Bas B van Rijn
World Journal of Diabetes.2021; 12(6): 868. CrossRef - The Clinical Characteristics of Gestational Diabetes Mellitus in Korea: A National Health Information Database Study
Kyung-Soo Kim, Sangmo Hong, Kyungdo Han, Cheol-Young Park
Endocrinology and Metabolism.2021; 36(3): 628. CrossRef - Fetal Abdominal Obesity Detected At 24 to 28 Weeks of Gestation Persists Until Delivery Despite Management of Gestational Diabetes Mellitus
Wonjin Kim, Soo Kyung Park, Yoo Lee Kim
Diabetes & Metabolism Journal.2021; 45(4): 547. CrossRef - Nonalcoholic fatty liver disease and the risk of insulin-requiring gestational diabetes
Sang Youn You, Kyungdo Han, Seung-Hawn Lee, Mee Kyoung Kim
Diabetology & Metabolic Syndrome.2021;[Epub] CrossRef - Maternal Hyperglycemia during Pregnancy Increases Adiposity of Offspring
Hye Rim Chung, Joon Ho Moon, Jung Sub Lim, Young Ah Lee, Choong Ho Shin, Joon-Seok Hong, Soo Heon Kwak, Sung Hee Choi, Hak Chul Jang
Diabetes & Metabolism Journal.2021; 45(5): 730. CrossRef - Prepregnancy smoking and the risk of gestational diabetes requiring insulin therapy
Mee Kyoung Kim, Kyungdo Han, Sang Youn You, Hyuk-Sang Kwon, Kun-Ho Yoon, Seung-Hwan Lee
Scientific Reports.2020;[Epub] CrossRef - Gestational Diabetes Mellitus: Diagnosis and Glycemic Control
Tae Jung Oh, Hak Chul Jang
The Journal of Korean Diabetes.2020; 21(2): 69. CrossRef - New Diagnostic Criteria for Gestational Diabetes Mellitus and Pregnancy Outcomes in Korea
Kyu Yeon Hur
Diabetes & Metabolism Journal.2019; 43(6): 763. CrossRef
- Gestational diabetes mellitus and adverse maternal and perinatal outcomes in twin and singleton pregnancies: a systematic review and meta-analysis
- Clinical Diabetes & Therapeutics
- Progression to Gestational Diabetes Mellitus in Pregnant Women with One Abnormal Value in Repeated Oral Glucose Tolerance Tests
- Sunyoung Kang, Min Hyoung Kim, Moon Young Kim, Joon-Seok Hong, Soo Heon Kwak, Sung Hee Choi, Soo Lim, Kyong Soo Park, Hak C. Jang
- Diabetes Metab J. 2019;43(5):607-614. Published online February 28, 2019
- DOI: https://doi.org/10.4093/dmj.2018.0159
- 5,899 View
- 103 Download
- 9 Web of Science
- 9 Crossref
-
Abstract
PDFPubReader
Background Women with one abnormal value (OAV) in a 100 g oral glucose tolerance test (OGTT) during pregnancy are reported to have an increased risk of adverse pregnancy outcomes. However, there is limited data about whether women with OAV will progress to gestational diabetes mellitus (GDM) when the OGTT is repeated.
Methods To identify clinical and metabolic predictors for GDM in women with OAV, we conducted a retrospective study and identified women with OAV in the OGTT done at 24 to 30 weeks gestational age (GA) and repeated the second OGTT between 32 and 34 weeks of GA.
Results Among 137 women with OAV in the initial OGTT, 58 (42.3%) had normal, 40 (29.2%) had OAV and 39 (28.5%) had GDM in the second OGTT. Maternal age, prepregnancy body mass index, weight gain from prepregnancy to the second OGTT, GA at the time of the OGTT, and parity were similar among normal, OAV, and GDM groups. Plasma glucose levels in screening tests were different (151.8±15.7, 155.8±14.6, 162.5±20.3 mg/dL,
P <0.05), but fasting, 1-, 2-, and 3-hour glucose levels in the initial OGTT were not. Compared to women with screen negative, women with untreated OAV had a higher frequency of macrosomia.Conclusion We demonstrated that women with OAV in the initial OGTT significantly progressed to GDM in the second OGTT. Clinical parameters predicting progression to GDM were not found. Repeating the OGTT in women with OAV in the initial test may be helpful to detect GDM progression.
-
Citations
Citations to this article as recorded by- Maternal and fetal outcomes of pregnancies associated with single versus double abnormal values in 100 gr glucose tolerance test
Mohammadali Shahriari, Ali Shahriari, Maryam Khooshideh, Anahita Dehghaninezhad, Arezoo Maleki-Hajiagha, Rana Karimi
Journal of Diabetes & Metabolic Disorders.2023; 22(2): 1347. CrossRef - One abnormal value or vomiting after oral glucose tolerance test in pregnancy: incidence and impact on maternal-fetal outcomes
Humberto Navarro-Martinez, Juana-Antonia Flores-Le Roux, Gemma Llauradó, Lucia Gortazar, Antonio Payà, Laura Mañé, Juan Pedro-Botet, David Benaiges
Gynecological Endocrinology.2023;[Epub] CrossRef - Analysis of the gut microflora in women with gestational diabetes mellitus
Xuping Wang, Bingfeng Bian, Fuman Du, Chaofeng Xiang, Yu Liu, Na Li, Binhong Duan
International Journal of Diabetes in Developing Countries.2023;[Epub] CrossRef - The association between gestational impaired glucose tolerance and hyperglycemic markers: A prospective study
Ohad Gluck, Hadas Ganer Herman, Nataly Fainstein, Neri Katz, Jacob Bar, Michal Kovo
International Journal of Gynecology & Obstetrics.2022; 156(1): 82. CrossRef - Association of abnormal-glucose tolerance during pregnancy with exposure to PM2.5 components and sources
Dejian Mai, Chengfang Xu, Weiwei Lin, Dingli Yue, Shaojie Fu, Jianqing Lin, Luan Yuan, Yan Zhao, Yuhong Zhai, Huiying Mai, Xiaoling Zeng, Tingwu Jiang, Xuejiao Li, Jiajia Dai, Boning You, Qin Xiao, Qing Wei, Qiansheng Hu
Environmental Pollution.2022; 292: 118468. CrossRef - Postprandial Free Fatty Acids at Mid-Pregnancy Increase the Risk of Large-for-Gestational-Age Newborns in Women with Gestational Diabetes Mellitus
So-Yeon Kim, Young Shin Song, Soo-Kyung Kim, Yong-Wook Cho, Kyung-Soo Kim
Diabetes & Metabolism Journal.2022; 46(1): 140. CrossRef - The Clinical Characteristics of Gestational Diabetes Mellitus in Korea: A National Health Information Database Study
Kyung-Soo Kim, Sangmo Hong, Kyungdo Han, Cheol-Young Park
Endocrinology and Metabolism.2021; 36(3): 628. CrossRef - Gestational Diabetes Mellitus: Diagnosis and Glycemic Control
Tae Jung Oh, Hak Chul Jang
The Journal of Korean Diabetes.2020; 21(2): 69. CrossRef - Health literacy and diabetes control in pregnant women
Azar Pirdehghan, Mohammad Eslahchi, Farzaneh Esna-Ashari, Shiva Borzouei
Journal of Family Medicine and Primary Care.2020; 9(2): 1048. CrossRef
- Maternal and fetal outcomes of pregnancies associated with single versus double abnormal values in 100 gr glucose tolerance test
- Epidemiology
- Oral Glucose Tolerance Testing Allows Better Prediction of Diabetes in Women with a History of Gestational Diabetes Mellitus
- Tae Jung Oh, Yeong Gi Kim, Sunyoung Kang, Joon Ho Moon, Soo Heon Kwak, Sung Hee Choi, Soo Lim, Kyong Soo Park, Hak C. Jang, Joon-Seok Hong, Nam H. Cho
- Diabetes Metab J. 2019;43(3):342-349. Published online December 7, 2018
- DOI: https://doi.org/10.4093/dmj.2018.0086
- 4,696 View
- 59 Download
- 10 Web of Science
- 10 Crossref
-
Abstract
PDFPubReader
Background We aimed to identify the postpartum metabolic factors that were associated with the development of diabetes in women with a history of gestational diabetes mellitus (GDM). In addition, we examined the role of the oral glucose tolerance test (OGTT) in the prediction of future diabetes.
Methods We conducted a prospective study of 179 subjects who previously had GDM but did not have diabetes at 2 months postpartum. The initial postpartum examination including a 75-g OGTT and the frequently sampled intravenous glucose tolerance test (FSIVGTT) was performed 12 months after delivery, and annual follow-up visits were made thereafter.
Results The insulinogenic index (IGI30) obtained from the OGTT was significantly correlated with the acute insulin response to glucose (AIRg) obtained from the FSIVGTT. The disposition indices obtained from the OGTT and FSIVGTT were also significantly correlated. Women who progressed to diabetes had a lower insulin secretory capacity including IGI30, AIRg, and disposition indices obtained from the FSIVGTT and OGTT compared with those who did not. However, the insulin sensitivity indices obtained from the OGTT and FSIVGTT did not differ between the two groups. Multivariate logistic regression analysis showed that the 2-hour glucose and disposition index obtained from the FSIVGTT were significant postpartum metabolic risk factors for the development of diabetes.
Conclusion We identified a crucial role of β-cell dysfunction in the development of diabetes in Korean women with previous GDM. The 2-hour glucose result from the OGTT is an independent predictor of future diabetes. Therefore, the OGTT is crucial for better prediction of future diabetes in Korean women with previous GDM.
-
Citations
Citations to this article as recorded by- Diagnosis and management of gestational diabetes mellitus
Tae Jung Oh
Journal of the Korean Medical Association.2023; 66(7): 414. CrossRef - Risk factors for women with gestational diabetes mellitus developing type 2 diabetes and the impact on children's health
Yi‐Ling Chiou, Chich‐Hsiu Hung, Ching‐Yun Yu, Te‐Fu Chan, Ming‐Gwo Liu
Journal of Clinical Nursing.2022; 31(7-8): 1005. CrossRef - Postprandial Free Fatty Acids at Mid-Pregnancy Increase the Risk of Large-for-Gestational-Age Newborns in Women with Gestational Diabetes Mellitus
So-Yeon Kim, Young Shin Song, Soo-Kyung Kim, Yong-Wook Cho, Kyung-Soo Kim
Diabetes & Metabolism Journal.2022; 46(1): 140. CrossRef - Gestational Diabetes Mellitus: Diagnostic Approaches and Maternal-Offspring Complications
Joon Ho Moon, Hak Chul Jang
Diabetes & Metabolism Journal.2022; 46(1): 3. CrossRef - Higher Muscle Mass Protects Women with Gestational Diabetes Mellitus from Progression to Type 2 Diabetes Mellitus
Yujin Shin, Joon Ho Moon, Tae Jung Oh, Chang Ho Ahn, Jae Hoon Moon, Sung Hee Choi, Hak Chul Jang
Diabetes & Metabolism Journal.2022; 46(6): 890. CrossRef - Pancreatic fat accumulation is associated with decreased β‐cell function and deterioration in glucose tolerance in Korean adults
Sang Ouk Chin, You‐Cheol Hwang, In‐Jin Cho, In‐Kyung Jeong, Kyu Jeung Ahn, Ho Yeon Chung
Diabetes/Metabolism Research and Reviews.2021;[Epub] CrossRef - The Clinical Characteristics of Gestational Diabetes Mellitus in Korea: A National Health Information Database Study
Kyung-Soo Kim, Sangmo Hong, Kyungdo Han, Cheol-Young Park
Endocrinology and Metabolism.2021; 36(3): 628. CrossRef - Bihormonal dysregulation of insulin and glucagon contributes to glucose intolerance development at one year post-delivery in women with gestational diabetes: a prospective cohort study using an early postpartum 75-g glucose tolerance test
Riyoko Shigeno, Ichiro Horie, Masaki Miwa, Ayako Ito, Ai Haraguchi, Shoko Natsuda, Satoru Akazawa, Ai Nagata, Yuri Hasegawa, Shoko Miura, Kiyonori Miura, Atsushi Kawakami, Norio Abiru
Endocrine Journal.2021; 68(8): 919. CrossRef - Risk factors during the early postpartum period for type 2 diabetes mellitus in women with gestational diabetes
Maki Kawasaki, Naoko Arata, Naoko Sakamoto, Anna Osamura, Siori Sato, Yoshihiro Ogawa, Ichiro Yasuhi, Masako Waguri, Yuji Hiramatsu
Endocrine Journal.2020; 67(4): 427. CrossRef - Cod-Liver Oil Improves Metabolic Indices and hs-CRP Levels in Gestational Diabetes Mellitus Patients: A Double-Blind Randomized Controlled Trial
Shuli Yang, Ruixin Lin, Lihui Si, Zhuo Li, Wenwen Jian, Qing Yu, Yan Jia
Journal of Diabetes Research.2019; 2019: 1. CrossRef
- Diagnosis and management of gestational diabetes mellitus
 First
First Prev
Prev


