
- Current
- Browse
- Collections
-
For contributors
- For Authors
- Instructions to authors
- Article processing charge
- e-submission
- For Reviewers
- Instructions for reviewers
- How to become a reviewer
- Best reviewers
- For Readers
- Readership
- Subscription
- Permission guidelines
- About
- Editorial policy
Articles
- Page Path
- HOME > Diabetes Metab J > Volume 39(4); 2015 > Article
-
Original ArticleComplications Agreement between Framingham Risk Score and United Kingdom Prospective Diabetes Study Risk Engine in Identifying High Coronary Heart Disease Risk in North Indian Population
- Dipika Bansal1, Ramya S. R. Nayakallu1, Kapil Gudala1, Rajavikram Vyamasuni1, Anil Bhansali2
-
Diabetes & Metabolism Journal 2015;39(4):321-327.
DOI: https://doi.org/10.4093/dmj.2015.39.4.321
Published online: July 8, 2015
1Department of Pharmacy Practice, National Institute of Pharmaceutical Education and Research, Mohali, India.
2Department of Endocrinology, Postgraduate Institute of Medical Education and Research, Chandigarh, India.
- Corresponding author: Dipika Bansal. Department of Pharmacy Practice, National Institute of Pharmaceutical Research, Sector 67, SAS Nagar, Mohali, India. dipikabansal079@gmail.com
• Received: October 8, 2014 • Accepted: November 26, 2014
Copyright © 2015 Korean Diabetes Association
This is an Open Access article distributed under the terms of the Creative Commons Attribution Non-Commercial License (http://creativecommons.org/licenses/by-nc/3.0/) which permits unrestricted non-commercial use, distribution, and reproduction in any medium, provided the original work is properly cited.
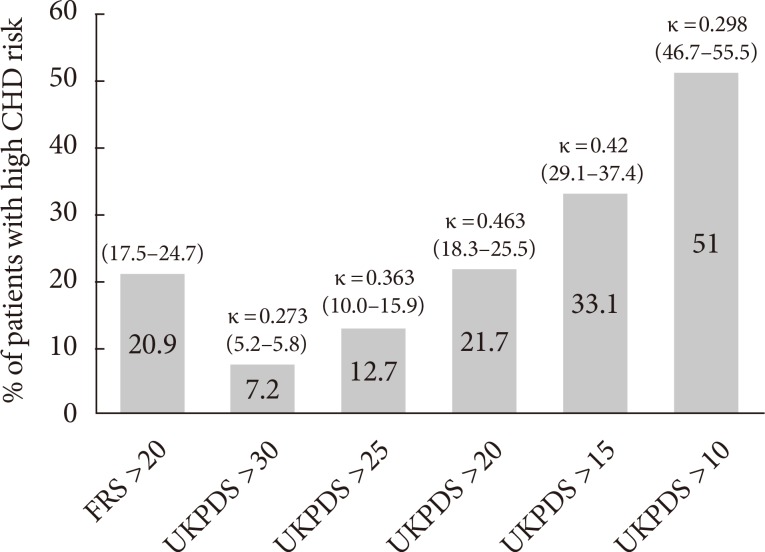
Figure & Data
References
Citations
Citations to this article as recorded by 
- Endocan is Related to Increased Cardiovascular Risk in Type 2 Diabetes Mellitus Patients
Aleksandra Klisic, Jelena Kotur-Stevuljevic, Ana Ninic
Metabolic Syndrome and Related Disorders.2023; 21(7): 362. CrossRef - Estimated risk of cardiovascular events and long-term complications: The projected future of diabetes patients in Delhi from the DEDICOM-II survey
Swapnil Rawat, Ramasheesh Yadav, Siddhi Goyal, Jitender Nagpal
Diabetes & Metabolic Syndrome: Clinical Research & Reviews.2023; 17(11): 102880. CrossRef - Cardiovascular Biomarkers and Calculated Cardiovascular Risk in
Orally Treated Type 2 Diabetes Patients: Is There a Link?
Aleksandra Markova, Mihail Boyanov, Deniz Bakalov, Atanas Kundurdjiev, Adelina Tsakova
Hormone and Metabolic Research.2021; 53(01): 41. CrossRef - Risk of coronary heart disease and stroke based on United Kingdom prospective diabetes study in type 2 DM patients in Medan
R Amelia, J Harahap, H Wijaya, I I Fujiati
IOP Conference Series: Earth and Environmental Science.2021; 912(1): 012081. CrossRef - Cardiovascular/stroke risk prevention: A new machine learning framework integrating carotid ultrasound image-based phenotypes and its harmonics with conventional risk factors
Ankush Jamthikar, Deep Gupta, Narendra N. Khanna, Luca Saba, John R. Laird, Jasjit S. Suri
Indian Heart Journal.2020; 72(4): 258. CrossRef - Current Data Regarding the Relationship between Type 2 Diabetes Mellitus and Cardiovascular Risk Factors
Cosmin Mihai Vesa, Loredana Popa, Amorin Remus Popa, Marius Rus, Andreea Atena Zaha, Simona Bungau, Delia Mirela Tit, Raluca Anca Corb Aron, Dana Carmen Zaha
Diagnostics.2020; 10(5): 314. CrossRef - Artificial intelligence framework for predictive cardiovascular and stroke risk assessment models: A narrative review of integrated approaches using carotid ultrasound
Ankush D. Jamthikar, Deep Gupta, Luca Saba, Narendra N. Khanna, Klaudija Viskovic, Sophie Mavrogeni, John R. Laird, Naveed Sattar, Amer M. Johri, Gyan Pareek, Martin Miner, Petros P. Sfikakis, Athanasios Protogerou, Vijay Viswanathan, Aditya Sharma, Georg
Computers in Biology and Medicine.2020; 126: 104043. CrossRef - Additive and Synergistic Cardiovascular Disease Risk Factors and HIV Disease Markers' Effects on White Matter Microstructure in Virally Suppressed HIV
Maëliss Calon, Kritika Menon, Andrew Carr, Roland G. Henry, Caroline D. Rae, Bruce J. Brew, Lucette A. Cysique
JAIDS Journal of Acquired Immune Deficiency Syndromes.2020; 84(5): 543. CrossRef - Performance evaluation of 10-year ultrasound image-based stroke/cardiovascular (CV) risk calculator by comparing against ten conventional CV risk calculators: A diabetic study
Narendra N. Khanna, Ankush D. Jamthikar, Deep Gupta, Andrew Nicolaides, Tadashi Araki, Luca Saba, Elisa Cuadrado-Godia, Aditya Sharma, Tomaz Omerzu, Harman S. Suri, Ajay Gupta, Sophie Mavrogeni, Monika Turk, John R. Laird, Athanasios Protogerou, Petros P.
Computers in Biology and Medicine.2019; 105: 125. CrossRef - Cardiovascular risk estimated by UKPDS risk engine algorithm in diabetes
Nebojsa Kavaric, Aleksandra Klisic, Ana Ninic
Open Medicine.2018; 13(1): 610. CrossRef - Differential Association of Metabolic Risk Factors with Open Angle Glaucoma according to Obesity in a Korean Population
Hyun-Ah Kim, Kyungdo Han, Yun-Ah Lee, Jin A Choi, Yong-Moon Park
Scientific Reports.2016;[Epub] CrossRef - The Association between Diabetic Retinopathy and Framingham Risk Score in Koreans with Type II Diabetes
Da Yeong Kim, Su Jeong Song, Jeong Hun Bae, Cheol-Young Park, Eun-Jung Rhee
Journal of the Korean Ophthalmological Society.2016; 57(5): 779. CrossRef
 PubReader
 Cite
Cite


