- Current
- Browse
- Collections
-
For contributors
- For Authors
- Instructions to authors
- Article processing charge
- e-submission
- For Reviewers
- Instructions for reviewers
- How to become a reviewer
- Best reviewers
- For Readers
- Readership
- Subscription
- Permission guidelines
- About
- Editorial policy
Articles
- Page Path
- HOME > Diabetes Metab J > Volume 43(5); 2019 > Article
-
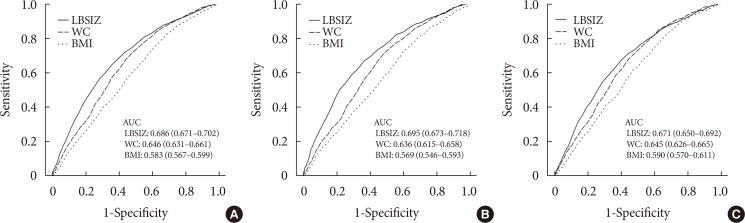
Original ArticleObesity and Metabolic Syndrome The Association between Z-Score of Log-Transformed A Body Shape Index and Cardiovascular Disease in Korea
-
Wankyo Chung1,2
 , Jung Hwan Park3, Hye Soo Chung4, Jae Myung Yu4, Shinje Moon4,5, Dong Sun Kim3
 -
Diabetes & Metabolism Journal 2019;43(5):675-682.
DOI: https://doi.org/10.4093/dmj.2018.0169
Published online: April 26, 2019
1Department of Public Health Science, Graduate School of Public Health, Seoul National University, Seoul, Korea.
2Institute of Health and Environment, Seoul National University, Seoul, Korea.
3Department of Internal Medicine, Hanyang University College of Medicine, Seoul, Korea.
4Department of Internal Medicine, Hallym University Kangnam Sacred Heart Hospital, Hallym University College of Medicine, Seoul, Korea.
5Department of Internal Medicine, Graduate School, Hanyang University, Seoul, Korea.
- Corresponding author: Shinje Moon. Department of Internal Medicine, Hallym University Kangnam Sacred Heart Hospital, Hallym University College of Medicine, 1 Singil-ro, Yeongdeungpo-gu, Seoul 07441, Korea. sinjei1129@gmail.com
- Corresponding author: Dong Sun Kim. Department of Internal Medicine, Hanyang University College of Medicine, 222-1 Wangsimni-ro, Seongdong-gu, Seoul 04763, Korea. dongsun@hanyang.ac.kr
Copyright © 2019 Korean Diabetes Association
This is an Open Access article distributed under the terms of the Creative Commons Attribution Non-Commercial License (http://creativecommons.org/licenses/by-nc/4.0/) which permits unrestricted non-commercial use, distribution, and reproduction in any medium, provided the original work is properly cited.

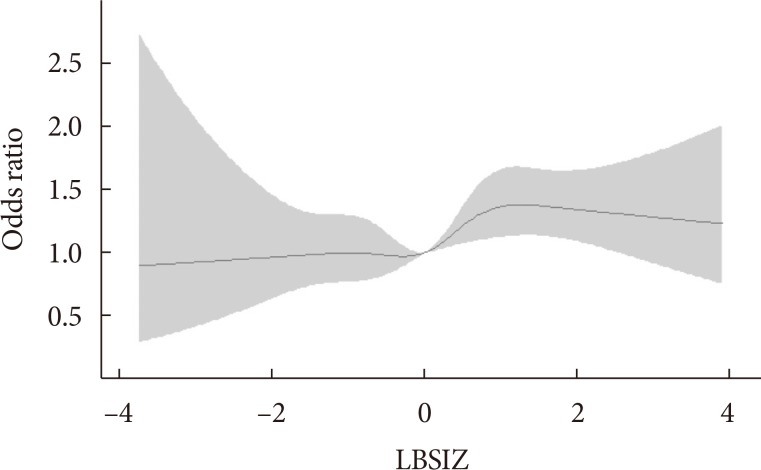
Figure & Data
References
Citations
- Body Shape Index and Cardiovascular Risk in Individuals With Obesity
Nazlı Hacıağaoğlu, Can Öner, Hüseyin Çetin, Engin Ersin Şimşek
Cureus.2022;[Epub] CrossRef - Association between body shape index and risk of mortality in the United States
Heysoo Lee, Hye Soo Chung, Yoon Jung Kim, Min Kyu Choi, Yong Kyun Roh, Wankyo Chung, Jae Myung Yu, Chang-Myung Oh, Shinje Moon
Scientific Reports.2022;[Epub] CrossRef - Utility of the Z-score of log-transformed A Body Shape Index (LBSIZ) in the assessment for sarcopenic obesity and cardiovascular disease risk in the United States
Wankyo Chung, Jung Hwan Park, Hye Soo Chung, Jae Myung Yu, Dong Sun Kim, Shinje Moon
Scientific Reports.2019;[Epub] CrossRef
 PubReader
 Cite
Cite