- Current
- Browse
- Collections
-
For contributors
- For Authors
- Instructions to authors
- Article processing charge
- e-submission
- For Reviewers
- Instructions for reviewers
- How to become a reviewer
- Best reviewers
- For Readers
- Readership
- Subscription
- Permission guidelines
- About
- Editorial policy
Articles
- Page Path
- HOME > Diabetes Metab J > Volume 40(4); 2016 > Article
-
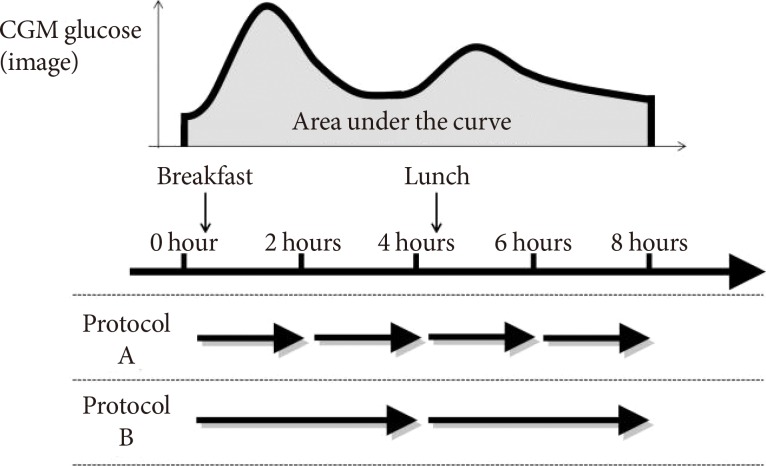
Original ArticleOthers Evaluation of a Novel Glucose Area Under the Curve (AUC) Monitoring System: Comparison with the AUC by Continuous Glucose Monitoring
-
Satoshi Ugi1
 , Hiroshi Maegawa1, Katsutaro Morino1, Yoshihiko Nishio2, Toshiyuki Sato3, Seiki Okada3, Yasuo Kikkawa3, Toshihiro Watanabe3, Hiromu Nakajima4, Atsunori Kashiwagi5
 -
Diabetes & Metabolism Journal 2016;40(4):326-333.
DOI: https://doi.org/10.4093/dmj.2016.40.4.326
Published online: July 26, 2016
1Department of Medicine, Shiga University of Medical Science, Otsu, Japan.
2Department of Diabetes and Endocrine Medicine, Kagoshima University Graduate School of Medical and Dental Science, Kagoshima, Japan.
3Central Research Laboratories, Sysmex Corporation, Kobe, Japan.
4Department of Clinical Laboratory, Osaka Medical Center for Cancer and Cardiovascular Diseases, Osaka, Japan.
5Department of Medicine, Kusatsu General Hospital, Kusatsu, Japan.
- Corresponding author: Satoshi Ugi. Department of Medicine, Shiga University of Medical Science, Setatsukinowacho, Otsu, Shiga 520-2192, Japan. sugi@belle.shiga-med.ac.jp
Copyright © 2016 Korean Diabetes Association
This is an Open Access article distributed under the terms of the Creative Commons Attribution Non-Commercial License (http://creativecommons.org/licenses/by-nc/4.0/) which permits unrestricted non-commercial use, distribution, and reproduction in any medium, provided the original work is properly cited.


Figure & Data
References
Citations
- Continuous glucose monitoring metrics and pregnancy outcomes in insulin‐treated diabetes: A post‐hoc analysis of the GlucoMOMS trial
Doortje Rademaker, Anne W. T. van der Wel, Rik van Eekelen, Daphne N. Voormolen, Harold W. de Valk, Inge M. Evers, Ben Willem Mol, Arie Franx, Sarah E. Siegelaar, Bas B. van Rijn, J. Hans DeVries, Rebecca C. Painter
Diabetes, Obesity and Metabolism.2023; 25(12): 3798. CrossRef - Regimen comprising GLP-1 receptor agonist and basal insulin can decrease the effect of food on glycemic variability compared to a pre-mixed insulin regimen
Yi-Hsuan Lin, Chia-Hung Lin, Yu-Yao Huang, Hsin-Yun Chen, An-Shun Tai, Shih-Chen Fu, Sheng-Hwu Hsieh, Jui-Hung Sun, Szu-Tah Chen, Sheng-Hsuan Lin
European Journal of Medical Research.2022;[Epub] CrossRef - Advantages of Applying Artificial Intelligent System to Medical Neurology (Preprint)
Zhenqiang Fu, Jingtao Wang, Jingtao Wang
JMIR Medical Informatics.2020;[Epub] CrossRef - Comparison of Glucose Area Under the Curve Measured Using Minimally Invasive Interstitial Fluid Extraction Technology with Continuous Glucose Monitoring System in Diabetic Patients
Mei Uemura, Yutaka Yano, Toshinari Suzuki, Taro Yasuma, Toshiyuki Sato, Aya Morimoto, Samiko Hosoya, Chihiro Suminaka, Hiromu Nakajima, Esteban C. Gabazza, Yoshiyuki Takei
Diabetes & Metabolism Journal.2017; 41(4): 265. CrossRef
 PubReader
 Cite
Cite