
- Current
- Browse
- Collections
-
For contributors
- For Authors
- Instructions to authors
- Article processing charge
- e-submission
- For Reviewers
- Instructions for reviewers
- How to become a reviewer
- Best reviewers
- For Readers
- Readership
- Subscription
- Permission guidelines
- About
- Editorial policy
Articles
- Page Path
- HOME > Diabetes Metab J > Ahead-of print > Article
-
Original ArticleComplications Glycemic Control and Retinal Microvascular Changes in Type 2 Diabetes Mellitus Patients without Clinical Retinopathy
-
Kangmin Lee1
 , Ga Hye Lee1, Seung Eun Lee2, Jee Myung Yang1, Kunho Bae3
 -
DOI: https://doi.org/10.4093/dmj.2023.0149
Published online: March 13, 2024
- 673 Views
- 36 Download
1Department of Ophthalmology, Dongguk University Ilsan Hospital, Goyang, Korea
2Division of Endocrinology and Metabolism, Department of Internal Medicine, Dongguk University Ilsan Hospital, Goyang, Korea
3Department of Ophthalmology, Seoul National University Hospital, Seoul, Korea
-
Corresponding author: Kunho Bae Department of Ophthalmology, Seoul National University Hospital, 101 Daehak-ro, Jongno-gu, Seoul 03080, Korea E-mail: luben81@gmail.com
Copyright © 2024 Korean Diabetes Association
This is an Open Access article distributed under the terms of the Creative Commons Attribution Non-Commercial License (http://creativecommons.org/licenses/by-nc/4.0/) which permits unrestricted non-commercial use, distribution, and reproduction in any medium, provided the original work is properly cited.
ABSTRACT
-
Background
- To investigate the association of glycemic control and retinal microvascular changes in patients with type 2 diabetes mellitus (T2DM) without diabetic retinopathy (DR).
-
Methods
- This retrospective, observational, cohort study included patients with T2DM without DR. The patients were categorized into intensive control (IC; mean glycosylated hemoglobin [HbA1c] ≤7.0%) and moderate control (MC; mean HbA1c >7.0%) groups. Optical coherence tomography (OCT) and swept-source OCT angiography (OCTA) image parameters were compared between three groups, including healthy controls.
-
Results
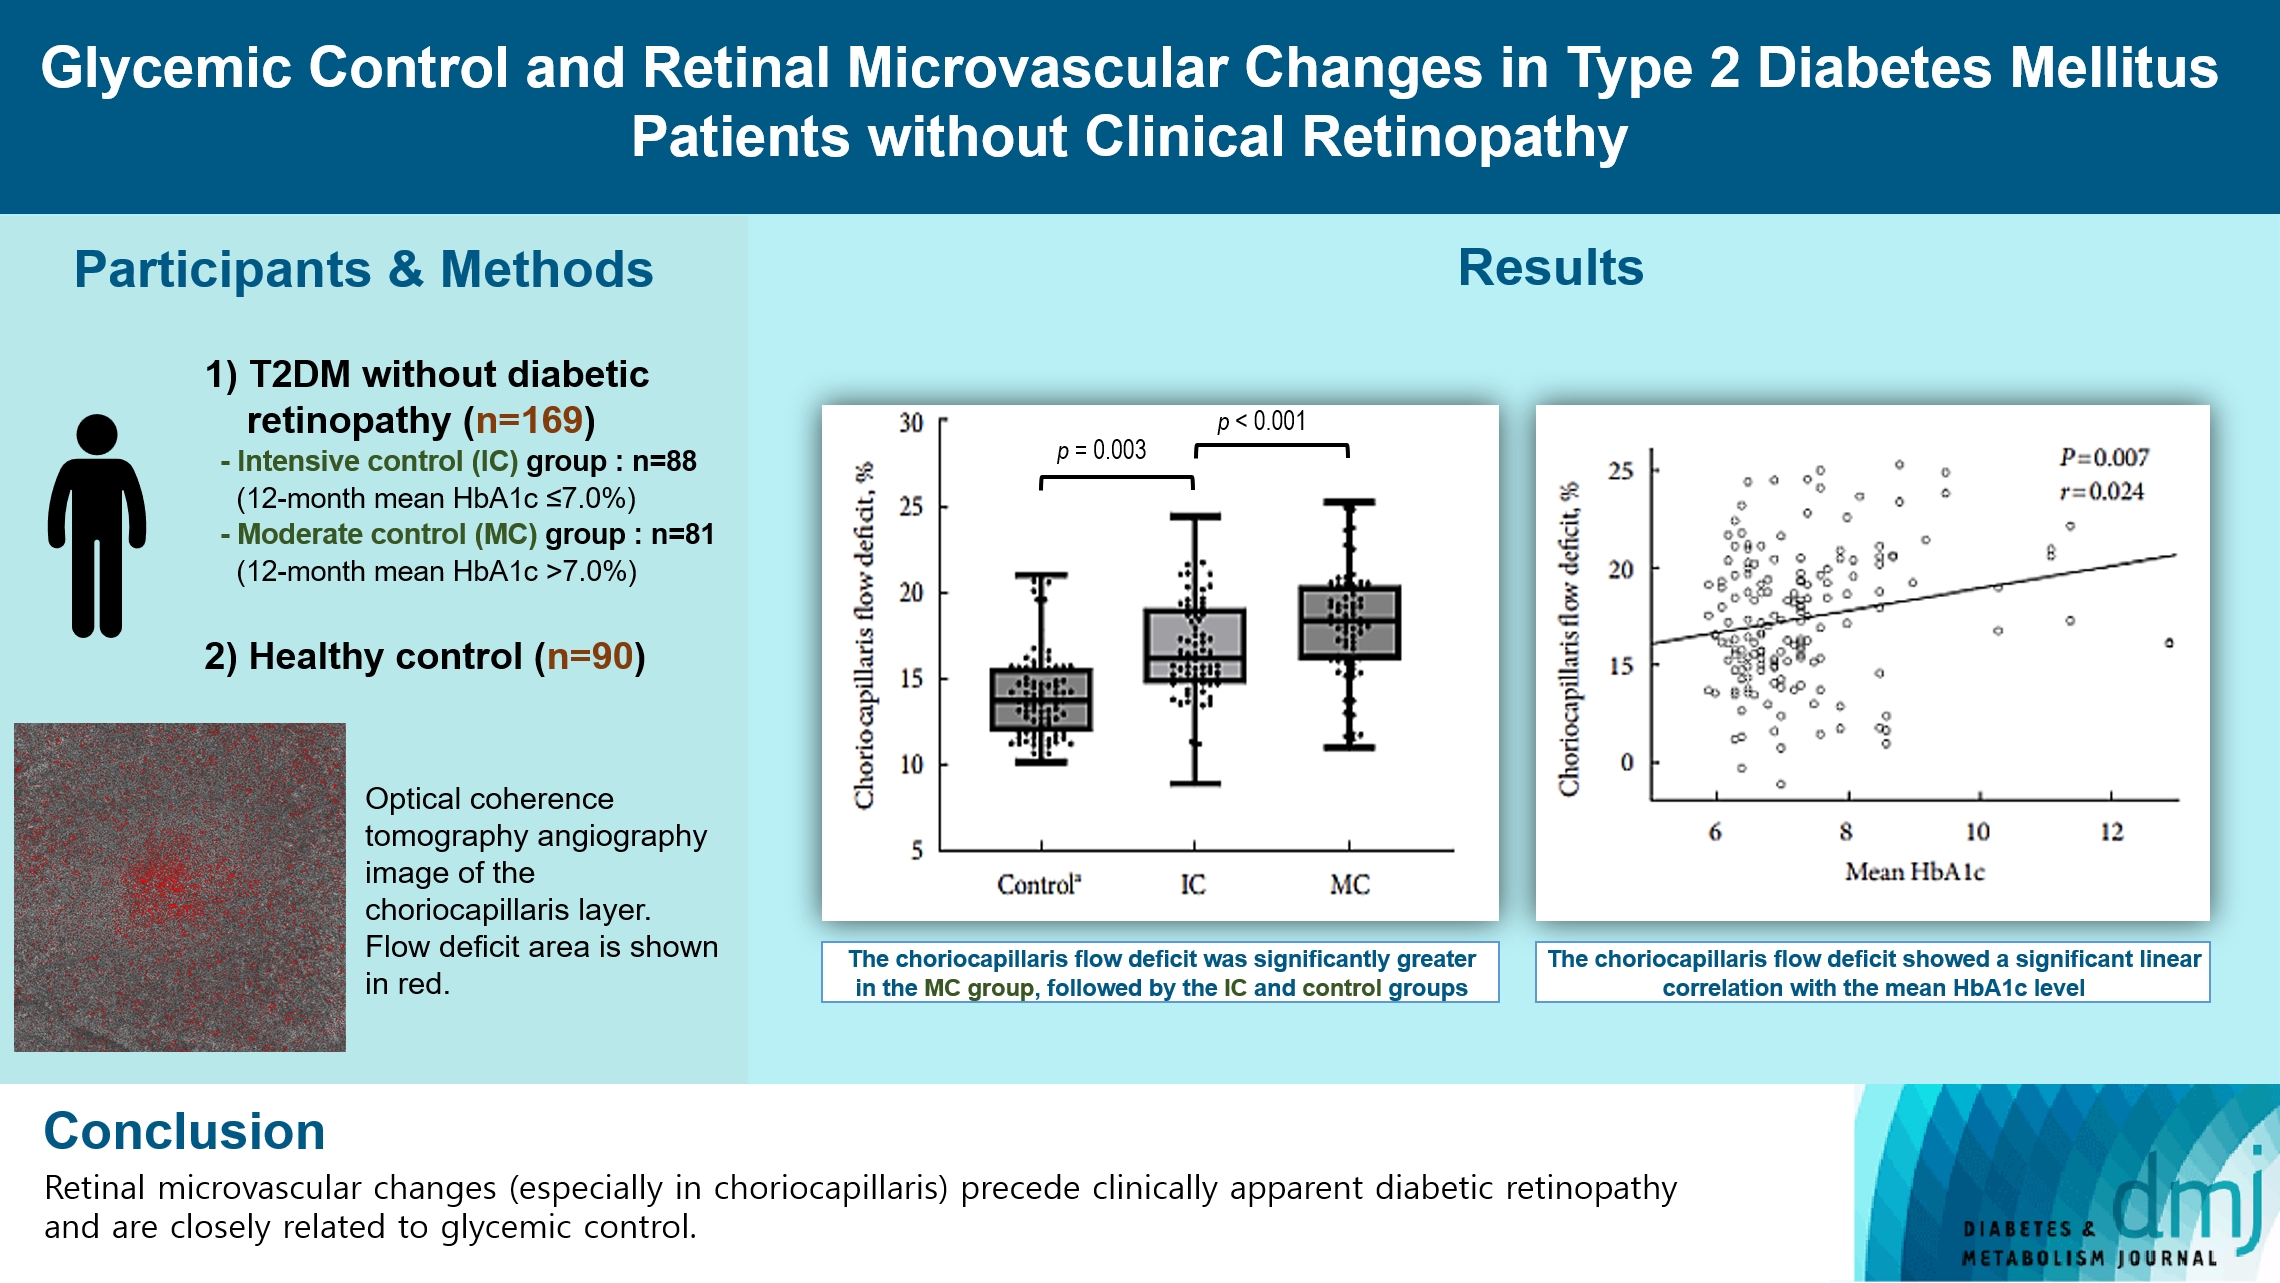
- In total, 259 eyes of 259 participants (88 IC, 81 MC, and 90 controls) were included. The foveal avascular zone area was significantly larger in the MC group than IC and control groups (all P<0.05). The IC group had lower vessel density in the superficial retinal layer and deep retinal layer than the controls (all P<0.05). The choriocapillaris (CC) flow deficit (FD) was significantly greater in the MC group than in the IC and control groups (18.2%, 16.7%, and 14.2%, respectively; all P<0.01). In multivariate regression analysis, CC-FD was associated with the mean HbA1c level (P=0.008). There were no significant differences in OCT parameters among the groups.
-
Conclusion
- OCTA revealed that early CC impairment is associated with HbA1c levels; the CC changes precede clinically apparent DR. The OCTA parameters differed among the groups according to the degree of glycemic control. Our results suggest that microvascular changes precede DR and are closely related to glycemic control.
- • Retinal microvascular changes preceded clinically apparent diabetic retinopathy.
- • Retinal microvascular changes in the choriocapillaris preceded neurodegeneration.
- • Choriocapillaris may be the earliest and most vulnerable region in T2DM patients.
- • Retinal microvascular changes were closely related to glycemic control.
Highlights
- Diabetes mellitus (DM) can cause metabolic impairment due to insulin resistance and hyperglycemia, which can lead to cardiovascular and microvascular complications such as diabetic retinopathy (DR) [1,2]. The initial signs of DR are microaneurysms and dot-and-blot intraretinal hemorrhages on fundus examination [3]. However, increasing evidence suggests that certain neural and vascular retinal alterations are present before the onset of clinically detectable DR [4-6].
- The transparency of ocular structures has enabled examination of the living retina and provided valuable insights into the microvascular changes that arise from long-term exposure to hyperglycemia [7]. Numerous clinical studies have used spectral domain optical coherence tomography (OCT) to investigate retinal microstructural changes in diabetic patients [8,9]. Recently, swept-source OCT angiography (SS-OCTA) has been developed, which has a longer laser wavelength and is less affected by the retinal pigment epithelium, enabling more reliable visualization of microvascular changes in structures beneath the retinal pigment epithelium, such as the choriocapillaris [10-12].
- Risk factors for the development and progression of DR include poor glycemic control, longer duration of DM, and poorly controlled hypertension [13]. Recent mega-trials have demonstrated that, compared to standard care, intensive glycemic control can reduce the risks of DR development and progression over several years in type 1 diabetes mellitus (T1DM) and type 2 diabetes mellitus (T2DM) [14,15]. However, it is unclear whether glycemic control affects the neural and microvascular environment in DM patients without DR. Furthermore, the evaluation of microvascular changes of preclinical retinopathy according to glycemic control in DM patients can improve our understanding of the pathogenesis of DR, predict the development of DR at an early stage, and enable early interventions to prevent retinopathy progression.
- Therefore, we evaluated early neural and microvascular changes according to the degree of glycemic control in T2DM patients without clinical retinopathy.
INTRODUCTION
- Participants
- This retrospective, observational, cohort study included T2DM patients who were enrolled in the Dongguk Diabetes Cohort Study and underwent regular checkups for DR between January 2019 and August 2022 at Dongguk University Ilsan Hospital. The study was performed in accordance with the Declaration of Helsinki. The study protocol was approved by the Institutional Review Board and Ethics Committee of Dongguk University Ilsan Hospital (IRB no. 2021-06-029). The study participants provided written informed consent before enrollment.
- The study included 30- to 70-year-old patients with T2DM without known DR at baseline who underwent regular screening for DR at the department of ophthalmology. The control group consisted of subjects who visited the clinic for a general health checkup and were found to have no underlying diabetes. One eye each of DM patients and controls was included in the study. The eye without significant ocular disease was selected from both eyes; if both eyes were eligible, the right eye was selected. The participants underwent comprehensive ophthalmic examination, including best-corrected visual acuity assessment using the Snellen chart, slit-lamp biomicroscopy, dilated fundus examination, ultra-widefield fundus photography, spectrum-domain OCT, and SS-OCTA. Patients with T2DM were included in the study after a retinal specialist (K.B.) confirmed absence of signs of DR on clinical examination and ultra-wide fundus photography. We excluded eyes with a history of retinal or choroidal diseases (i.e., age-related macular degeneration, retinal vein occlusion, uveitis, retinal detachment, and central serous chorioretinopathy), glaucoma, or optic neuropathy, and patients with neurodegenerative diseases, such as Parkinson’s disease and dementia.
- OCT and OCTA
- Spectral domain OCT was performed using Cirrus 5000 HDOCT (Carl Zeiss Meditec, Dublin, CA, USA). The OCT included a macular cube scan, optic disc cube scan, and horizontal and vertical high-definition five-line raster scans across the foveal center. The OCT images were acquired by a single experienced optometrist. Mean peripapillary retinal nerve fiber layer (pRNFL) thickness was evaluated globally and separately for the superior, temporal, nasal, and inferior peripapillary sectors. The central foveal retinal thickness and macular ganglion cell-inner plexiform layer (GC-IPL) thickness were calculated automatically using the bundled software (Supplementary Fig. 1).
- The OCTA images were obtained after pupillary dilation in a dark room using an SS-OCTA instrument (PLEX Elite 9000, Carl Zeiss Meditec). The images had a field of view of 6×6 mm, which was positioned on the foveal center. The OCTA images were excluded if they contained significant motion or shadowing artifacts, or had a signal length <8. The bundled software was used to perform automated segmentation of intraretinal layers into the superficial retinal layer (SRL), which extended from the internal limiting membrane to the inner plexiform layer, deep retinal layer (DRL), which extended from the inner plexiform layer to the outer plexiform layer, and choriocapillaris, which extended 30 to 60 μm below the retinal pigment epithelium.
- The foveal avascular zone (FAZ) area (mm2) and retinal vessel density (VD, %) in the SRL and DRL were measured manually using the open-source FIJI software (expanded version of ImageJ software version 1.51a; available at fiji.sc) (Supplementary Fig. 2). FAZ was defined as the avascular area in the foveal center. The FAZ border was delineated manually by two examiners (G.H.L. and K.L.). The VD (%) was calculated using the following formula: VD (%)=vascular area (pixel)/(total area-FAZ area) (pixel)×100. The images were binarized using a near-comprehensive binarization algorithm applied in past OCTA studies: global default [16,17]. The choriocapillaris flow deficit (FD) was measured using the Phansalkar automatic threshold method with a pixel radius window of 2.0, which was designed to select the darker regions in potentially low-contrast images [18,19]. The percentage of FD (FD%) was obtained by the ratio between the total FD area and total area of the 6×6-mm region, excluding regions with artifacts.
- A1C assessment and subgroup classification
- Glycosylated hemoglobin (HbA1c) was measured by high-performance liquid chromatography, similar to the Diabetic Control and Complication Trial [20]. Healthy controls had HbA1c <5.7% and fasting blood glucose level <100 mg/dL or random blood glucose level <200 mg/dL. Patients were diagnosed with T2DM at the Department of Endocrinology and were on regular follow-up. The T2DM patients had never been diagnosed with T1DM and had HbA1c ≥6.5%. The mean HbA1c level was calculated during the 12 months prior to the OCT and OCTA. Based on the mean HbA1c level, T2DM patients were divided into intensive control (mean HbA1c ≤7.0%) and moderate control (mean HbA1c >7.0%) groups [21]. In addition, to identify the effect of fluctuation in glycemic control, T2DM participants were divided into high- and low-fluctuation groups based on the intraindividual standard deviation (SD) from the mean HbA1c [22].
- Statistical analysis
- The necessary sample size was calculated using the G Power program 3.1.0 (G power program version 3.1, Heinrich-Heine University, Dusseldorf, Germany), based on an α-error of 0.05 and a statistical power of 0.80. Allowing for a drop-out rate of 10%, total 192 patients (64 per group) were calculated to be recruited for our study to ensure adequate statistical power. Continuous variables were compared using the two samples t-test and analysis of variance, whereas categorical variables were compared using the chi-square test or Fisher’s exact test. We performed analysis of covariance with Bonferroni correction for multiple comparisons after controlling for age, systemic hypertension, and duration of DM to compare parameters among the three groups. Propensity scores were estimated using a logistic regression model that matched nearest neighbors 1:1 without replacement, adjusting for age, sex, systemic hypertension, and duration of diabetes. The best-corrected visual acuity was converted to logarithm of the minimum angle of resolution units for statistical analysis. To examine the linear associations between HbA1c and OCTA parameters, a linear regression model was used accounting for age, systemic hypertension, and DM duration. P values <0.05 were considered statistically significant. Continuous data are presented as mean±SD. Statistical analyses were performed using SPSS for Windows software version 25.0 (IBM Corp., Armonk, NY, USA).
METHODS
- This study included 169 eyes of 169 T2DM subjects (88 and 81 eyes in the intensive control and moderate control groups, respectively) and 90 eyes of 90 healthy controls. The mean HbA1c levels were 6.5%±0.3% and 8.2%±1.3% in the intensive control and moderate control groups, respectively. In T2DM patients, the mean±SD from the intraindividual mean HbA1c was 0.4±0.5. The fasting blood glucose level, mean and initial HbA1c levels, and insulin use were significantly different between the two groups (all P<0.001), whereas age, DM duration, and systolic and diastolic blood pressure were not significantly different between the groups (all P>0.05). Table 1 presents the participant characteristics.
- The mean thickness of the central fovea, pRNFL, and GC-IPL in the moderate control, intensive control, and control groups are shown in Table 2. There were no significant differences in the mean thickness of the central fovea, pRNFL sectors, or GC-IPL among the groups (all P>0.05).
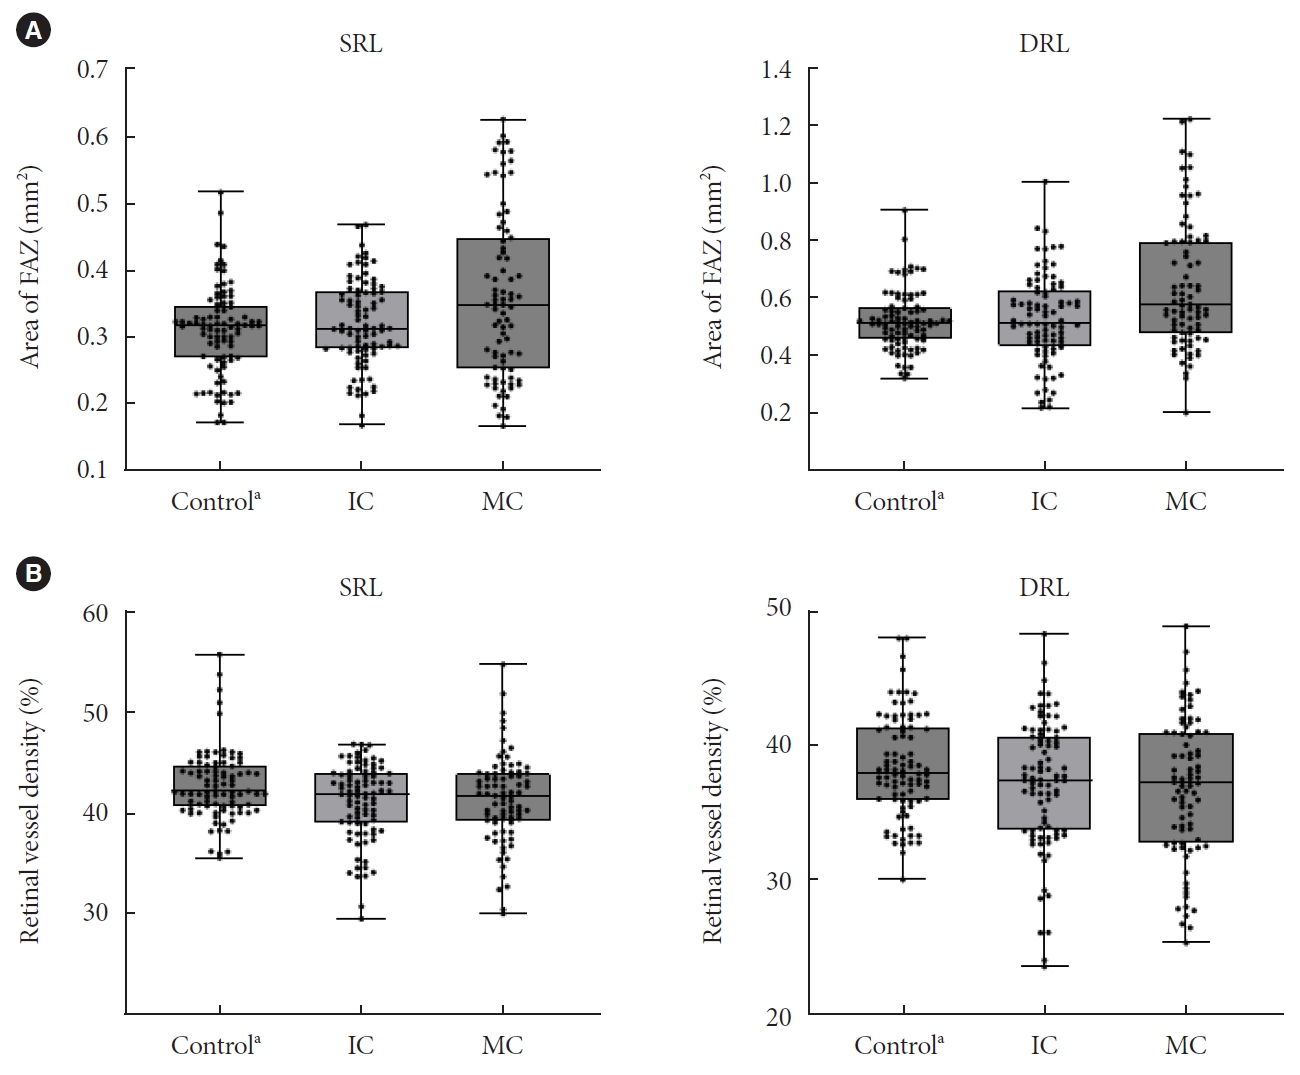
- The OCTA parameters, including VD, FAZ area, and choriocapillaris FD, are presented in Table 3. The intensive control group had lower VD in both SRL and DRL than healthy controls (all P<0.05), although there were no significant differences between the moderate control and intensive control groups (all P>0.05). However, the FAZ area in the SRL and DRL of the moderate control group was larger than that in the intensive control and control groups (all P<0.05), although there were no significant differences between the intensive control and control groups (P>0.05). The choriocapillaris FD was significantly greater in the moderate control group, followed by the intensive control and control groups (18.2%, 16.7%, and 14.2%, respectively; all P<0.01) (Fig. 1). Significant differences in OCTA parameters between the intensive and intervention groups persisted after propensity score matching (Supplementary Table 1).
- We analyzed linear associations between the HbA1c level and OCTA parameters among diabetic patients (intensive control and moderate control groups). The FAZ area in the SRL, DRL, and choriocapillaris FD showed a significant linear correlation with the mean HbA1c level (P=0.016, P=0.024, and P=0.007, respectively) (Supplementary Fig. 3); however, the VD of SRL and DRL did not show any significant linear correlations (P=0.288 and P=0.480, respectively). In addition, the initial HbA1c level showed a significant linear correlation with the FAZ area in the SRL (P=0.010). In multivariate regression analysis, choriocapillaris FD was the only parameter independently associated with the mean HbA1c level (P=0.008).
- In the intensive control and moderate control groups, 41 and 128 patients were classified into the high- and low-fluctuation groups, respectively (Table 4). The high-fluctuation group showed greater FAZ in both the SRL and DRL than the low-fluctuation group (P<0.001 and P=0.001, respectively). The OCT parameters, VD, and choriocapillaris FD were not significantly different between the groups.
RESULTS
- This study demonstrated quantifiable early retinal microvascular alterations on SS-OCTA. These changes correlated significantly with the HbA1c level in T2DM patients without apparent DR. The strongest association was observed between the HbA1c level and choriocapillaris FD, which was significantly greater in the moderate control group than the intensive control and control groups. However, no significant differences were observed in separate retinal layer thickness between T2DM patients without clinical DR and controls, suggesting that retinal microvascular alterations in the choriocapillaris precede retinal neurodegenerative changes.
- Our results are in line with those of previous studies that showed early microvascular alterations on OCTA in DM patients. Previous studies found certain microvascular alterations prior to the onset of clinical signs of DR in DM patients [4,23]. A recent meta-analysis of data from 2,241 eyes of DM patients showed that DM patients without clinical DR had an enlarged FAZ area and decreased perfusion density in the parafoveal capillary plexus compared to healthy controls [24]. Moreover, previous studies have shown that the deep retinal vessels are preferentially affected in DM patients without DR, whereas the superficial vascular layer is damaged later after the onset of DR. Therefore, the outer retina is more vulnerable to ischemic changes caused by DM.
- As a component of the central nervous system, the retina is characterized by a high metabolism, similar to that of the brain, and receives a dual blood supply from the choroid and ophthalmic arteries to fulfill the high demand [25]. The choriocapillaris includes capillary endpoints of the choroid and provides nutrients and oxygen to the outer retina, including photoreceptors, which has higher metabolic activity than the inner retina. The reduced blood flow in the choriocapillaris may occur due to oxidative stress associated with aging and result in ischemia of the outer retina [26]. In addition, Dimitrova et al. [27] demonstrated a significant decrease in choroidal circulation through the posterior ciliary artery in patients with background DR. Wang et al. [28] also found a correlation between choriocapillaris flow impairment and DR severity. In addition, previous animal models and human histopathological studies have shown that choroidal vessel alterations occur during the early stages of DR. In a mouse model of diabetes, reduced choroidal perfusion occurred prior to alterations of retinal perfusion and visual function [29]. McLeod and Lutty [30] showed that choriocapillaris drop-out was significantly more pronounced, and involved a larger area, in postmortem subjects with DM but without DR than in those without DM. These results suggest that the pathophysiological mechanisms involved in early diabetes also affect the choroid. In the present study, flow defects in the choriocapillaris were observed in T2DM patients without alterations in other retinal macrovascular or microvascular features. Considering that changes occur preferentially in the outer retina and choroidal vessels, changes in the choriocapillaris may be the earliest microvascular alterations in DM patients.
- In addition to the alterations in the choriocapillaris, other OCTA parameters showed statistically significant differences among our groups according to the degree of glycemic control (Fig. 2). The moderate control, intensive control, and control groups had the largest FAZ area and smallest VD, in descending order; however, whereas the VD was significantly different between the healthy controls and intensive control group, the FAZ area was significantly different between the moderate control group and both the intensive control and control groups. In other words, perifoveal retinal capillaries were affected even in patients with good glycemic control, whereas the FAZ area was affected when blood glucose level was poorly controlled. Previous studies have reported conflicting results regarding the FAZ area in DM patients without DR. These discrepancies can be attributed to differences in patient characteristics and glycemic control. FAZ does not receive blood supply from the retinal arteries and is supplied mainly from the choroid. To compensate for circulatory vulnerability, dual choroidal blood supply is supplied to the macula by long and short posterior ciliary arteries that penetrate the sclera in the area corresponding to the macula. Given the abundant choroidal supply of the central macula, microcirculation in the FAZ area may be better preserved than that in parafoveal tissue despite damage to the choriocapillaris at an early stage. With regard to this, the enlarged FAZ area in our group with high glycemic variability suggests that glycemic variability is as detrimental to the retinal microcirculation as prolonged poor glycemic control. These findings have important clinical implications, suggesting that healthcare professionals should not only aim for optimal HbA1c levels, but also pay attention to minimizing glycemic variability. Achieving stable and consistent blood glucose levels through strategies such as continuous blood glucose monitoring and tailored treatment plans should be a key focus in diabetes management. This also highlights the need for future research on interventions specifically designed to minimize glycemic variability.
- Previous large randomized controlled trials have identified intensive glycemic control, assessed based on the HbA1c level, as the strongest risk factor for the development and progression of DR in T2DM patients [31]. In DM patients, uncontrolled hyperglycemia increases the metabolic demand and can lead to hypoxia, which in turn can cause ischemic damage and trigger the development and progression of DR. However, few studies have investigated the effects of the HbA1c level on OCTA parameters in DM patients. Although it is essential to monitor the HbA1c levels at follow-up visits to determine the effects of glycemic control, most OCTA studies measured the HbA1c level at a single visit or over a relatively short period. In our study, the mean HbA1c level over 12 months was independently associated with early retinal microvascular alterations on OCTA, including an increase in choriocapillaris FD and FAZ enlargement. Interestingly, these parameters differed between DM patients and healthy controls, and among DM patients according to the degree of glycemic control. These results were significant even after adjusting for age, DM duration, and systemic hypertension.
- There were some limitations to the present study. First, the follow-up duration of 12 months was relatively short to evaluate glycemic control. Second, because this was an observational, non-interventional cohort study, glycemic control was not controlled by randomization. Therefore, DM severity or treatment adherence may have influenced our results. More research is still needed to elucidate the underlying mechanisms of the relationship between microvascular changes, including choriocapillaris deficit, and glycemic control. Third, we did not include a healthy control cohort at the beginning of the study, but instead used participants who received regular health checkups as controls. However, our study also had several strengths, including a large sample size and analysis of SS-OCTA parameters and mean HbA1c level. Longitudinal studies should analyze serial microvascular changes in OCTA parameters associated with glycemic control in T2DM patients with new-onset DR.
- In conclusion, early choriocapillaris changes on OCTA are correlated with mean HbA1c levels and precede clinical manifestations of DR, indicating a significant effect of glycemic control on the microcirculatory alterations seen in T2DM patients. These findings suggest that the choriocapillaris may be the earliest affected and most vulnerable region in DR.
DISCUSSION
SUPPLEMENTARY MATERIALS
Supplementary Table 1.
Supplementary Fig. 1.
Supplementary Fig. 2.
Supplementary Fig. 3.
-
CONFLICTS OF INTEREST
No potential conflict of interest relevant to this article was reported.
-
AUTHOR CONTRIBUTIONS
Conception or design: S.E.L., J.M.Y., K.B.
Acquisition, analysis, or interpretation of data: K.L., G.H.L., K.B.
Drafting the work or revising: K.L., S.E.L., J.M.Y., K.B.
Final approval of the manuscript: K.B.
-
FUNDING
This work was supported by the National Research Foundation of Korea (NRF) grant funded by the Korean government (MSIT) (2022R1F1A1074849). The funding organization had no role in the design or conduct of this research.
NOTES
-
Acknowledgements
- None


| Parameter | MC (n=81) | IC (n=88) | Control (n=90) | P valuea |
|---|---|---|---|---|
| Age, yr | 55.0±7.5 | 56.0±6.1 | 56.0±6.1 | 0.538 |
| Male sex | 55 (67.9) | 48 (54.5) | 56 (62.2) | 0.207 |
| Hypertension | 34 (42.0) | 32 (36.4) | 27 (30.0) | <0.001 |
| DM duration, yr | 5.7±5.1 | 4.5±3.4 | NA | 0.095 |
| Fasting blood glucose, mmol/L | 147.8±46.7 | 123.0±19.6 | 90.5±10.5 | <0.001 |
| Mean HbA1c, % | 8.2±1.3 | 6.5±0.3 | NA | <0.001 |
| Initial HbA1c, % | 8.7±1.9 | 6.8±1.3 | NA | <0.001 |
| BMI, kg/m2 | 25.2±2.0 | 25.3±2.4 | 24.5±3.5 | 0.614 |
| Systolic blood pressure, mm Hg | 128.0±7.4 | 128.0±6.8 | 120.4±9.5 | 0.999 |
| Diastolic blood pressure, mm Hg | 72.9±7.1 | 72.6±7.1 | 70.6±7.5 | 0.835 |
| Total cholesterol, mmol/L | 148.8±26.7 | 151.9±13.0 | 130.5±8.1 | 0.329 |
| HDL-C, mmol/L | 56.4±10.1 | 58.1±10.1 | NA | 0.289 |
| LDL-C, mmol/L | 68.2±24.2 | 64.9±13.1 | NA | 0.265 |
| eGFR, mL/min | 98.4±11.9 | 98.0±14.4 | NA | 0.863 |
| AST, IU/L | 26.3±7.4 | 24.0±5.2 | 25.3±2.1 | 0.020 |
| ALT, IU/L | 35.8±13.1 | 33.2±12.2 | 30.5±3.5 | 0.176 |
| Urine ACR, mg/mmol | 2.3±0.7 | 2.6±0.7 | NA | 0.175 |
| Medication | ||||
| Insulin | 17 (21.0) | 1 (1.1) | 0 | <0.001 |
| Anti-coagulants | 15 (18.5) | 13 (14.8) | 0 | <0.001 |
| Lipid-lowering agent | 50 (61.7) | 58 (69.0) | 0 | <0.001 |
| Ophthalmologic exam | ||||
| BCVA, logMAR | 0.05±0.08 | 0.04±0.06 | 0.04±0.08 | 0.649 |
| Intraocular pressure, mm Hg | 14.1±3.1 | 14.7±2.8 | 14.3±3.2 | 0.469 |
| Lens status, phakia | 71 (87.7) | 82 (93.2) | 87 (96.7) | 0.078 |
Values are presented as mean±standard deviation or number (%).
MC, moderate control; IC, intensive control; DM, diabetes mellitus; NA, not applicable; HbA1c, glycosylated hemoglobin; BMI, body mass index; HDL-C, high-density lipoprotein cholesterol; LDL-C, low-density lipoprotein cholesterol; eGFR, estimated glomerular filtration rate; AST, aspartate aminotransferase; ALT, alanine aminotransferase; ACR, albumin to creatinine ratio; BCVA, best-corrected visual acuity; logMAR, logarithm of the minimum angle of resolution.
a P values were calculated with the analysis of covariate (ANCOVA) with Bonferroni corrections.
- 1. Kim JH, Kim DJ, Jang HC, Choi SH. Epidemiology of microand macrovascular complications of type 2 diabetes in Korea. Diabetes Metab J 2011;35:571-7.ArticlePubMedPMC
- 2. Lee SH, Park SY, Choi CS. Insulin resistance: from mechanisms to therapeutic strategies. Diabetes Metab J 2022;46:15-37.ArticlePubMedPDF
- 3. Rosen RB, Andrade Romo JS, Krawitz BD, Mo S, Fawzi AA, Linderman RE, et al. Earliest evidence of preclinical diabetic retinopathy revealed using optical coherence tomography angiography perfused capillary density. Am J Ophthalmol 2019;203:103-15.ArticlePubMedPMC
- 4. Ishibashi F, Kosaka A, Tavakoli M. The impact of glycemic control on retinal photoreceptor layers and retinal pigment epithelium in patients with type 2 diabetes without diabetic retinopathy: a follow-up study. Front Endocrinol (Lausanne) 2021;12:614161.ArticlePubMedPMC
- 5. Lee MW, Lee WH, Ryu CK, Kim TY, Lim HB, Lee YH, et al. Effects of prolonged type 2 diabetes on the inner retinal layer and macular microvasculature: an optical coherence tomography angiography study. J Clin Med 2020;9:1849.ArticlePubMedPMC
- 6. Vujosevic S, Muraca A, Gatti V, Masoero L, Brambilla M, Cannillo B, et al. Peripapillary microvascular and neural changes in diabetes mellitus: an OCT-angiography study. Invest Ophthalmol Vis Sci 2018;59:5074-81.ArticlePubMed
- 7. Massin P, Marre M. Fundus photography for the screening for diabetic retinopathy. Diabetes Metab 2002;28:151-5.PubMed
- 8. Koleva-Georgieva D, Sivkova N. Assessment of serous macular detachment in eyes with diabetic macular edema by use of spectral-domain optical coherence tomography. Graefes Arch Clin Exp Ophthalmol 2009;247:1461-9.ArticlePubMedPDF
- 9. Lang GE. Optical coherence tomography findings in diabetic retinopathy. Dev Ophthalmol 2007;39:31-47.ArticlePubMed
- 10. Agemy SA, Scripsema NK, Shah CM, Chui T, Garcia PM, Lee JG, et al. Retinal vascular perfusion density mapping using optical coherence tomography angiography in normals and diabetic retinopathy patients. Retina 2015;35:2353-63.ArticlePubMed
- 11. Al-Sheikh M, Akil H, Pfau M, Sadda SR. Swept-source OCT angiography imaging of the foveal avascular zone and macular capillary network density in diabetic retinopathy. Invest Ophthalmol Vis Sci 2016;57:3907-13.ArticlePubMed
- 12. Nesper PL, Soetikno BT, Zhang HF, Fawzi AA. OCT angiography and visible-light OCT in diabetic retinopathy. Vision Res 2017;139:191-203.ArticlePubMedPMC
- 13. Yun JS, Lim TS, Cha SA, Ahn YB, Song KH, Choi JA, et al. Clinical course and risk factors of diabetic retinopathy in patients with type 2 diabetes mellitus in Korea. Diabetes Metab J 2016;40:482-93.PubMedPMC
- 14. Azad N, Agrawal L, Bahn G, Emanuele NV, Reaven PD, Hayward R, et al. Eye outcomes in Veteran Affairs Diabetes Trial (VADT) after 17 years. Diabetes Care 2021;44:2397-402.ArticlePubMedPMCPDF
- 15. Ipp E, Kumar M. A clinical conundrum: intensifying glycemic control in the presence of advanced diabetic retinopathy. Diabetes Care 2021;44:2192-3.ArticlePubMedPMCPDF
- 16. Zahid S, Dolz-Marco R, Freund KB, Balaratnasingam C, Dansingani K, Gilani F, et al. Fractal dimensional analysis of optical coherence tomography angiography in eyes with diabetic retinopathy. Invest Ophthalmol Vis Sci 2016;57:4940-7.ArticlePubMed
- 17. Cicinelli MV, Rabiolo A, Marchese A, de Vitis L, Carnevali A, Querques L, et al. Choroid morphometric analysis in non-neovascular age-related macular degeneration by means of optical coherence tomography angiography. Br J Ophthalmol 2017;101:1193-200.ArticlePubMed
- 18. Chu Z, Cheng Y, Zhang Q, Zhou H, Dai Y, Shi Y, et al. Quantification of choriocapillaris with phansalkar local thresholding: pitfalls to avoid. Am J Ophthalmol 2020;213:161-76.ArticlePubMedPMC
- 19. Zhang Q, Zheng F, Motulsky EH, Gregori G, Chu Z, Chen CL, et al. A novel strategy for quantifying choriocapillaris flow voids using swept-source OCT angiography. Invest Ophthalmol Vis Sci 2018;59:203-11.ArticlePubMedPMC
- 20. Twomey PJ, Rayman G, Pledger DR. Implications of different DCCT-aligned HbA1c methods on GMS clinical indicators. Diabet Med 2008;25:97-100.ArticlePubMed
- 21. King P, Peacock I, Donnelly R. The UK prospective diabetes study (UKPDS): clinical and therapeutic implications for type 2 diabetes. Br J Clin Pharmacol 1999;48:643-8.ArticlePubMedPMCPDF
- 22. Wu TE, Su YW, Chen HS. Mean HbA1c and HbA1c variability are associated with differing diabetes-related complications in patients with type 2 diabetes mellitus. Diabetes Res Clin Pract 2022;192:110069.ArticlePubMed
- 23. Lee MW, Koo HM, Lee WH, Park JH, Lee YH, Kim JY. Impacts of systemic hypertension on the macular microvasculature in diabetic patients without clinical diabetic retinopathy. Invest Ophthalmol Vis Sci 2021;62:21.Article
- 24. Zhang B, Chou Y, Zhao X, Yang J, Chen Y. Early detection of microvascular impairments with optical coherence tomography angiography in diabetic patients without clinical retinopathy: a meta-analysis. Am J Ophthalmol 2021;222:226-37.ArticlePubMed
- 25. Singh C. Metabolism and vascular retinopathies: current perspectives and future directions. Diagnostics (Basel) 2022;12:903.ArticlePubMedPMC
- 26. Moreira-Neto CA, Moult EM, Fujimoto JG, Waheed NK, Ferrara D. Choriocapillaris loss in advanced age-related macular degeneration. J Ophthalmol 2018;2018:8125267.ArticlePubMedPMCPDF
- 27. Dimitrova G, Kato S, Tamaki Y, Yamashita H, Nagahara M, Sakurai M, et al. Choroidal circulation in diabetic patients. Eye (Lond) 2001;15(Pt 5):602-7.ArticlePubMedPDF
- 28. Wang W, Guo X, Chen Y, Xiong K, Gong X, Yuan M, et al. Choriocapillaris perfusion assessed using swept source optical coherence tomographic angiography and the severity of diabetic retinopathy. Br J Ophthalmol 2023;107:836-41.ArticlePubMed
- 29. Muir ER, Renteria RC, Duong TQ. Reduced ocular blood flow as an early indicator of diabetic retinopathy in a mouse model of diabetes. Invest Ophthalmol Vis Sci 2012;53:6488-94.ArticlePubMedPMC
- 30. McLeod DS, Lutty GA. High-resolution histologic analysis of the human choroidal vasculature. Invest Ophthalmol Vis Sci 1994;35:3799-811.PubMed
- 31. Zoungas S, Arima H, Gerstein HC, Holman RR, Woodward M, Reaven P, et al. Effects of intensive glucose control on microvascular outcomes in patients with type 2 diabetes: a meta-analysis of individual participant data from randomised controlled trials. Lancet Diabetes Endocrinol 2017;5:431-7.ArticlePubMed
REFERENCES
Figure & Data
References
Citations
 PubReader
 ePub Link
 Cite
Cite- Figure
-

- Related articles
-
- The Beneficial Effect of Glycemic Control against Adverse Outcomes in Patients with Type 2 Diabetes Mellitus and Chronic Kidney Disease
- Navigating the Seas of Glycemic Control: The Role of Continuous Glucose Monitoring in Type 1 Diabetes Mellitus
- Change Profiles and Functional Targets of MicroRNAs in Type 2 Diabetes Mellitus Patients with Obesity
- Glycemic Control and Adverse Clinical Outcomes in Patients with Chronic Kidney Disease and Type 2 Diabetes Mellitus: Results from KNOW-CKD
- Regulation of Cellular Senescence in Type 2 Diabetes Mellitus: From Mechanisms to Clinical Applications


