- Current
- Browse
- Collections
-
For contributors
- For Authors
- Instructions to authors
- Article processing charge
- e-submission
- For Reviewers
- Instructions for reviewers
- How to become a reviewer
- Best reviewers
- For Readers
- Readership
- Subscription
- Permission guidelines
- About
- Editorial policy
Articles
- Page Path
- HOME > Diabetes Metab J > Volume 48(1); 2024 > Article
-
Original ArticleComplications Association of Muscle Mass Loss with Diabetes Development in Liver Transplantation Recipients
-
Sejeong Lee1,2
 , Minyoung Lee3, Young-Eun Kim1,3, Hae Kyung Kim1,3, Sook Jung Lee3, Jiwon Kim1,3, Yurim Yang4, Chul Hoon Kim4, Hyangkyu Lee5, Dong Jin Joo6, Myoung Soo Kim6, Eun Seok Kang1,3
 -
Diabetes & Metabolism Journal 2024;48(1):146-156.
DOI: https://doi.org/10.4093/dmj.2022.0100
Published online: January 3, 2024
- 925 Views
- 120 Download
1Graduate School, Yonsei University College of Medicine, Seoul, Korea
2Division of Endocrinology and Metabolism, Department of Internal Medicine, CHA Gangnam Medical Center, CHA University School of Medicine, Seoul, Korea
3Division of Endocrinology and Metabolism, Department of Internal Medicine, Yonsei University College of Medicine, Seoul, Korea
4Department of Pharmacology, Graduate School of Medical Science, Brain Korea 21 Project, Yonsei University College of Medicine, Seoul, Korea
5Mo-Im Kim Nursing Research Institute, Biobehavioral Research Center, Yonsei University College of Nursing, Seoul, Korea
6Division of Transplantation, Department of Surgery, Yonsei University College of Medicine, Seoul, Korea
-
Corresponding author: Eun Seok Kang Division of Endocrinology and Metabolism, Department of Internal Medicine, Yonsei University College of Medicine, 50-1 Yonsei-ro, Seodaemun-gu, Seoul 03722, Korea E-mail: edgo@yuhs.ac
Copyright © 2024 Korean Diabetes Association
This is an Open Access article distributed under the terms of the Creative Commons Attribution Non-Commercial License (http://creativecommons.org/licenses/by-nc/4.0/) which permits unrestricted non-commercial use, distribution, and reproduction in any medium, provided the original work is properly cited.
ABSTRACT
-
Background
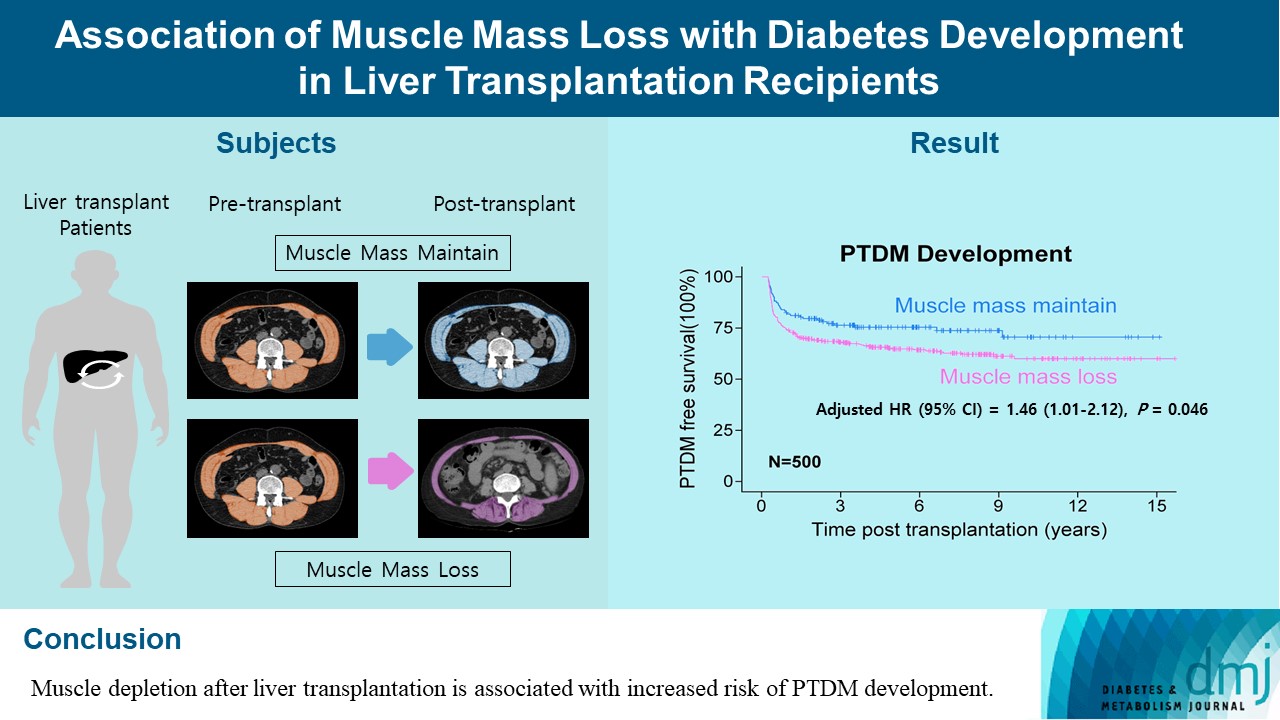
- Post-transplant diabetes mellitus (PTDM) is one of the most significant complications after transplantation. Patients with end-stage liver diseases requiring transplantation are prone to sarcopenia, but the association between sarcopenia and PTDM remains to be elucidated. We aimed to investigate the effect of postoperative muscle mass loss on PTDM development.
-
Methods
- A total of 500 patients who underwent liver transplantation at a tertiary care hospital between 2005 and 2020 were included. Skeletal muscle area at the level of the L3–L5 vertebrae was measured using computed tomography scans performed before and 1 year after the transplantation. The associations between the change in the muscle area after the transplantation and the incidence of PTDM was investigated using a Cox proportional hazard model.
-
Results
- During the follow-up period (median, 4.9 years), PTDM occurred in 165 patients (33%). The muscle mass loss was greater in patients who developed PTDM than in those without PTDM. Muscle depletion significantly increased risk of developing PTDM after adjustment for other confounding factors (hazard ratio, 1.50; 95% confidence interval, 1.23 to 1.84; P=0.001). Of the 357 subjects who had muscle mass loss, 124 (34.7%) developed PTDM, whereas of the 143 patients in the muscle mass maintenance group, 41 (28.7%) developed PTDM. The cumulative incidence of PTDM was significantly higher in patients with muscle loss than in patients without muscle loss (P=0.034).
-
Conclusion
- Muscle depletion after liver transplantation is associated with increased risk of PTDM development.
- Liver transplantation is an established treatment for end-stage liver disease, and the number of liver allograft recipients has increased with advances in surgical techniques or immunosuppressants [1]. As the life expectancy of the organ recipients increases, the incidence of metabolic diseases (diabetes, dyslipidemia, obesity, and metabolic syndrome) after liver transplantation is expected to increase [2]. Post-transplant diabetes mellitus (PTDM), which is one of the common complications after organ transplantation, has gained recognition as an important risk factor for mortality and allograft loss [3]. While there are known predisposing factors for PTDM that are similar to type 2 diabetes mellitus, specific post-transplant risk factors, such as adverse effects of immunosuppressive medications, may play a role in PTDM development [4].
- Sarcopenia, defined as significant loss of muscle strength and mass, is a major adverse consequence in patients with liver failure [5]. Patients with end-stage liver disease are vulnerable to loss of muscle mass due to abnormal protein metabolism required for muscle generation and increase in myostatin, which inhibits muscle growth [6]. Recent meta-analyses have indicated that the prevalence of sarcopenia ranges from 10% to 40% in healthy men and women aged 60 years and above, but it is estimated at 70% in patients with liver cirrhosis [7,8]. Previous studies have suggested that sarcopenia has a negative effect on various health-related outcomes in adults with chronic comorbidities [9]. In view of the proven role of muscles in glucose absorption and storage, a low muscle mass can lead to low glucose disposal and decreased metabolic rate, which may increase the risk of developing diabetes in patients with sarcopenia [10]. Because of its high prevalence and impact on measurable outcomes of sarcopenia in liver diseases, renewed interest exists in examining the effect of reduced muscle mass on postoperative survival after liver transplantation [11]. Sarcopenia was reported in several studies as an independent predictor of worse prognosis and reduced survival in patients with liver cirrhosis and liver transplant recipients [12-14]. As a curative treatment for liver failure, liver transplantation is speculated to reverse the clinical and metabolic abnormalities of the disease and its complications after transplantation. However, unlike other complications of end-stage liver diseases, sarcopenia does not tend to recover and may worsen after liver transplantation [15]. Reduction in muscle mass following liver transplantation and pre-transplant sarcopenia may contribute to the development of post-transplant metabolic diseases such as PTDM [16].
- Improved long-term outcomes after organ transplantation lead to concerns about post-transplant metabolic complications, particularly PTDM, as well as patient survival. Considering that the predictive factors for the incidence of PTDM have gained attention and that muscle mass loss is proven as a factor that causes diabetes incidence, the association of sarcopenia with PTDM can also be inferred. However, only few studies have adequately evaluated the association of sarcopenia with PTDM in organ transplant recipients.
- Despite the compelling results of previous studies on sarcopenia and PTDM as important prognostic factors, the association between muscle mass loss and the incidence of PTDM has not been highlighted. In this study, we hypothesized that progressive muscle depletion after liver transplantation is associated with increased risk of PTDM development. Therefore, the current study aimed to investigate whether sarcopenia is associated with PTDM development and to compare the incidence of PTDM in liver allograft patients with or without muscle loss.
INTRODUCTION
- Study design and population
- We performed a retrospective, observational cohort study to analyze the association between muscle mass loss and the incidence of diabetes in liver allograft recipients. A total of 1,121 individuals who underwent liver transplantation at a tertiary care hospital from January 2005 to March 2020 were included. Among these individuals, 842 patients had both accessible preoperative and 1-year postoperative abdominal computed tomography (CT) scans. Patients who had already been diagnosed with diabetes before the transplantation (n=190) or who died within 1 year after the surgery (n=94) were excluded. We also excluded patients aged <18 years as well as those who were lost to follow-up (n=58). Finally, 500 individuals were eligible for the study. The following data were collected by reviewing the patients’ electronic medical records: demographic data including a recipient’s age and sex; comorbidities including pre-transplant diabetes; and concomitant medical therapies such as antidiabetic drugs and immunosuppressants. In addition, the height, weight, body mass index (BMI) as a measure of the weight (kg) divided by the square of the height (m2), and the baseline laboratory results including liver function, kidney function and lipid profile at admission for the transplantation were recorded. The renal function was assessed using the chronic kidney disease epidemiology collaboration (CKD-EPI) formula for creatinine to calculate the estimated glomerular filtration rate (eGFR). In addition, the Model for End-stage Liver Disease (MELD), which is a predictor of mortality among patients with liver disease and the severity of the underlying liver disease, was calculated using an equation that considers serum bilirubin, creatinine, the international normalized ratio, and the need for dialysis. One of the well-known transplant-related causes of PTDM including hypomagnesemia, Underlying hepatitis C virus (HCV) infection and cytomegalovirus (CMV) disease after transplantation were evaluated by serum magnesium level, International Classification of Diseases-10 code and antiviral drug prescription [17]. PTDM was defined according to the American Diabetes Association criteria [18], when one of the following criteria was met: (1) symptoms of diabetes plus random plasma glucose ≥11.1 mmol/L (200 mg/dL); (2) fasting plasma glucose ≥7.0 mmol/L (126 mg/dL); (3) plasma glycosylated hemoglobin ≥6.5%; (4) initiate treatment for diabetes and continue the drug at least 3 months after transplantation, when patients are stable on their maintenance immunosuppression to exclude transient posttransplantation hyperglycemia [19]. Informed consent was waived because of the retrospective nature of the study. Thisstudy was approved by the Institutional Review Board of Severance Hospital, Seoul, Korea (IRB No. 4-2020-0548).
- Muscle mass analyses
- Currently, several tools are available to measure muscle mass. The quantification of the area on CT images to evaluate the body composition has been developed as an objective gold standard approach to diagnose sarcopenia [20]. CT-measured muscle cross-sectional area at the level of the lumbar vertebra, normalized to the height squared, as a skeletal muscle index, has emerged as an indicator of whole-body muscle mass [21]. Skeletal muscles can be quantified on a single-slice CT scan using pre-established radio density ranges of –29 to 150 Hounsfield units (HU) [22].
- We assessed the muscle mass by measuring the skeletal muscle area on cross-sectional abdominal CT scans and normalizing it to the height squared (m2), as the muscle area index (cm2/m2). The muscles that were analyzed included the psoas, paraspinal (erector spinae and quadratus lumborum), and abdominal wall muscles (rectus abdominis, transversus abdominis, external oblique, and internal oblique). In total, three cross-sectional slices were obtained at the endplate of the third to fifth lumbar vertebral levels (L3–L5) in both preoperative and 1-year postoperative CT scans. The baseline muscle area was defined as the sum of the muscle area index from L3 to L5 measured on preoperative CT. Additionally, muscle mass loss (∆muscle area) was measured by the change in the muscle area index, obtained by subtracting the post-transplant value from the pre-transplant one (preoperative value – year 1 postoperative value). All images were analyzed by a single trained observer using Aquarius iNtuition Viewer V4.4.13 (TeraRecon, Durham, NC, USA), a semi-automated measuring tool that enables specific tissue demarcation using HU thresholds. An attenuation between –29 and 150 HU was defined as indicating skeletal muscle tissue, and muscle area was calculated by summing up the area of the selected muscle pixels.
- Statistical analyses
- Normally distributed continuous variables were described as means and standard deviations; non-normal continuous variables, as medians and interquartile ranges; and categorical variables, as numbers and percentages. The Mann-Whitney U test was used to compare non-normally distributed variables, and the Student’s t-test was performed to compare normally distributed variables. Categorical variables were compared using a chi-square test or Fisher’s exact test, as appropriate. The cumulative incidences of PTDM were calculated using the Kaplan-Meier method, and the differences between the patients with muscle loss and those without muscle loss were assessed using the log-rank test. The time frame for PTDM incidence was defined as the time from the date of operation to the date of PTDM diagnosis. Several clinical risk factors for developing PTDM have been reported in the literature [23,24] and the prognostic markers indicated by the univariate analysis were subjected to a multivariable Cox proportional hazards analysis; the association between muscle mass loss and the incidence of PTDM was assessed using a multivariable analysis. The findings were expressed as hazard ratio (HR) with 95% confidence interval (CI). The predictive performance of ∆muscle area was assessed using the receiver operating characteristic (ROC) analyses, and the areas under the ROC curves (AUCs) were calculated. All statistical analyses were performed with the R software version 3.6.3 (R Project for Statistical Computing, Vienna, Austria). A two-sided P value <0.05 was considered significant for all statistical tests.
METHODS
- Baseline characteristics of the enrolled patients
- Of the 500 patients, 360 were men (72%) and 140, women (28%). The mean age was 52.9±9.0 years (range, 19 to 72), and the median follow-up period was 4.9 years. Table 1 shows the descriptive characteristics of the participants with and without PTDM. A total of 165 (33%) individuals developed diabetes mellitus. Compared with those without PTDM, those with PTDM were older and had a lower eGFR. Serum magnesium levels and the rates of HCV infection, CMV disease were not statistically different between the two groups, and the follow-up period was significantly longer in the PTDM group. The median ∆muscle area was a positive value in both groups, which indicates that the muscle mass had decreased after the surgery. The ∆muscle area was greater in patients with PTDM than in those without PTDM, which indicates that the loss of muscle mass was greater in those who developed PTDM among the liver allograft recipients. The study population received dual immunosuppressive therapy for 1 year after surgery, which included a steroid (prednisolone or deflazacort) plus one other immunosuppressive drug such as, calcineurin inhibitor (CNI), mycophenolate mofetil (MMF), and mammalian target of rapamycin inhibitor (mTORi). No significant difference was found in the immunosuppressive regimen between the two groups. The baseline muscle area, which is the total skeletal muscle index of the L3–L5 cross-sectional area, was greater in patients with PTDM, but the difference between the two groups was not statistically significant.
- Muscle mass loss as an independent risk factor for PTDM
- The results of univariate and adjusted multivariable Cox regression are shown in Table 2. The univariate analysis revealed that age (HR, 1.02; 95% CI, 1.00 to 1.04; P=0.02), eGFR (HR, 0.99; 95% CI, 0.98 to 0.99; P=0.004), hypomagnesemia (HR, 2.93; 95% CI, 1.19 to 7.19; P=0.019), and ∆muscle area (HR, 1.51; 95% CI, 1.28 to 1.79; P<0.001) were significantly associated with the development of PTDM. With regard to the potential confounding factors, we selected variables to be corrected by referring to previous studies on risk factors for developing PTDM, such as the recipient’s age, sex, BMI, hypomagnesemia, HCV infection, CMV disease, and immunosuppressive agents [17]. In addition, variables that had significant association (P<0.05) with the dependent variable in the univariate analysis were also included in the multivariable analysis. In the multivariable Cox regression analysis, adjusted by age, sex, BMI, eGFR, fasting glucose, MELD score, HCV infection, CMV disease immunosuppressive agents, follow-up duration, and baseline muscle area, the ∆muscle area remained independently associated with a higher incidence of PTDM (HR, 1.30; 95% CI, 1.10 to 1.57; P<0.004).
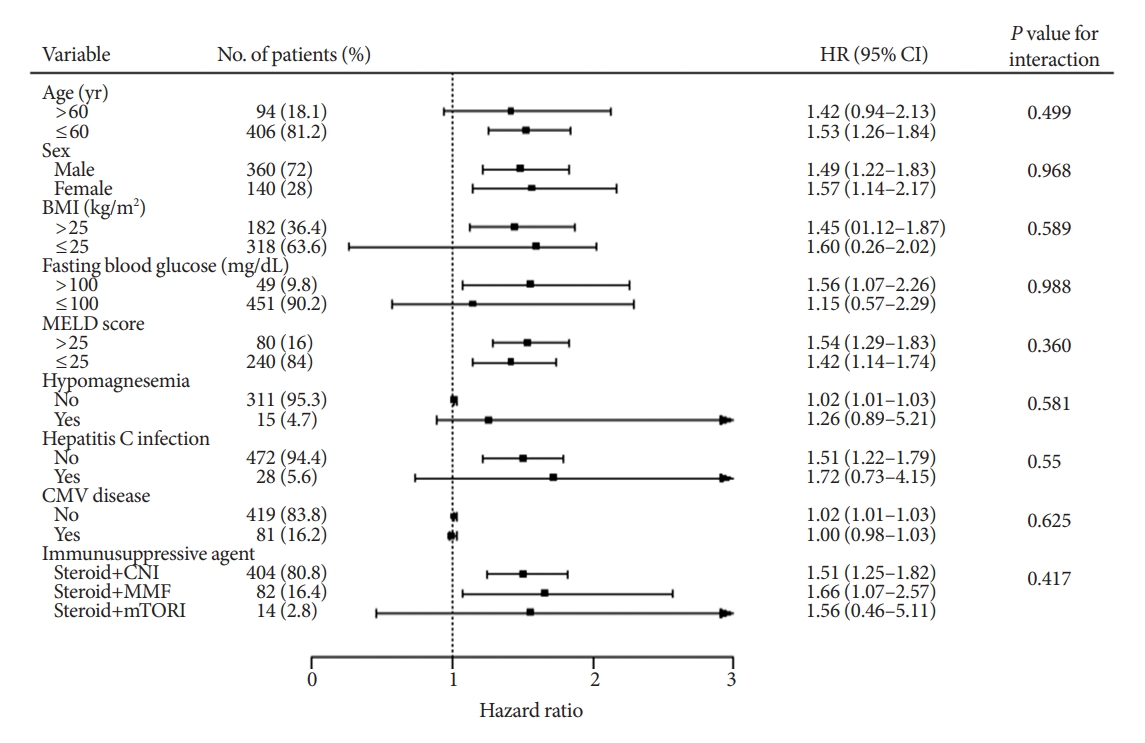
- We performed subgroup analyses for developing diabetes to further verify whether the effect of muscle mass loss was consistent among different clinical situations (Fig. 1). In the subgroup analyses, the pooled HR of most subtotal estimates suggested that the risk of developing PTDM associated with muscle mass loss after surgery was not affected by age, sex, BMI, fasting blood glucose, MELD score, hypomagnesemia, HCV infection, CMV disease, or immunosuppressive regimens (all interactions showed P>0.05) and did not show heterogeneity across subgroups (all HRs >1.0).
- Muscle mass loss as a complementary prognostic predictive factor
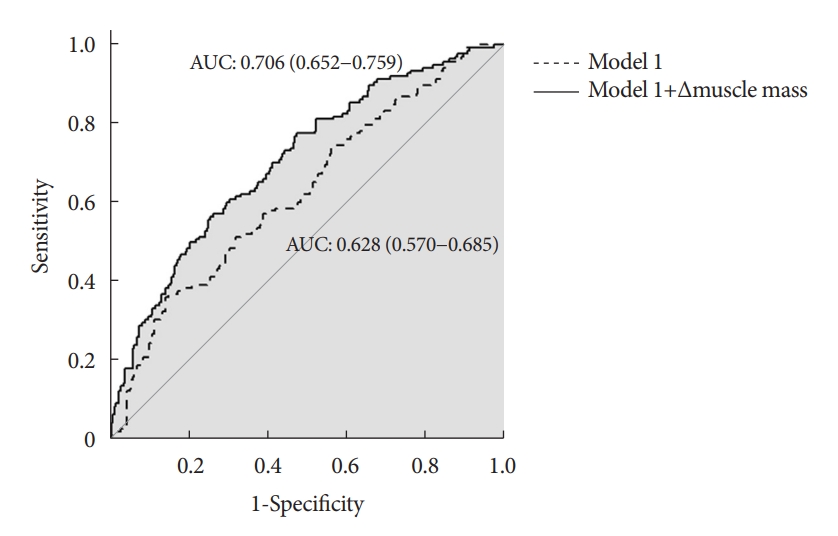
- To determine the predictive accuracy of muscle mass loss for developing diabetes, an ROC curve analysis was performed for logistic regression models (Fig. 2). Model 1 was generated with the established factors for the prevalence of PTDM, i.e., age, sex, BMI, MELD score, fasting glucose, hypomagnesemia, HCV infection, CMV disease, and immunosuppressive agents. Adding the ∆muscle area as a continuous variable to model 1, the AUC of model 1+ ∆muscle area (0.71; 95% CI, 0.65 to 0.76) was significantly greater than that of model 1 alone (0.63; 95% CI, 0.57 to 0.69). From these results, we suggested that the degree of muscle loss may enhance the significant predictive values for the incidence of PTDM.
- Comparison of the development of diabetes between the recipients with and without muscle mass loss
- The study subjects were divided into two groups based on the ∆muscle area=0 (with muscle loss and without muscle loss). Of the 500 subjects in the study, 357 were in the group with muscle mass loss and 143 were in the group without muscle loss. The overall crude HR for PTDM development was significantly higher in the group with muscle loss than in that without muscle loss (HR, 1.52; 95% CI, 1.05 to 2.20; P=0.020), and the adjusted HR was still statistically significant (HR, 1.46; 95% CI, 1.01 to 2.12; P=0.046) after adjusting for the confounding factors (Table 3).
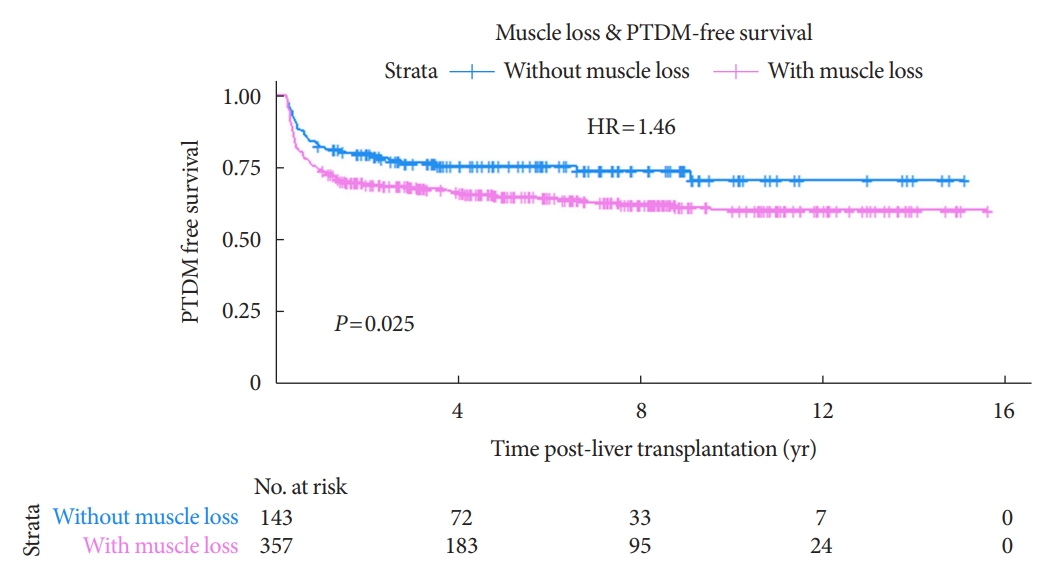
- In addition, the Kaplan-Meier curve and log-rank test were used to compare the incidence of PTDM in both groups over time. The Kaplan-Meier curves of the incidence of PTDM in patients with and without muscle mass loss are shown in Fig. 3. The development of PTDM was significantly higher in the recipients with muscle loss than in those without; the P value for the log-rank test was 0.025. During the total follow-up period, PTDM developed in 124 individuals with muscle loss (34.7%) and in 41 individuals without muscle loss (28.7%). Majority of the PTDM cases (72%) occurred within 1 year after transplantation.
- Considering that the majority of PTDM cases occurred within 1 year, additional analysis was performed by setting only 1 year after PTDM diagnosis as the outcome. Among 357 patients in the with muscle loss group, 40 cases of PTDM occurred after 1 year, and seven out of 143 patients in the without group. The results of Cox regression were also statistically significant. ∆muscle area (HR, 1.03; 95% CI, 1.01 to 1.05; P<0.001) was significantly associated with the development of PTDM diagnosed after 1 year (Supplementary Table 1). The overall crude HR and the adjusted HR for PTDM occurring after 1 year was also significantly higher in the group with muscle loss (Supplementary Table 2). In the Kaplan-Meier curve and log-rank test, the P value was 0.058, which was not statistically significant, but the similar tendency was observed.
RESULTS
- The present long-term retrospective cohort study investigated the association of sarcopenia with the development of diabetes after liver transplantation in allograft recipients. Our results demonstrated that loss of muscle mass was associated with increased risks of PTDM incidence in liver allograft recipients. Moreover, the association between muscle mass loss and the prevalence of PTDM was not affected by other potential confounding risk factors for PTDM such as recipient’s age, sex, BMI, MELD score, hypomagnesemia, HCV infection, CMV disease and immunosuppressive agents, follow-up duration, and baseline muscle area. That is, post-transplant muscle mass loss was significantly associated with the occurrence of PTDM rather than pre-transplant muscle mass. From these results, we suggested that progressive muscle mass loss after transplantation may have an independent effect on the development of PTDM.
- Sarcopenia was first described as an age-related process in older people, but it has become a rising concern associated with various chronic diseases including end-stage liver disease [20,25]. In 2019, a North American expert’s opinion on sarcopenia in liver transplantation was published to present the necessity of including sarcopenia as a factor to consider in the management and treatment of liver transplantation candidates [26]. Similarly, PTDM is a common complication of transplantation and contributes significantly to mortality and morbidity in organ transplant recipients [27,28]. Despite of the clinical significance of sarcopenia has been increasingly reported, the lack of a standardized definition of sarcopenia and defined cutoffs for different measurement tools makes sarcopenia diagnosis difficult. Although validated the skeletal muscle index cutpoints in 400 patients listed for liver transplantation from a North American multicenter cohort has been used to predict mortality [29], numerous questions remain including the optimal cut-off values for diagnosing sarcopenia, particularly in certain populations, such as terminally ill patients, because they have different susceptibilities to sarcopenia from those of the general population [26]. Additionally, sarcopenia in patients with liver diseases is known to continue even after liver transplantation, a definitive treatment for the diseases [16]. Several studies have suggested that a significant loss of body mass occurs after liver transplantation [30,31]. Consistent sarcopenia in liver allograft recipients is a poorly recognized problem, and the mechanisms that contribute to post-transplant sarcopenia have not been evaluated sufficiently. The recognized causes of failure to regain skeletal muscle mass after transplantation are multi-factorial and the possible explanations are as follows: persistent hypermetabolism, use of immunosuppressive agents, complications after transplantation, and lifestyle with little exercise. Portal hypertension and collateral circulation are reversed partially after transplantation [32], resulting in persistent malnutrition, and many transplant recipients often lack exercise because they remain sedentary [33]. Immunosuppressive agents, including corticosteroids, CNI, MMF, and mTORi, contribute to progressive muscle loss by increasing proteolysis and delaying regeneration mediated by myostatin, a potent inhibitor of muscle proteostasis [34,35].
- Considering the continued muscle loss after surgery, we measured both pre-transplant and post-transplant muscle mass, and the difference between the two values was used for analysis. From our results, along with the results of the previously mentioned studies, the muscle area index after the surgery decreased in most of the study population as compared with the pre-transplant area: from 170.3 to 154.2 (cm2/m2) in patients without PTDM versus from 175.0 to 150.3 (cm2/m2) in patients with PTDM. Although other complications of end-stage liver disease are resolved after liver transplantation, muscle depletion can remain a persistent concern for liver transplant recipients.
- Muscle area measurements can be assessed using dual-energy X-ray absorptiometry, CT, magnetic resonance imaging, and bioimpedance analysis to identify sarcopenia [36]. Among these methods, cross-sectional imaging techniques, including CT scans, have been considered the gold standard modalities because of their accuracy and reliability [37]. The liver allograft recipients who were the subjects of our study were recommended to undergo three-phase intravenous contrast CT as a preoperative work-up for anatomical evaluation [38] and usually underwent regular follow-up imaging and laboratory examination. With advances in technology, software that can automatically calculate muscle areas on CT images makes the assessment for sarcopenia more accessible [39]. In this regard, the secondary analysis of CT images in this organ transplantation population could be useful to estimate sarcopenia and provide perspective on the predicting outcomes after organ transplantation such as PTDM and mortality.
- The present study has several limitations. First, this was a retrospective study, and we could not determine the causality between sarcopenia and the occurrence of PTDM. In addition, the diagnosis of sarcopenia should be based on both functional damage and loss of muscle mass, but since this study is a retrospective study that functional evaluation was not performed. Second, reverse causality could exist between muscle mass loss and PTDM development. Sarcopenia has been implicated as both a cause and a consequence of diabetes mellitus with regard to their bidirectional relationship [9]. Despite the exclusion of pre-transplant diabetes, the sequence of the two events may be unclear since both diseases develop gradually and it is difficult to determine the exact time of diagnosis due to the follow-up interval. Third, another limitation of the current study is insufficient donor information. Several donor factors affect recipient outcomes including whether the graft is from a living donor or a cadaveric donor, the age of the donor, hepatic steatosis of the graft, and donor-recipient mismatch such as ABO incompatibility. These graft factors may have been potential confounders in this study. Additionally, the lack of data including the previous history of patients, medications known to affect diabetes development (i.e., statin), and lifestyle factors, such as smoking and alcohol drinking, could have prevented the control of confounding factors. Since the liver is associated with insulin resistance, the inability to perform dynamic tests of glucose tolerance or insulin sensitivity for comprehensive diabetes risk assessment may be a limitation of this retrospective study.
- As the incidence and importance of post-transplant diabetes have evolved in accordance with other developments in transplantation, discussing approaches to reduce complications that affect the quality of life after transplantation is necessary. To the best of our knowledge, this is the first large-scale cohort study to investigate the association of muscle loss with diabetes development after transplantation. Similarly, a prospective study conducted in 53 patients who underwent orthotopic liver transplantation reported that sarcopenia has adverse effects on several clinical consequences including new-onset diabetes during follow-up [16]. Other than that, the relationship between muscle mass loss and PTDM development has not been sufficiently studied, and the association between the two components has remained inconclusive. While most previous studies investigated the association between pre-transplant muscle mass and post-transplant outcome, the present study focused on a progressive muscle mass loss in transplant recipient. Since sarcopenia of liver transplant recipients often progresses after transplantation, it is important to manage the liver transplant recipients to maintain sufficient muscle mass after the transplantation. In the same context, the results of this study will contribute to suggesting additional care for organ allograft recipients; prevent progression of sarcopenia by correcting modifiable factors such as insufficient nutrient intake or physical inactivity and avoid occurrence of metabolic complications after transplantation. Further prospective studies with larger populations and longitudinal studies are warranted to conclude a causal association between muscle mass loss and the incidence of diabetes after transplantation.
- In conclusion, in this study, we found that muscle depletion after liver transplantation is associated with increased risk of PTDM development in liver allograft patients. The association remained statistically significant after adjusting for several confounding factors. Compared with the incidence of diabetes in recipients with muscle mass loss, patients without muscle mass loss had a significantly lower incidence of diabetes. The results of this study suggest that CT can be used to measure muscle mass to predict diabetes occurrence in transplant patients. Sarcopenia may be considered as a factor in the assessment of the risk of developing PTDM. Assessing the risk of PTDM can help to predict PTDM incidence in clinical practice and develop PTDM prevention strategies.
DISCUSSION
SUPPLEMENTARY MATERIALS
Supplementary Table 1.
Supplementary Table 2.
-
CONFLICTS OF INTEREST
No potential conflict of interest relevant to this article was reported.
-
AUTHOR CONTRIBUTIONS
Conception or design: E.S.K.
Acquisition, analysis, or interpretation of data: S.L., Y.E.K., H.K.K., S.J.L., J.K., Y.Y., C.H.K., H.L., D.J.J., M.S.K., E.S.K.
Drafting the work or revising: S.L., M.L., E.S.K.
Final approval of the manuscript: S.L., E.S.K.
-
FUNDING
Sponsorship for this study was funded by the Handok Inc., Seoul, Republic of Korea. The funders had no role in the study design, data collection and analysis, decision to publish, or preparation of the manuscript.
This work was supported by a faculty research grant of the Yonsei University College of Medicine (6-2017-0053) and the Bio & Medical Technology Development Program of the NRF, Korea, MSIP (2016R1A2B4013029 and 2019R1A2C2007514).
NOTES
-
Acknowledgements
- This study was supported by the ‘SENTINEL (Severance ENdocrinology daTa scIeNcE pLatform)’ program of the Endocrinology Division, Department of Internal medicine, Yonsei University College of Medicine, Seoul, Korea (4-2018-1215; DUCD000002).


Values are presented as mean±standard deviation, number (%), or median (interquartile range).
PTDM, post-transplant diabetes mellitus; BMI, body mass index; HDL-C, high-density lipoprotein cholesterol; LDL-C, low-density lipoprotein cholesterol; AST, aspartate aminotransferase; ALT, alanine aminotransferase; rGT, gamma glutamyl transferase; eGFR, estimated glomerular filtration rate; PT, prothrombin time; INR, international normalized ratio; MELD, Model for End-stage Liver Disease; CNI, calcineurin inhibitor; MMF, mycophenolate mofetil; mTORi, mammalian target of rapamycin inhibitor; HCV, hepatitis C virus; CMV, cytomegalovirus.
| Factor |
Univariable analysis |
Multivariable analysisa |
||
|---|---|---|---|---|
| HR (95% CI) | P value | HR (95% CI) | P value | |
| Age, yr | 1.02 (1.00–1.04) | 0.020 | 1.03 (0.99–1.05) | 0.136 |
| Sex (ref. male) | 0.79 (0.55–1.13) | 0.200 | 1.19 (0.68–2.09) | 0.457 |
| BMI, kg/m2 | 0.99 (0.95–1.04) | 0.700 | 0.99 (0.92–1.06) | 0.564 |
| Fasting glucose | 0.99 (0.98–1.00) | 0.200 | 1.01 (0.99–1.02) | 0.521 |
| eGFR, mL/min/1.73 m2 | 0.99 (0.98–0.99) | 0.004 | 0.99 (0.99–1.01) | 0.455 |
| MELD score | 1.02 (0.99–1.05) | 0.060 | 1.04 (0.99–1.09) | 0.183 |
| Hypomagnesemia | 2.93 (1.19–7.19) | 0.019 | 2.57 (0.58–11.47) | 0.252 |
| HCV infection (ref. No) | 0.56 (0.24–1.29) | 0.621 | 0.53 (0.19–1.47) | 0.162 |
| CMV disease (ref. No) | 0.83 (0.31–1.95) | 0.534 | 0.57 (0.31–1.05) | 0.073 |
| Immunosuppressive agent | ||||
| Steroid+CNI (ref) | 1.00 | 1.000 | 1.00 | >0.999 |
| Steroid+MMF | 0.66 (0.41–1.05) | 0.078 | 0.41 (0.18–1.02) | 0.065 |
| Steroid+mTORi | 0.63 (0.20–1.99) | 0.434 | 0.43 (0.06–3.17) | 0.406 |
| Follow-up duration, yr | 1.04 (0.99–1.08) | 0.080 | 1.06 (0.68–1.33) | 0.235 |
| Baseline muscle index | 1.00 (1.00–1.01) | 0.050 | 1.00 (0.99–1.01) | 0.443 |
| ∆Muscle area, cm2/m2 | 1.51 (1.28–1.79) | <0.001 | 1.30 (1.10–1.57) | 0.004 |
HR, hazard ratio; CI, confidence interval; BMI, body mass index; eGFR, estimated glomerular filtration rate; MELD, Model for End-stage Liver Disease; HCV, hepatitis C virus; CMV, cytomegalovirus; CNI, calcineurin inhibitor; MMF, mycophenolate mofetil; mTORi, mammalian target of rapamycin inhibitor.
a Model adjusted for age, sex, BMI, eGFR, hypomagnesemia, HCV infection, CMV disease, and immunosuppressive agents.
| No. of patients (%) | Events | Crude HR (95% CI) | P value | Adjusteda HR (95% CI) | P value | |
|---|---|---|---|---|---|---|
| PTDM | ||||||
| With muscle loss | 357 (71.4) | 124 | 1.52 (1.05–2.20) | 0.020 | 1.46 (1.01–2.12) | 0.046 |
| Without muscle loss | 143 (28.6) | 41 | 1.0 (reference) | 1.0 (reference) |
- 1. Rana A, Gruessner A, Agopian VG, Khalpey Z, Riaz IB, Kaplan B, et al. Survival benefit of solid-organ transplant in the United States. JAMA Surg 2015;150:252-9.ArticlePubMed
- 2. Friedman AN, Miskulin DC, Rosenberg IH, Levey AS. Demographics and trends in overweight and obesity in patients at time of kidney transplantation. Am J Kidney Dis 2003;41:480-7.ArticlePubMed
- 3. Kasiske BL, Snyder JJ, Gilbertson D, Matas AJ. Diabetes mellitus after kidney transplantation in the United States. Am J Transplant 2003;3:178-85.ArticlePubMedPDF
- 4. Jenssen T, Hartmann A. Post-transplant diabetes mellitus in patients with solid organ transplants. Nat Rev Endocrinol 2019;15:172-88.ArticlePubMedPDF
- 5. Dasarathy S. Posttransplant sarcopenia: an underrecognized early consequence of liver transplantation. Dig Dis Sci 2013;58:3103-11.ArticlePubMedPMCPDF
- 6. Sinclair M, Gow PJ, Grossmann M, Angus PW. Review article: sarcopenia in cirrhosis: aetiology, implications and potential therapeutic interventions. Aliment Pharmacol Ther 2016;43:765-77.ArticlePubMed
- 7. Kim G, Kang SH, Kim MY, Baik SK. Prognostic value of sarcopenia in patients with liver cirrhosis: a systematic review and meta-analysis. PLoS One 2017;12:e0186990.ArticlePubMedPMC
- 8. Mayhew AJ, Amog K, Phillips S, Parise G, McNicholas PD, de Souza RJ, et al. The prevalence of sarcopenia in community-dwelling older adults, an exploration of differences between studies and within definitions: a systematic review and meta-analyses. Age Ageing 2019;48:48-56.ArticlePubMed
- 9. Mesinovic J, Zengin A, De Courten B, Ebeling PR, Scott D. Sarcopenia and type 2 diabetes mellitus: a bidirectional relationship. Diabetes Metab Syndr Obes 2019;12:1057-72.PubMedPMC
- 10. Moon SS. Low skeletal muscle mass is associated with insulin resistance, diabetes, and metabolic syndrome in the Korean population: the Korea National Health and Nutrition Examination Survey (KNHANES) 2009-2010. Endocr J 2014;61:61-70.ArticlePubMed
- 11. Montano-Loza AJ, Meza-Junco J, Baracos VE, Prado CM, Ma M, Meeberg G, et al. Severe muscle depletion predicts postoperative length of stay but is not associated with survival after liver transplantation. Liver Transpl 2014;20:640-8.ArticlePubMedPDF
- 12. Pinto Dos Santos D, Kloeckner R, Koch S, Hoppe-Lotichius M, Zoller D, Toenges G, et al. Sarcopenia as prognostic factor for survival after orthotopic liver transplantation. Eur J Gastroenterol Hepatol 2020;32:626-34.ArticlePubMed
- 13. Chang KV, Chen JD, Wu WT, Huang KC, Han DS. Association of loss of muscle mass with mortality in liver cirrhosis without or before liver transplantation: a systematic review and meta-analysis. Medicine (Baltimore) 2019;98:e14373.PubMedPMC
- 14. Kuo SZ, Ahmad M, Dunn MA, Montano-Loza AJ, Carey EJ, Lin S, et al. Sarcopenia predicts post-transplant mortality in acutely ill men undergoing urgent evaluation and liver transplantation. Transplantation 2019;103:2312-7.ArticlePubMedPMC
- 15. Dasarathy S. Myostatin and beyond in cirrhosis: all roads lead to sarcopenia. J Cachexia Sarcopenia Muscle 2017;8:864-9.ArticlePubMedPMCPDF
- 16. Tsien C, Garber A, Narayanan A, Shah SN, Barnes D, Eghtesad B, et al. Post-liver transplantation sarcopenia in cirrhosis: a prospective evaluation. J Gastroenterol Hepatol 2014;29:1250-7.ArticlePubMedPMCPDF
- 17. Yadav AD, Chang YH, Aqel BA, Byrne TJ, Chakkera HA, Douglas DD, et al. New onset diabetes mellitus in living donor versus deceased donor liver transplant recipients: analysis of the UNOS/OPTN Database. J Transplant 2013;2013:269096.ArticlePubMedPMCPDF
- 18. American Diabetes Association. Diagnosis and classification of diabetes mellitus. Diabetes Care 2014;37 Suppl 1:S81-90.ArticlePubMedPDF
- 19. Sharif A, Hecking M, de Vries AP, Porrini E, Hornum M, Rasoul-Rockenschaub S, et al. Proceedings from an international consensus meeting on posttransplantation diabetes mellitus: recommendations and future directions. Am J Transplant 2014;14:1992-2000.ArticlePubMedPMC
- 20. Cruz-Jentoft AJ, Baeyens JP, Bauer JM, Boirie Y, Cederholm T, Landi F, et al. Sarcopenia: European consensus on definition and diagnosis: report of the European Working Group on Sarcopenia in Older People. Age Ageing 2010;39:412-23.PubMedPMC
- 21. Shen W, Punyanitya M, Wang Z, Gallagher D, St-Onge MP, Albu J, et al. Total body skeletal muscle and adipose tissue volumes: estimation from a single abdominal cross-sectional image. J Appl Physiol (1985) 2004;97:2333-8.ArticlePubMed
- 22. Mitsiopoulos N, Baumgartner RN, Heymsfield SB, Lyons W, Gallagher D, Ross R. Cadaver validation of skeletal muscle measurement by magnetic resonance imaging and computerized tomography. J Appl Physiol (1985) 1998;85:115-22.ArticlePubMed
- 23. Xie L, Tang W, Wang X, Wang L, Lu Y, Lin T. Pretransplantation risk factors associated with new-onset diabetes after living-donor kidney transplantation. Transplant Proc 2016;48:3299-302.ArticlePubMed
- 24. Han E, Kim MS, Kim YS, Kang ES. Risk assessment and management of post-transplant diabetes mellitus. Metabolism 2016;65:1559-69.ArticlePubMed
- 25. An HJ, Tizaoui K, Terrazzino S, Cargnin S, Lee KH, Nam SW, et al. Sarcopenia in autoimmune and rheumatic diseases: a comprehensive review. Int J Mol Sci 2020;21:5678.ArticlePubMedPMC
- 26. Carey EJ, Lai JC, Sonnenday C, Tapper EB, Tandon P, Duarte-Rojo A, et al. A North American expert opinion statement on sarcopenia in liver transplantation. Hepatology 2019;70:1816-29.ArticlePubMedPMCPDF
- 27. Werzowa J, Pacini G, Hecking M, Fidler C, Haidinger M, Brath H, et al. Comparison of glycemic control and variability in patients with type 2 and posttransplantation diabetes mellitus. J Diabetes Complications 2015;29:1211-6.ArticlePubMed
- 28. Valderhaug TG, Hjelmesæth J, Hartmann A, Roislien J, Bergrem HA, Leivestad T, et al. The association of early posttransplant glucose levels with long-term mortality. Diabetologia 2011;54:1341-9.ArticlePubMedPMC
- 29. Lai JC, Tandon P, Bernal W, Tapper EB, Ekong U, Dasarathy S, et al. Malnutrition, frailty, and sarcopenia in patients with cirrhosis: 2021 practice guidance by the American Association for the Study of Liver Diseases. Hepatology 2021;74:1611-44.ArticlePubMedPMCPDF
- 30. Hussaini SH, Oldroyd B, Stewart SP, Soo S, Roman F, Smith MA, et al. Effects of orthotopic liver transplantation on body composition. Liver 1998;18:173-9.ArticlePubMed
- 31. Plank LD, Metzger DJ, McCall JL, Barclay KL, Gane EJ, Streat SJ, et al. Sequential changes in the metabolic response to orthotopic liver transplantation during the first year after surgery. Ann Surg 2001;234:245-55.ArticlePubMedPMC
- 32. Muller MJ, Loyal S, Schwarze M, Lobers J, Selberg O, Ringe B, et al. Resting energy expenditure and nutritional state in patients with liver cirrhosis before and after liver transplantation. Clin Nutr 1994;13:145-52.ArticlePubMed
- 33. Kallwitz ER, Loy V, Mettu P, Von Roenn N, Berkes J, Cotler SJ. Physical activity and metabolic syndrome in liver transplant recipients. Liver Transpl 2013;19:1125-31.ArticlePubMedPDF
- 34. Kallwitz ER. Sarcopenia and liver transplant: the relevance of too little muscle mass. World J Gastroenterol 2015;21:10982-93.ArticlePubMedPMC
- 35. Kivela R, Salmela I, Nguyen YH, Petrova TV, Koistinen HA, Wiener Z, et al. The transcription factor Prox1 is essential for satellite cell differentiation and muscle fibre-type regulation. Nat Commun 2016;7:13124.PubMedPMC
- 36. Hamaguchi Y, Kaido T, Okumura S, Kobayashi A, Hammad A, Tamai Y, et al. Proposal for new diagnostic criteria for low skeletal muscle mass based on computed tomography imaging in Asian adults. Nutrition 2016;32:1200-5.ArticlePubMed
- 37. Fosbol MO, Zerahn B. Contemporary methods of body composition measurement. Clin Physiol Funct Imaging 2015;35:81-97.ArticlePubMed
- 38. European Association for the Study of the Liver. EASL clinical practice guidelines: liver transplantation. J Hepatol 2016;64:433-85.ArticlePubMed
- 39. Uchiyama H. Sarcopenia in liver transplant recipients: its relevance to peritransplant morbidity and mortality. Hepatobiliary Surg Nutr 2017;6:196-9.ArticlePubMedPMC
 PubReader
 ePub Link
 Cite
Cite