- Current
- Browse
- Collections
-
For contributors
- For Authors
- Instructions to authors
- Article processing charge
- e-submission
- For Reviewers
- Instructions for reviewers
- How to become a reviewer
- Best reviewers
- For Readers
- Readership
- Subscription
- Permission guidelines
- About
- Editorial policy
Articles
- Page Path
- HOME > Diabetes Metab J > Volume 46(3); 2022 > Article
-
Original ArticleDrug/Regimen Comparison of Prevailing Insulin Regimens at Different Time Periods in Hospitalized Patients: A Real-World Experience from a Tertiary Hospital
-
Sun Joon Moon1,2*
 , Hun Jee Choe1,3*, Soo Heon Kwak1,3, Hye Seung Jung1,3, Kyong Soo Park1,3, Young Min Cho1,3
 -
Diabetes & Metabolism Journal 2022;46(3):439-450.
DOI: https://doi.org/10.4093/dmj.2021.0065
Published online: October 20, 2021
- 65,535 Views
- 268 Download
1Department of Internal Medicine, Seoul National University College of Medicine, Seoul, Korea
2Division of Endocrinology and Metabolism, Department of Internal Medicine, Kangbuk Samsung Hospital, Sungkyunkwan University School of Medicine, Seoul, Korea
3Division of Endocrinology and Metabolism, Department of Internal Medicine, Seoul National University Hospital, Seoul, Korea
-
Corresponding author: Young Min Cho Department of Internal Medicine, Seoul National University College of Medicine, 101 Daehak-ro, Jongno-gu, Seoul 03080, Korea E-mail: ymchomd@snu.ac.kr
- *Sun Joon Moon and Hun Jee Choe contributed equally to this study as first authors.
Copyright © 2022 Korean Diabetes Association
This is an Open Access article distributed under the terms of the Creative Commons Attribution Non-Commercial License (http://creativecommons.org/licenses/by-nc/4.0/) which permits unrestricted non-commercial use, distribution, and reproduction in any medium, provided the original work is properly cited.
ABSTRACT
-
Background
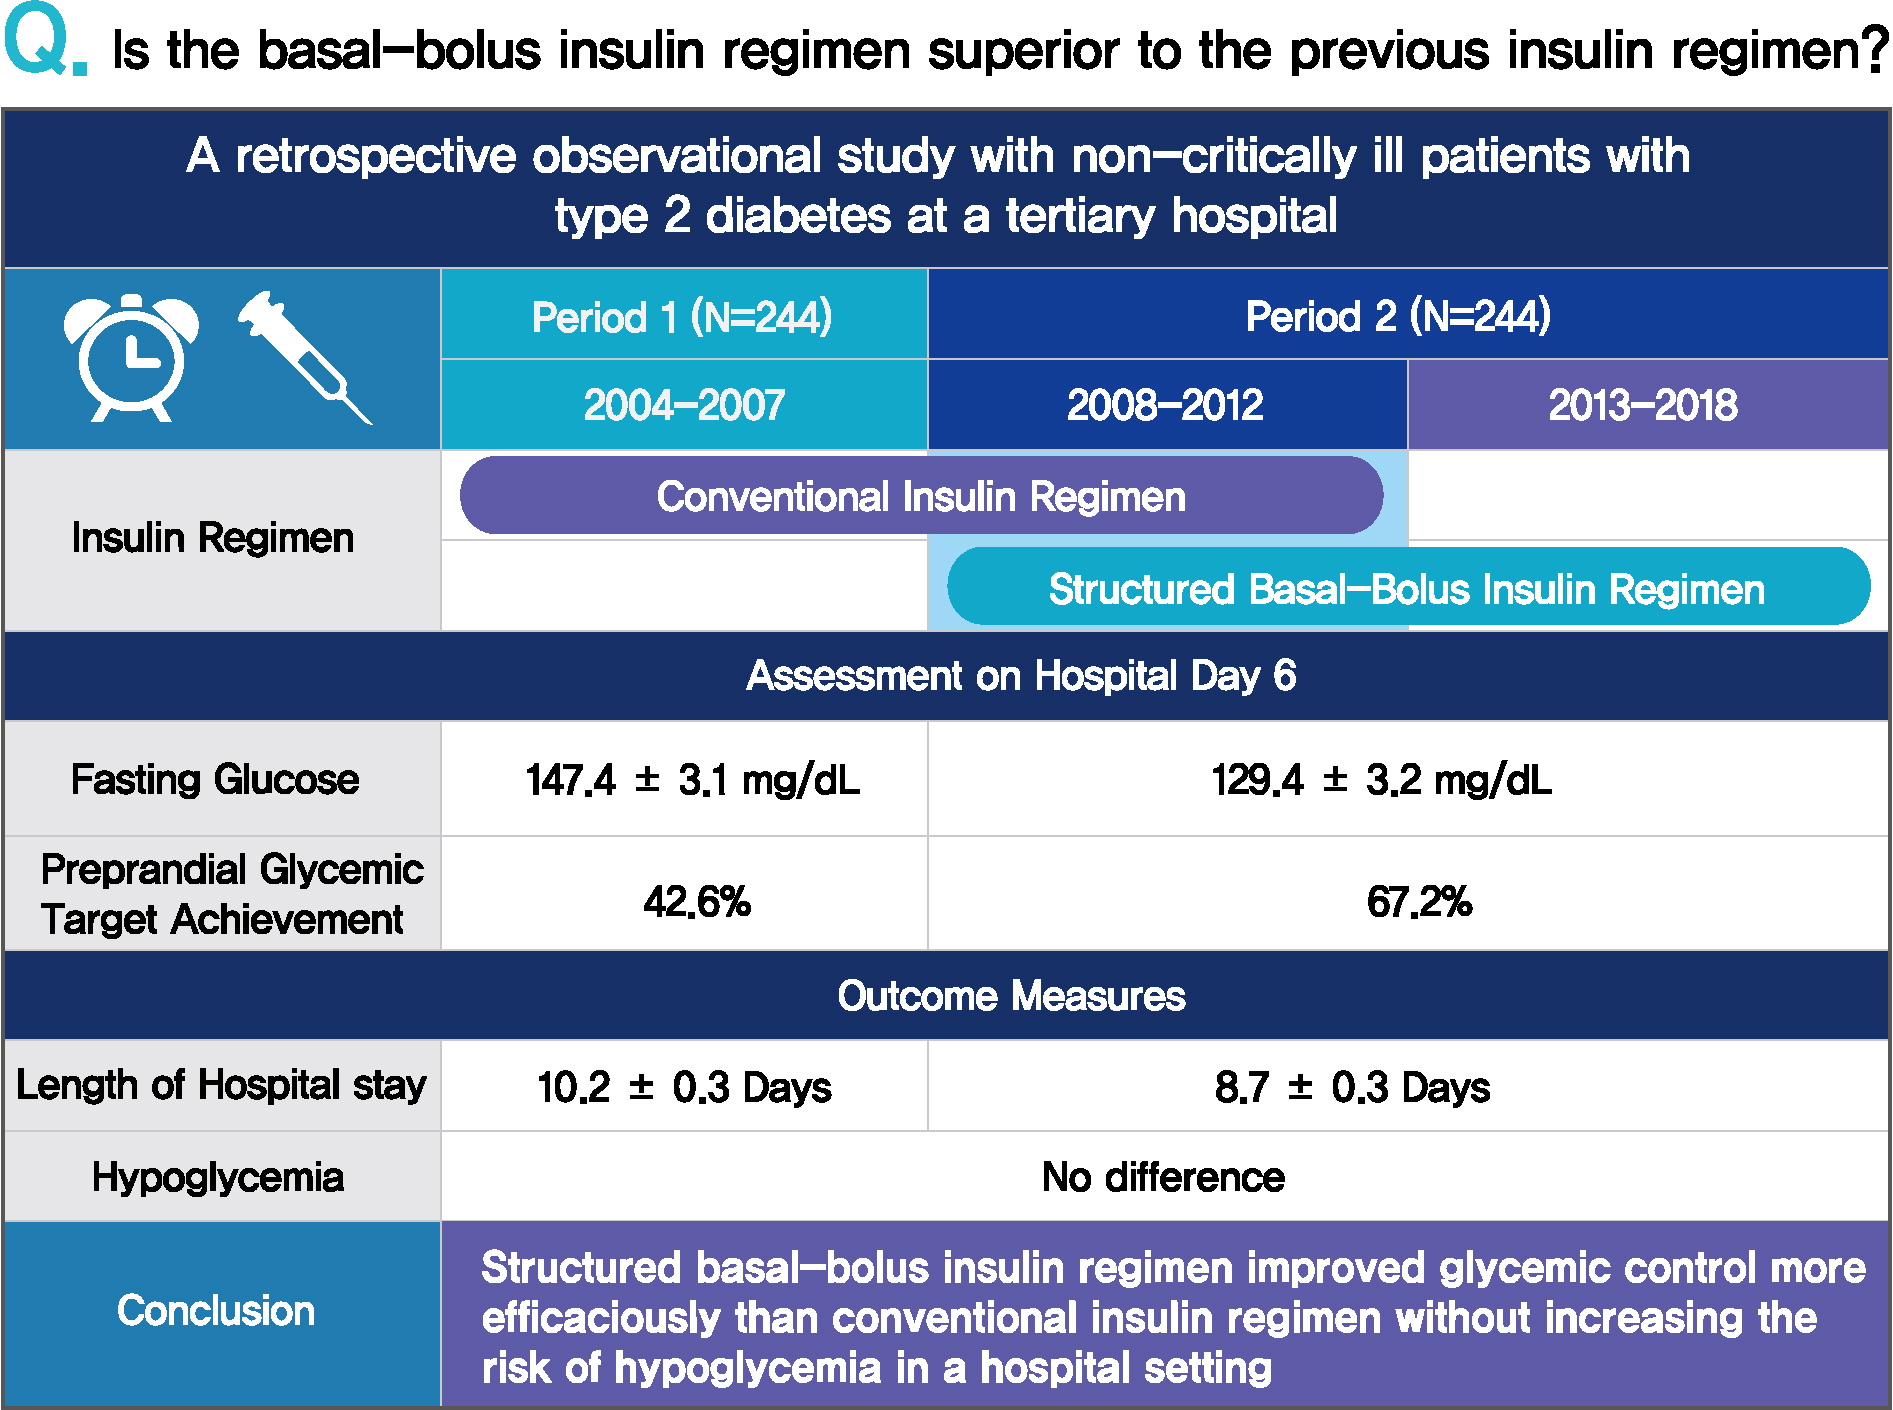
- Prevailing insulin regimens for glycemic control in hospitalized patients have changed over time. We aimed to determine whether the current basal-bolus insulin (BBI) regimen is superior to the previous insulin regimen, mainly comprising split-mixed insulin therapy.
-
Methods
- This was a single tertiary center, retrospective observational study that included non-critically ill patients with type 2 diabetes mellitus who were treated with split-mixed insulin regimens from 2004 to 2007 (period 1) and with BBI from 2008 to 2018 (period 2). Patients from each period were analyzed after propensity score matching. The mean difference in glucose levels and the achievement of fasting and preprandial glycemic targets by day 6 of admission were assessed. The total daily insulin dose, incidence of hypoglycemia, and length of hospital stay were also evaluated.
-
Results
- Among 244 patients from each period, both fasting glucose (estimated mean±standard error, 147.4±3.1 mg/dL vs. 129.4±3.2 mg/dL, P<0.001, day 6) and preprandial glucose (177.7±2.8 mg/dL vs. 152.8±2.8 mg/dL, P<0.001, day 6) were lower in period 2 than in period 1. By day 6 of hospital admission, 42.6% and 67.2% of patients achieved a preprandial glycemic target of <140 mg/dL in periods 1 and 2, respectively (relative risk, 2.00; 95% confidence interval, 1.54 to 2.59), without an increased incidence of hypoglycemia. Length of stay was shorter in period 2 (10.23±0.26 days vs. 8.70±0.26 days, P<0.001).
-
Conclusion
- BBI improved glycemic control in a more efficacious manner than a split-mixed insulin regimen without increasing the risk of hypoglycemia in a hospital setting.
- Diabetes is a pandemic disease, affecting the daily life of 463 million people globally [1]. One out of six hospitalized patients have diabetes, and approximately 30% of hospitalized patients experience hyperglycemic episodes during admission [2]. The presence of hyperglycemia has been closely linked to adverse outcomes in acute critical illness, including acute myocardial infarction, stroke, and coronavirus disease 2019 (COVID-19) [3,4]. In-hospital hyperglycemia is associated with increased morbidity and mortality in critically ill patients admitted to the intensive care unit; however, it has also proven to be an independent risk factor for morbidity and mortality in patients admitted to surgery or general medicine wards [5,6]. In parallel, a J-shaped glycemia-mortality risk curve has been observed [7-10], emphasizing the importance of maintaining blood glucose in an acceptable range to avoid hyperglycemia as well as detrimental hypoglycemia.
- One of the most alluring means of glycemic control in patients admitted to hospital, due to its simplicity, has been the sliding-scale insulin injection (SSI), which entails administering a correctional dose of short- or rapid-acting insulin on detection of hyperglycemia [11]. This approach is destined to result in suboptimal glycemic control as it overlooks anticipated hyperglycemia, necessitating the implementation of a more proactive scheduled insulin protocol [11-15]. The advent of the structured basal-bolus insulin (BBI) algorithm has enabled physicians to overcome the shortcomings of other insulin regimens. The superiority of structured BBI over SSI was proven in the Randomized Study of Basal-Bolus Insulin therapy in the Inpatient Management of Patients with Type 2 Diabetes (RABBIT2) study regarding target blood glucose achievement of <140 mg/dL with no difference in the incidence of hypoglycemia [16].
- Another widely adopted algorithm for glycemic control was the premixed insulin regimen, an example of the split-mixed insulin regimen, especially prevalent in East Asian countries until recently [16-18]. However, despite its potential advantages of convenience, premixed insulin-based treatment can yield maximum benefits only when the fixed ratio of rapid/short-and intermediate-acting insulin accurately reflects the patient’s requirement and patients comply with consistent daily routines regarding meals and physical activity.
- As further real-world evidence has accrued to favor BBI over SSI, the standard insulin regimen for hospitalized patients has gradually shifted from various insulin titration approaches to BBI [19,20]. In our hospital, this transition from split-mixed insulin therapy to BBI commenced in 2007; within BBI regimens, the full adoption of structured BBI from the conventional BBI ensued a few years later.
- Despite the trend to shift to BBI utilizing insulin analogs, the price of insulin inflated over the past two decades in the United States affecting affordability. Consequently, use of less expensive insulin formulations, i.e., human insulin in split-mixed insulin regimen, has recently revived in patients suffering from access to insulin [21]. However, research comparing the split-mixed insulin regimen with BBI has shown conflicting results, even in randomized clinical trials, and relatively limited information regarding their competence is known in real-world, inhospital settings [22-28]. In this study, we aimed to compare the efficacy and safety of the most widely used types of insulin therapy from different periods (i.e., split-mixed insulin therapy and BBI therapy) in a tertiary hospital.
INTRODUCTION
- Subjects
- We conducted a retrospective analysis comparing type 2 diabetes mellitus patients treated with a BBI regimen with those treated with all other insulin regimens at Seoul National University Hospital using clinical data warehouse and electronic medical records. We selected patients admitted to the endocrinology division for glycemic control (Supplementary Fig. 1).
- As soon as the data from the RABBIT2 suggested superiority of the BBI regimen over SSI in September 2007, we commenced implementation of the BBI protocol in our hospital. Therefore, we included 1,608 patients from 2008, considering the transition period for the implementation of this systematized protocol. For comparison, 766 patients who were admitted between October 2004 and August 2007 were selected, and their data were retrieved from the clinical data warehouse: sex, age, height, weight, Chronic Kidney Disease Epidemiology Collaboration estimated glomerular filtration rate (CKD-EPI eGFR), glycated hemoglobin (HbA1c), and the prescribed antidiabetic medications. As regards information on the duration of diabetes, measured glucose levels during hospital stay, and the time and quantity of insulin administration, we reviewed the electronic medical records.
- For both groups, only patients who were treated for more than 5 days were included, as the mean length of hospital stay was longer than 5 days in the RABBIT2 trial. Henceforth, for the sake of simplicity, we assigned subjects who primarily received split-mixed insulin therapy to the “period 1” group and those who received the BBI regimen to the “period 2” group, in chronological order. Within period 2, patients were further divided into conventional BBI and structured BBI subgroups. Briefly, conventional BBI is the traditional approach of adjusting insulin dose as directed by physician, preferably endocrinologist, whereas structured BBI is a stepwise insulin titration based on the adoption of the correction scale proposed by the RABBIT2 protocol [29].
- Assessment of blood glucose levels and insulin doses
- Assessment of glycemic control was based on fasting, preprandial/postprandial, before-bedtime, and nocturnal readings of blood glucose, which was measured using point-of-care (POC) glucometers, with respect to administration of meal and bolus insulin. Specifically, preprandial glycemic values were defined as glucose values obtained nearest to the administration of bolus insulin during the typical mealtime interval and postprandial glycemic values as the initial glucose value measurements 1.5 to 2.5 hours after bolus insulin delivery. If the bolus insulin was not administered, glycemic values were arbitrarily defined as the glucose values obtained in the designated time periods (Supplementary Table 1). Bedtime blood glucose was defined as the first glucose value obtained between 10:00 PM and 11:59 PM and dawn glucose as that between 2:00 AM and 4:00 AM.
- Insulin therapy was also specified according to specific time points as follows: basal insulin was calculated as the sum of the total basal insulin administered during the day, and bolus insulin was defined as preprandial if administered in between the designated time periods (Supplementary Table 1). Bedtime insulin was specified as the bolus insulin administered from 9:00 PM to 1:00 AM and when additional insulin was administered during 1:00 AM and 4:59 AM, we delineated it as dawn insulin.
- Outcome measures
- Glycemic control was assessed based on available measurements of daily recorded POC blood glucose levels during hospitalization. The assessment of POC glucose levels and insulin doses is shown in Supplementary Table 1. There was a discernible difference in the frequency of postprandial blood glucose measurements between the groups, which was less than 0.2 times per day for period 1, whereas at least one glucose level was recorded daily for period 2 (0.14±0.22 vs. 1.50±0.87, P< 0.001 during hospital stay, period 1 and 2, respectively) (Supplementary Table 2). With limited postprandial glucose data available for period 1, further analyses were conducted, mainly focusing on preprandial glucose data.
- The glucose profiles were compared between the periods at each time point for the outcome measures. The mean of day 5 and 6 of hospital admission and that of day 1 and 2 were selected to represent the results of the insulin regimens and the index date, respectively. The rationale behind our discretion was that many patients were admitted late in the evening on the day of admission and were either discharged on day 6 or transferred to other departments, leaving incomplete glycemic data. The mean difference in POC glucose values and time to achieve the preprandial glucose target, which is defined as a value less than 140 mg/dL without hypoglycemia, were compared between the periods. The achievement of both the mean and all preprandial glucose levels was analyzed, where the latter was defined as a scenario in which every preprandial glucose level measured during the day was within the target range. We also assessed the total daily dose of insulin, incidence of hypoglycemia categorized into levels 1 (<70 mg/dL) and 2 (<54 mg/dL), and length of hospital stay in each period. In period 2, an additional comparison was made between the structured and conventional BBI regimens.
- Statistical analyses
- Continuous variables are expressed as mean±standard error, and categorical variables are presented as numbers and percentages. To balance any confounding covariates, 1:1 propensity score matching was conducted. The matched covariates in the propensity score analysis included both dichotomous and continuous variables: sex, age, body mass index (BMI), weight, eGFR, duration of diabetes, and HbA1c. For propensity score matching analysis, patients were 1:1 matched using the nearest neighbor technique with a caliper width of 0.2, and an absolute standard mean difference (SMD) of less than 0.1 was regarded as a cutoff for the optimal matching of each covariate [30]. The independent t-test and chi-square test were used to compare the two groups in an unadjusted analysis. For multivariate analyses, analysis of covariance (ANCOVA) was used for continuous variable outcomes, adjusted for age, sex, BMI, weight, eGFR, duration of diabetes, HbA1c, number of concurrent antidiabetic medications, antidiabetic medication use, and number of POC glucose measurements performed. A multiple linear regression model was used for P in the trend analyses.
- Kaplan-Meier analysis, log-rank tests, and Cox regression analyses were additionally performed to evaluate the extent of glycemic target achievement in both intervention groups, followed by subgroup analyses. The preprandial glycemic target was defined as a blood glucose value less than 140 mg/dL without hypoglycemia. Time-to-event data on preprandial glucose levels was delineated on defining an “event” as the first day to achieve the glycemic target. For multivariate analyses, we used Cox regression analysis, adjusting for the same covariates as those in the ANCOVA analysis. To properly interpret the Cox regression analysis results, we used the term “relative risk (RR)” instead of “hazard ratio.” Subgroup analyses were performed according to age, sex, BMI, eGFR, diabetes duration, and HbA1c level, and the interaction between covariates was also assessed. Differences were considered statistically significant at P values less than 0.05, without correction for multiple testing. All statistical analyses were performed using R software version 4.0.3 (R Foundation for Statistical Computing, Vienna, Austria).
- This study was conducted in accordance with the ethical standards of the Declaration of Helsinki as well as national and international guidelines. Due to a retrospective nature of our study, written informed consent was waived. It was approved by the Institutional Review Board of Seoul National University Hospital (approval number: H-2002-026-1098).
METHODS
- Baseline characteristics
- During period 1 (October 2004 to August 2007) and period 2 (January 2008 to December 2018), 303 and 295 patients met the inclusion criteria, respectively. A matched cohort of 244 patient pairs was assembled using propensity score matching at a ratio of 1:1. The clinical and demographic characteristics of the study population are shown in Table 1. The SMD was less than 0.1 across all variables, except for antidiabetic medications, indicating that the matched variables, namely, age, sex, BMI, eGFR, duration of diabetes, and HbA1c, were well balanced. In both groups, the mean HbA1c level exceeded 10.0%, with a diabetes duration of more than 14 years. Obesity had low prevalence in both groups, with an average BMI of 24.5 kg/m2 in both periods. Various types of rapid- or short-acting insulin were administered predominantly in combination with intermediate-acting insulin in period 1 (Supplementary Table 3).
- Comparison of glycemic control
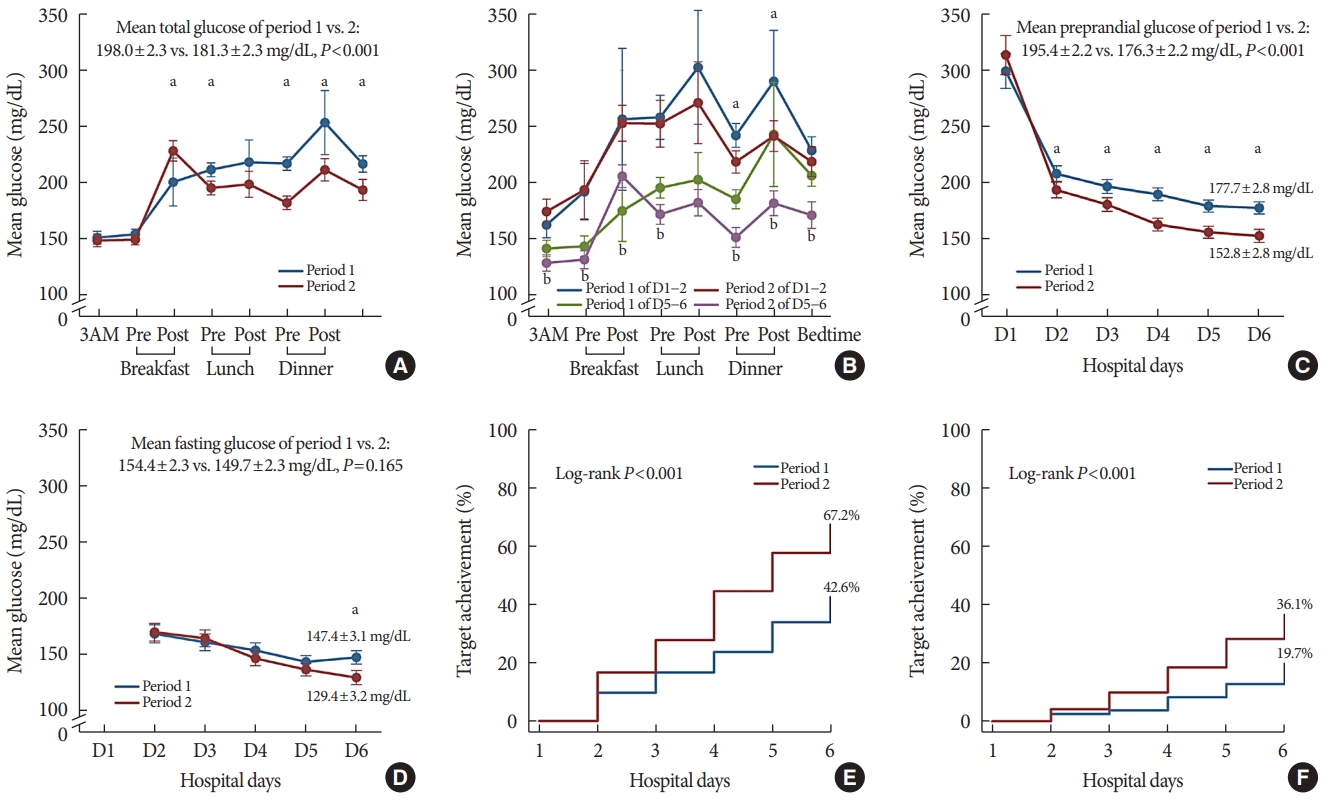
- In general, the average POC glucose value obtained during the initial 6 days of admission was lower in period 2 (198.0±2.3 mg/dL vs. 181.3±2.3 mg/dL, P<0.001) (Supplementary Table 4). The mean dawn and fasting POC glucose values did not vary between the two groups. Mean pre-lunch, pre-dinner, post-dinner, and bedtime glucose levels were lower in period 2; intriguingly, the mean post-breakfast glucose level was significantly lower in period 1 (Fig. 1A). Because glycemic control improved over the hospital days, we analyzed the glycemic data pertaining to days 1–2 and days 5–6 (Fig. 1B). Mean preprandial POC glucose tended to be lower in period 2 on days 1–2 (228.8±3.6 mg/dL vs. 218.5±3.6 mg/dL, P=0.049) but were substantially lower in period 2 on days 5–6 (177.7±2.8 mg/dL vs. 152.8±2.9 mg/dL, P<0.001, period 1 and 2, respectively) (Fig. 1C). By day 6, the mean fasting glucose target for hospitalized patients (<140 mg/dL) [31] was achieved only in period 2 (147.4±3.1 mg/dL vs. 129.4±3.2 mg/dL, P<0.001, period 1 and 2, respectively) (Fig. 1D). On assessing all preprandial glucose levels, the level was lower in period 2 (195.4±2.2 mg/dL vs. 176.3±2.2 mg/dL, P<0.001), and the difference between the two groups was significant from day 2 (mean preprandial glucose at day 2: 208.2±3.6 mg/dL vs. 193.7±3.6 mg/dL, P= 0.005) (Fig. 1C, Supplementary Table 5).
- Glycemic goal achievement and length of hospital stay
- Thereafter, we assessed the rate of achieving the optimal glycemic level in both groups using Kaplan-Meier analysis. By day 6 of hospital admission, 67.2% of patients in period 2 achieved a mean target preprandial glucose level of less than 140 mg/dL without hypoglycemia, whereas only 42.6% of patients in period 1 had their glucose level optimized (log-rank P<0.001) (Fig. 1E). When the event of interest was defined as all measured preprandial (i.e., pre-breakfast, pre-lunch, and pre-dinner) glucose level of less than 140 mg/dL, 36.1% and 19.7% of patients met the endpoint by day 6 in period 2 and 1, respectively (log-rank P<0.001) (Fig. 1F).
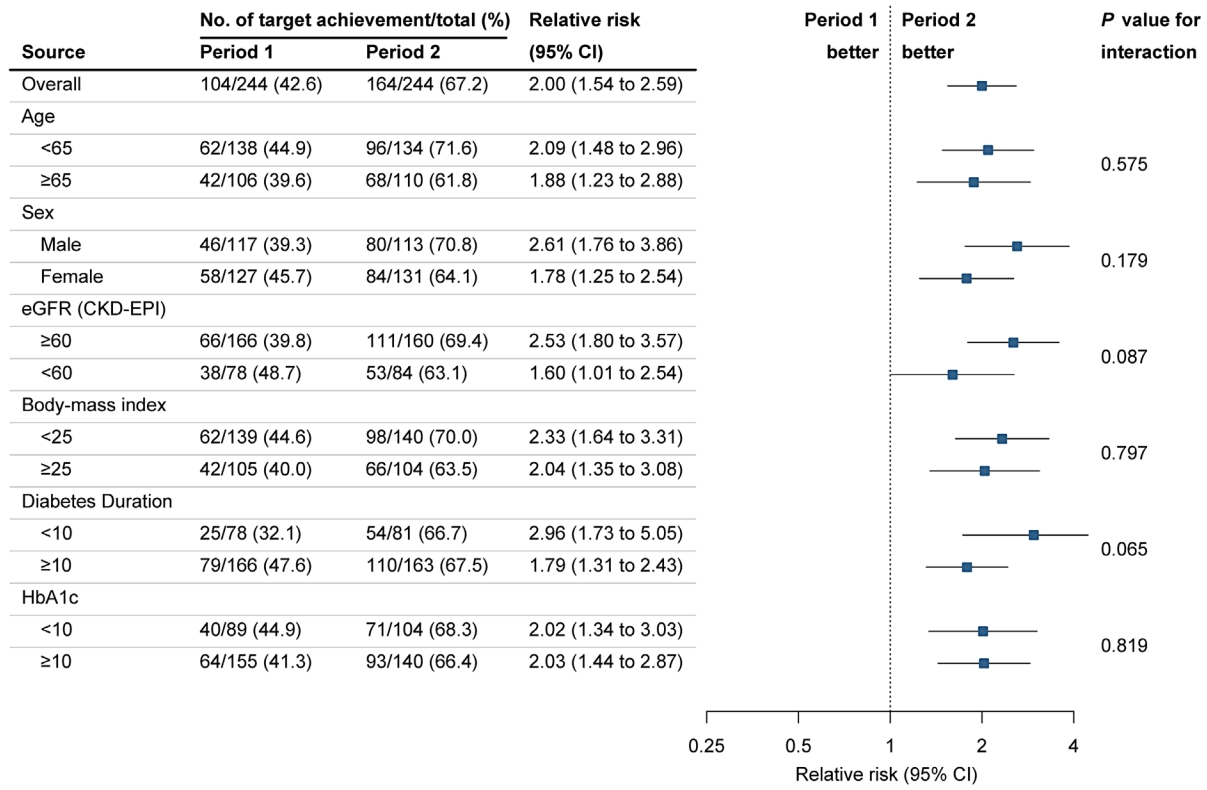
- Even after adjusting for multiple covariates, a significantly greater number of patients in period 2 than that of patients in period 1 achieved the preprandial glycemic target (RR, 2.00; 95% confidence interval [CI], 1.54 to 2.59; and RR, 2.03; 95% CI, 1.41 to 2.93, mean and all preprandial glucose target achievement, respectively) (Fig. 2, Supplementary Fig. 2). We further identified subsets of patients by age, sex, eGFR, BMI, duration of diabetes, and HbA1c. Glycemic control in period 2 was superior to that in period 1, regardless of clinical factors in subgroup analyses (Fig. 2, Supplementary Fig. 2). Accordingly, the length of hospital stay was reduced in period 2 (10.23±0.26 days vs. 8.70±0.26 days, P<0.001, period 1 and 2, respectively) (Table 2).
- Insulin dose and incidence of hypoglycemia
- Overall, the total mean daily dose of insulin was considerably higher in period 2 (P<0.001) (Table 2). Specifically, the requirement of prandial insulin adjusted for body weight was greater in period 2 whereas, on the contrary, the amount of long- or intermediate-acting insulin per day was greater in period 1 (prandial insulin: 0.14±0.01 IU/kg vs. 0.41±0.01 IU/kg, P<0.001; long- or intermediate-acting insulin: 0.43±0.01 IU/kg vs. 0.36±0.01 IU/kg, P<0.001, period 1 and 2, respectively). Despite the difference in the administered insulin dose, the incidence of levels 1 and 2 hypoglycemia was comparable between periods 1 and 2 (Table 2).
- Comparison of conventional BBI with structured BBI
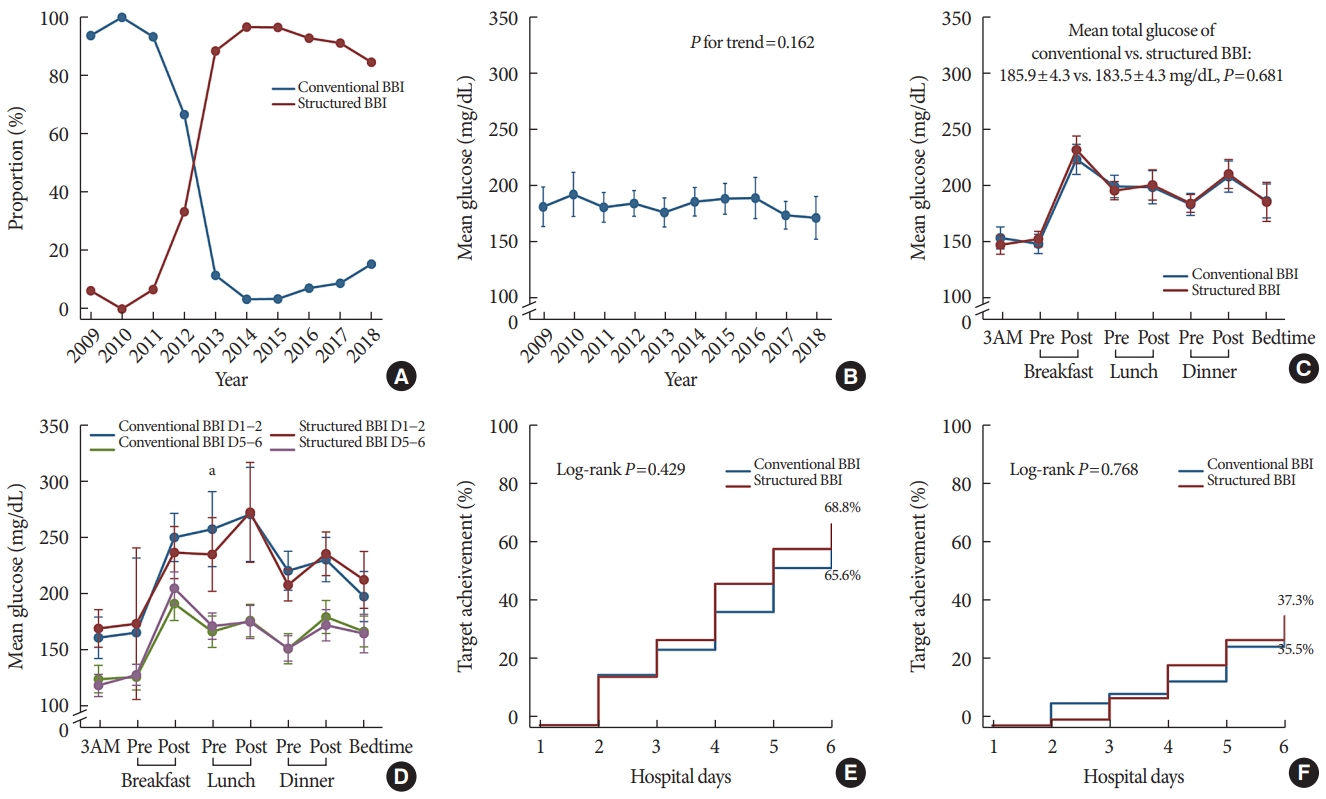
- Since the introduction of the structured BBI in 2008, in-hospital practice has gradually shifted from conventional, expert-led titration to the structured BBI adopting the RABBIT2 protocol. Both regimens were utilized throughout period 2; however, structured BBI prevailed in 2013 (Fig. 3A). We compared patients from period 2 who were treated with either regimen to ascertain whether there was a difference in the efficacy of either regimen.
- Overall, the baseline characteristics of the patients who were treated with conventional BBI and structured BBI were similar (Supplementary Table 6). Despite a shift toward structured BBI, the mean glucose levels remained consistent over the years in period 2 (P for trend=0.162) (Fig. 3B). On average, there was no difference in mean glucose level at any time point or throughout hospital stay (Fig. 3C, D, Supplementary Tables 7 and 8). The achievement rate of mean preprandial glycemic target was slightly higher in patients treated with structured BBI; nonetheless, the difference failed to achieve statistical significance (65.6% vs. 68.8%, log-rank P=0.429, conventional BBI vs. structured BBI, respectively) (Fig. 3E). The trend was maintained when all measured preprandial glucose levels less than 140 mg/dL were assessed to evaluate the achievement rate (35.5% vs. 37.3%, log-rank P=0.768, conventional BBI vs. structured BBI, respectively) (Fig. 3F). Among the BBI regimens, the insulin titration method did not result in any differences in hypoglycemic events or the length of hospital stay (Supplementary Table 9).
RESULTS
- In this propensity score-matched study, hyperglycemia was managed more effectively in period 2 than in period 1, without an increase in hypoglycemic events. By day 5–6, mean preprandial glucose levels were 177.7±2.8 and 152.8±2.8 mg/dL for periods 1 and 2, respectively. Overall, a considerably larger proportion of patients from period 2 achieved the glycemic target, with the odds of patients in period 2 being approximately two times higher than that of patients in period 1 across the subgroups.
- To the best of our knowledge, this study is the first to unequivocally reflect real-world data that demonstrate the efficacy and safety of BBI in routine clinical practice. We have demonstrated that patients treated with BBI, the predominant insulin regimen in period 2, had more optimal glycemic control than those treated with the principal insulin regimens of period 1 in terms of achieving glycemic target. Glycemic control was superior in period 2 at most time points but was reversed at post-breakfast, where period 1 had a lower level. This is because premixed insulin is administered at a fixed ratio, and a relatively higher amount of insulin is administered before breakfast, with the expectation that its effect will last until the next scheduled dose before dinner. This potentially results in substantial glucose reduction during the post-breakfast period, in which the mixture of intermediate- and short/rapid-acting insulin have a concerted peak effect. However, without any preprandial insulin administered before lunch, hyperglycemia in the late afternoon might have been inevitable; hence, the resultant hyperglycemia was not fully reversed and persisted until bedtime.
- In contrast to the previous randomized trial by Bellido et al. [32], the risk of hypoglycemia was very low in both groups and did not increase in period 1. This may be partially associated with the different characteristics of the study populations along with the treatment goals and strategies of physicians in charge. When emphasis is placed on avoiding hypoglycemia, it becomes even more challenging to achieve an optimal glucose target with a less systematized regimen with higher glucose variability. Without a systematic correction scale in the premixed insulin regimen, physicians tend to be relatively passive in frequent glucose monitoring and dose escalation, indisputably leading to therapeutic inertia [33-37]. Accordingly, in period 2, subjects achieved their preprandial target glucose level of <140 mg/dL in a more expeditious manner.
- In controlled settings, BBI is evidently by far the most physiologic means of delivering insulin, simulating insulin response to meals in conjunction with basal insulin secretion; with this regimen, both hyper- and hypoglycemia can be managed safely with the assistance of an experienced endocrinologist or preset insulin titration protocol. However, as diabetes is a chronic health condition where sustainable treatment is fundamental, many physicians prescribe premixed insulin in the outpatient clinic as a feasible alternative, especially in Asian countries [38,39]. When these patients are admitted to hospital, a majority pursue their previous insulin regimens. Consequently, despite the emphasis on providing structured order sets to solicit high quality hospital care in clinical guidelines [31], hyperglycemia in hospitalized patients from many medical centers is often managed in unstructured ways [40], which leaves room for improvement. Intriguingly, the implementation of BBI itself resulted in superior glycemic control regardless of insulin titration strategies; insulin titration guided by an expert endocrinologist in a tertiary hospital was comparable to titration by structured protocol in terms of efficacy and safety. This is consistent with recent studies that also suggested comparable efficacy of various BBI treatment algorithms that are tailored to individual patients [41-45]. However, the retrospective nature of this study could not distinguish the patients who were genuinely treated with conventional BBI from those apparently treated with conventional methods but were in fact performed by resident physicians who were accustomed to the RABBIT2 protocol. Further analysis adopting each BBI method by cluster randomization may more accurately reveal whether the two methods of insulin titration are undoubtedly equivalent [46,47].
- This study has several limitations. First, it was a retrospective study with period 1 and 2 patients selected from different time periods. We endeavored to countervail this by adopting propensity score. However, it could not fully compensate for changes in practice over the years; for example, the classes of oral antidiabetic drugs have changed over the years and more numbers of drugs were concurrently used with insulin in period 2 compared to those in period 1 (Table 1). Thus, we have additionally adjusted for the usage and the number of oral antidiabetic drugs used in performing multivariate analysis. Second, the frequency of POC testing differed between the periods, and it is plausible that hyperglycemic episodes might have gone unnoticed with less rigorous postprandial glucose monitoring in period 1. Thus, in addition to making adjustments for POC glucose testing, we conducted further analyses focusing on preprandial glucose data only. Third, we did not assess long-term clinical outcomes. Therefore, the two periods could not be directly compared in light of sustainability, efficacy, and safety after discharge, as many patients were presumed to have subsequently simplified their insulin regimens. Finally, we only included patients in a non-critical setting. These patients may not be generalizable to the majority of hospitalized patients in a typical tertiary hospital requiring intravenous nutrition, steroid therapy, invasive procedures, and surgery [48-50].
- In conclusion, BBI demonstrated improved glycemic control without an increase in hypoglycemia in comparison with other insulin regimens, mostly consisting of split-mixed insulin therapy. The difference between the mean preprandial blood glucose levels during hospital stay was pronounced, and more subjects treated with BBI achieved target glycemic control regardless of clinical factors. BBI is a safe and efficacious regimen for insulin intensification in a real-world hospital setting.
DISCUSSION
Supplementary Materials
Supplementary Table 1.
Supplementary Table 2.
Supplementary Table 5.
Supplementary Table 7.
Supplementary Table 8.
Supplementary Table 9.
Supplementary Fig. 1.
Supplementary Fig. 2.
-
CONFLICTS OF INTEREST
No potential conflict of interest relevant to this article was reported.
-
AUTHOR CONTRIBUTIONS
Conception or design: S.J.M., H.J.C., Y.M.C.
Acquisition, analysis, or interpretation of data: S.J.M., H.J.C.
Drafting the work or revising: S.J.M., H.J.C., Y.M.C.
Final approval of the manuscript: S.J.M., H.J.C., S.H.K., H.S.J., K.S.P., Y.M.C.
-
FUNDING
Young Min Cho received grants from Sanofi and Daewoong and received consulting fees from LG Chemical. The funders had no role in study design, data collection and analysis, decision to publish, or preparation of the manuscript.
NOTES
-
Acknowledgements
- None


Values are presented as mean±standard error or number (%). Age, sex, BMI, weight, eGFR, diabetes duration, and HbA1c level were 1:1 matched using the nearest neighbor method with a caliper width of 0.2.
SMD, standardized mean difference; BMI, body mass index; CKD-EPI eGFR, Chronic Kidney Disease Epidemiology Collaboration estimated glomerular filtration rate; HbA1c, glycated hemoglobin; DPP4i, dipeptidyl peptidase 4 inhibitor; SGLT2i, sodium-glucose cotransporter 2 inhibitor; GLP-1 RA, glucagon-like peptide-1 receptor agonist.
| Variable |
Estimated means |
Adjusted P value | |
|---|---|---|---|
| Period 1 | Period 2 | ||
| Insulin dosea | |||
| Long/Intermediate acting, IU/kg | 0.43±0.01 | 0.36±0.01 | <0.001 |
| Short/Rapid acting, IU/kg | 0.14±0.01 | 0.41±0.01 | <0.001 |
| Total insulin, IU/kg | 0.57±0.02 | 0.77±0.02 | <0.001 |
| Number of hypoglycemic eventsb | |||
| Level 1 (glucose <70 mg/dL) | 0.37±0.05 | 0.34±0.05 | 0.678 |
| Level 2 (glucose <54 mg/dL) | 0.07±0.02 | 0.05±0.02 | 0.465 |
| Length of hospital stay, day | 10.23±0.26 | 8.70±0.26 | <0.001 |
Values are presented as mean±standard error. Analysis of covariance (ANCOVA) analyses were performed, adjusted for age, sex, body mass index, weight, estimated glomerular filtration rate, diabetes duration, glycated hemoglobin, number of concurrent antidiabetic medications, antidiabetic medication use, and number of blood glucose measurements by point-of-care testing.
a Data from hospital day 2 to 5 were analyzed because the patients did not receive the full dosage on the day of admission, and there was insufficient information for day 6,
b Number of hypoglycemic episodes during hospital stay.
- 1. International Diabetes Federation. IDF diabetes atlas. 9th ed. Brussels: IDF; 2019 [cited 2021 Sep 25]. Available from: www.diabetesatlas.org/en.
- 2. Cook CB, Kongable GL, Potter DJ, Abad VJ, Leija DE, Anderson M. Inpatient glucose control: a glycemic survey of 126 U.S. hospitals. J Hosp Med 2009;4:E7-14.ArticlePDF
- 3. Krinsley JS. Association between hyperglycemia and increased hospital mortality in a heterogeneous population of critically ill patients. Mayo Clin Proc 2003;78:1471-8.ArticlePubMed
- 4. Holman N, Knighton P, Kar P, O’Keefe J, Curley M, Weaver A, et al. Risk factors for COVID-19-related mortality in people with type 1 and type 2 diabetes in England: a population-based cohort study. Lancet Diabetes Endocrinol 2020;8:823-33.ArticlePubMedPMC
- 5. van den Boom W, Schroeder RA, Manning MW, Setji TL, Fiestan GO, Dunson DB. Effect of A1C and glucose on postoperative mortality in noncardiac and cardiac surgeries. Diabetes Care 2018;41:782-8.ArticlePubMedPDF
- 6. Umpierrez GE, Smiley D, Jacobs S, Peng L, Temponi A, Mulligan P, et al. Randomized study of basal-bolus insulin therapy in the inpatient management of patients with type 2 diabetes undergoing general surgery (RABBIT 2 surgery). Diabetes Care 2011;34:256-61.ArticlePubMedPMCPDF
- 7. Bagshaw SM, Egi M, George C, Bellomo R; Australia New Zealand Intensive Care Society Database Management Committee. Early blood glucose control and mortality in critically ill patients in Australia. Crit Care Med 2009;37:463-70.ArticlePubMed
- 8. Kosiborod M, Rathore SS, Inzucchi SE, Masoudi FA, Wang Y, Havranek EP, et al. Admission glucose and mortality in elderly patients hospitalized with acute myocardial infarction: implications for patients with and without recognized diabetes. Circulation 2005;111:3078-86.ArticlePubMed
- 9. Kosiborod M, Inzucchi SE, Krumholz HM, Xiao L, Jones PG, Fiske S, et al. Glucometrics in patients hospitalized with acute myocardial infarction: defining the optimal outcomes-based measure of risk. Circulation 2008;117:1018-27.ArticlePubMed
- 10. NICE-SUGAR Study Investigators, Finfer S, Chittock DR, Su SY, Blair D, Foster D, et al. Intensive versus conventional glucose control in critically ill patients. N Engl J Med 2009;360:1283-97.ArticlePubMed
- 11. Queale WS, Seidler AJ, Brancati FL. Glycemic control and sliding scale insulin use in medical inpatients with diabetes mellitus. Arch Intern Med 1997;157:545-52.ArticlePubMed
- 12. Browning LA, Dumo P. Sliding-scale insulin: an antiquated approach to glycemic control in hospitalized patients. Am J Health Syst Pharm 2004;61:1611-4.ArticlePubMed
- 13. Hirsch IB. Sliding scale insulin: time to stop sliding. JAMA 2009;301:213-4.ArticlePubMed
- 14. Golightly LK, Jones MA, Hamamura DH, Stolpman NM, McDermott MT. Management of diabetes mellitus in hospitalized patients: efficiency and effectiveness of sliding-scale insulin therapy. Pharmacotherapy 2006;26:1421-32.ArticlePubMed
- 15. Umpierrez GE, Palacio A, Smiley D. Sliding scale insulin use: myth or insanity? Am J Med 2007;120:563-7.ArticlePubMed
- 16. Sheu WH, Ji L, Lee WJ, Jabbar A, Han JH, Lew T. Efficacy and safety of premixed insulin analogs in Asian patients with type 2 diabetes: a systematic review. J Diabetes Investig 2017;8:518-34.ArticlePubMedPMCPDF
- 17. Ji LN, Lu JM, Guo XH, Yang WY, Weng JP, Jia WP, et al. Glycemic control among patients in China with type 2 diabetes mellitus receiving oral drugs or injectables. BMC Public Health 2013;13:602.ArticlePubMedPMCPDF
- 18. Freemantle N, Balkau B, Danchin N, Wang E, Marre M, Vespasiani G, et al. Factors influencing initial choice of insulin therapy in a large international non-interventional study of people with type 2 diabetes. Diabetes Obes Metab 2012;14:901-9.ArticlePubMedPMCPDF
- 19. Roberts GW, Aguilar-Loza N, Esterman A, Burt MG, Stranks SN. Basal-bolus insulin versus sliding-scale insulin for inpatient glycaemic control: a clinical practice comparison. Med J Aust 2012;196:266-9.ArticlePubMedPDF
- 20. Zaman Huri H, Permalu V, Vethakkan SR. Sliding-scale versus basal-bolus insulin in the management of severe or acute hyperglycemia in type 2 diabetes patients: a retrospective study. PLoS One 2014;9:e106505.ArticlePubMedPMC
- 21. Cefalu WT, Dawes DE, Gavlak G, Goldman D, Herman WH, Van Nuys K, et al. Insulin Access and Affordability Working Group: conclusions and recommendations. Diabetes Care 2018;41:1299-311.ArticlePubMedPDF
- 22. Hirao K, Arai K, Yamauchi M, Takagi H, Kobayashi M; Japan Diabetes Clinical Data Management Study Group. Six-month multicentric, open-label, randomized trial of twice-daily injections of biphasic insulin aspart 30 versus multiple daily injections of insulin aspart in Japanese type 2 diabetic patients (JDDM 11). Diabetes Res Clin Pract 2008;79:171-6.ArticlePubMed
- 23. Jeong IK, Chung CH, Zhou Z, Han JH, Duan R, Edralin DM, et al. Comparison of insulin intensification strategies with insulin lispro low mixture twice daily versus basal insulin glargine and prandial insulin lispro once daily in East Asian and Caucasian patients with type 2 diabetes mellitus. J Diabetes 2017;9:396-404.PubMed
- 24. Ji L, Min KW, Oliveira J, Lew T, Duan R. Comparison of efficacy and safety of two starting insulin regimens in non-Asian, Asian Indian, and East Asian patients with type 2 diabetes: a post hoc analysis of the PARADIGM study. Diabetes Metab Syndr Obes 2016;9:243-9.PubMedPMC
- 25. Masuda H, Sakamoto M, Irie J, Kitaoka A, Shiono K, Inoue G, et al. Comparison of twice-daily injections of biphasic insulin lispro and basal-bolus therapy: glycaemic control and quality-of-life of insulin-naïve type 2 diabetic patients. Diabetes Obes Metab 2008;10:1261-5.ArticlePubMed
- 26. Jin SM, Kim JH, Min KW, Lee JH, Ahn KJ, Park JH, et al. Basalprandial versus premixed insulin in patients with type 2 diabetes requiring insulin intensification after basal insulin optimization: a 24-week randomized non-inferiority trial. J Diabetes 2016;8:405-13.ArticlePubMed
- 27. Jia W, Xiao X, Ji Q, Ahn KJ, Chuang LM, Bao Y, et al. Comparison of thrice-daily premixed insulin (insulin lispro premix) with basal-bolus (insulin glargine once-daily plus thrice-daily prandial insulin lispro) therapy in east Asian patients with type 2 diabetes insufficiently controlled with twice-daily premixed insulin: an open-label, randomised, controlled trial. Lancet Diabetes Endocrinol 2015;3:254-62.ArticlePubMed
- 28. Anyanwagu U, Mamza J, Gordon J, Donnelly R, Idris I. Premixed vs basal-bolus insulin regimen in Type 2 diabetes: comparison of clinical outcomes from randomized controlled trials and real-world data. Diabet Med 2017;34:1728-36.ArticlePubMedPDF
- 29. Umpierrez GE, Smiley D, Zisman A, Prieto LM, Palacio A, Ceron M, et al. Randomized study of basal-bolus insulin therapy in the inpatient management of patients with type 2 diabetes (RABBIT 2 trial). Diabetes Care 2007;30:2181-6.ArticlePubMedPDF
- 30. Austin PC. Optimal caliper widths for propensity-score matching when estimating differences in means and differences in proportions in observational studies. Pharm Stat 2011;10:150-61.ArticlePubMedPMCPDF
- 31. American Diabetes Association. 15. Diabetes care in the hospital: standards of medical care in diabetes-2021. Diabetes Care 2021;44(Suppl 1):S211-20.ArticlePubMedPDF
- 32. Bellido V, Suarez L, Rodriguez MG, Sanchez C, Dieguez M, Riestra M, et al. Comparison of basal-bolus and premixed insulin regimens in hospitalized patients with type 2 diabetes. Diabetes Care 2015;38:2211-6.ArticlePubMedPMCPDF
- 33. Alvarenga MA, Komatsu WR, de Sa JR, Chacra AR, Dib SA. Clinical inertia on insulin treatment intensification in type 2 diabetes mellitus patients of a tertiary public diabetes center with limited pharmacologic armamentarium from an upper-middle income country. Diabetol Metab Syndr 2018;10:77.ArticlePubMedPMCPDF
- 34. Lovshin JA, Zinman B. Diabetes: clinical inertia: a barrier to effective management of T2DM. Nat Rev Endocrinol 2013;9:635-6.ArticlePubMedPDF
- 35. Blak BT, Smith HT, Hards M, Curtis BH, Ivanyi T. Optimization of insulin therapy in patients with type 2 diabetes mellitus: beyond basal insulin. Diabet Med 2012;29:e13-20.ArticlePubMedPDF
- 36. Holt RI. Insulin initiation in type 2 diabetes: the implications of the 4-T study. Diabet Med 2010;27:1-3.Article
- 37. Liebl A. Insulin intensification: the rationale and the target. Int J Clin Pract Suppl 2009;164:1-5.Article
- 38. Cho YM. To mix or to separate: that is the question. Lancet Diabetes Endocrinol 2015;3:229-31.ArticlePubMed
- 39. Kalra S, Balhara YP, Sahay BK, Ganapathy B, Das AK. Why is premixed insulin the preferred insulin?: novel answers to a decade-old question. J Assoc Physicians India 2013;61(1 Suppl):9-11.
- 40. Wilson M, Weinreb J, Hoo GW. Intensive insulin therapy in critical care: a review of 12 protocols. Diabetes Care 2007;30:1005-11.PubMed
- 41. Zhang X, Zhang T, Xiang G, Wang W, Li Y, Du T, et al. Comparison of weight-based insulin titration (WIT) and glucose-based insulin titration using basal-bolus algorithm in hospitalized patients with type 2 diabetes: a multicenter, randomized, clinical study. BMJ Open Diabetes Res Care 2020;8:e001261.ArticlePubMedPMC
- 42. Wexler DJ, Shrader P, Burns SM, Cagliero E. Effectiveness of a computerized insulin order template in general medical inpatients with type 2 diabetes: a cluster randomized trial. Diabetes Care 2010;33:2181-3.PubMedPMC
- 43. Aloi J, Bode BW, Ullal J, Chidester P, McFarland RS, Bedingfield AE, et al. Comparison of an electronic glycemic management system versus provider-managed subcutaneous basal bolus insulin therapy in the hospital setting. J Diabetes Sci Technol 2017;11:12-6.ArticlePubMedPMCPDF
- 44. Li X, Du T, Li W, Zhang T, Liu H, Xiong Y. Efficacy and safety of weight-based insulin glargine dose titration regimen compared with glucose level- and current dose-based regimens in hospitalized patients with type 2 diabetes: a randomized, controlled study. Clin Ther 2014;36:1269-75.ArticlePubMed
- 45. Davis S, Friece C, Roderman N, Newcomer D, Castaneda E. Comparison of insulin detemir and insulin glargine for hospitalized patients on a basal-bolus protocol. Pharmacy (Basel) 2017;5:22.ArticlePubMedPMC
- 46. Lorenz E, Kopke S, Pfaff H, Blettner M. Cluster-randomized studies. Dtsch Arztebl Int 2018;115:163-8.ArticlePubMedPMC
- 47. Campbell MK, Mollison J, Steen N, Grimshaw JM, Eccles M. Analysis of cluster randomized trials in primary care: a practical approach. Fam Pract 2000;17:192-6.ArticlePubMed
- 48. Wang C, Mamza J, Idris I. Biphasic vs basal bolus insulin regimen in type 2 diabetes: a systematic review and meta-analysis of randomized controlled trials. Diabet Med 2015;32:585-94.ArticlePubMed
- 49. Perez A, Reales P, Barahona MJ, Romero MG, Minambres I; HOSMIDIA Study Group. Efficacy and feasibility of basal-bolus insulin regimens and a discharge-strategy in hospitalised patients with type 2 diabetes: the HOSMIDIA study. Int J Clin Pract 2014;68:1264-71.ArticlePubMedPDF
- 50. Akhtar ST, Mahmood K, Naqvi IH, Vaswani AS. Inpatient management of type 2 diabetes mellitus: does choice of insulin regimen really matter? Pak J Med Sci 2014;30:895-8.PubMedPMC
 PubReader
 ePub Link
 Cite
Cite