
- Current
- Browse
- Collections
-
For contributors
- For Authors
- Instructions to authors
- Article processing charge
- e-submission
- For Reviewers
- Instructions for reviewers
- How to become a reviewer
- Best reviewers
- For Readers
- Readership
- Subscription
- Permission guidelines
- About
- Editorial policy
Articles
- Page Path
- HOME > Diabetes Metab J > Volume 46(2); 2022 > Article
-
Original ArticleCardiovascular Risk/Epidemiology Performance of Diabetes and Kidney Disease Screening Scores in Contemporary United States and Korean Populations
-
Liela Meng1
 , Keun-Sang Kwon2, Dae Jung Kim3, Yong-ho Lee4, Jeehyoung Kim5, Abhijit V. Kshirsagar6, Heejung Bang7,8
 -
Diabetes & Metabolism Journal 2022;46(2):273-285.
DOI: https://doi.org/10.4093/dmj.2021.0054
Published online: September 9, 2021
1Graduate Group of Biostatistics, Department of Statistics, University of California, Davis, CA, USA
2Department of Preventive Medicine, Jeonbuk National University Medical School, Jeonju, Korea
3Department of Endocrinology and Metabolism, Ajou University School of Medicine, Suwon, Korea
4Department of Internal Medicine, Yonsei University College of Medicine, Seoul, Korea
5Department of Orthopedic Surgery, Seoul Sacred Heart General Hospital, Seoul, Korea
6University of North Carolina Kidney Center & Division of Nephrology and Hypertension, School of Medicine, University of North Carolina, Chapel Hill, NC, USA
7Division of Biostatistics, Department of Public Health Sciences, University of California, Davis, CA, USA
8Clinical and Translational Science Center & Center for Healthcare Policy and Research, Davis School of Medicine, University of California, Sacramento, CA, USA
-
Corresponding author: Liela Meng Department of Statistics, University of California, One Shields Ave, Med-Sci 1C, Davis, CA 95616, USA E-mail: mzcmeng@ucdavis.edu
Copyright © 2022 Korean Diabetes Association
This is an Open Access article distributed under the terms of the Creative Commons Attribution Non-Commercial License (http://creativecommons.org/licenses/by-nc/4.0/) which permits unrestricted non-commercial use, distribution, and reproduction in any medium, provided the original work is properly cited.
ABSTRACT
-
Background
- Risk assessment tools have been actively studied, and they summarize key predictors with relative weights/importance for a disease. Currently, standardized screening scores for type 2 diabetes mellitus (DM) and chronic kidney disease (CKD)—two key global health problems—are available in United States and Korea. We aimed to compare and evaluate screening scores for DM (or combined with prediabetes) and CKD, and assess the risk in contemporary United States and Korean populations.
-
Methods
- Four (2×2) models were evaluated in the United States-National Health and Nutrition Examination Survey (NHANES 2015–2018) and Korea-NHANES (2016–2018)—8,928 and 16,209 adults. Weighted statistics were used to describe population characteristics. We used logistic regression for predictors in the models to assess associations with study outcomes (undiagnosed DM and CKD) and diagnostic measures for temporal and cross-validation.
-
Results
- Korean adult population (mean age 47.5 years) appeared to be healthier than United States counterpart, in terms of DM and CKD risks and associated factors, with exceptions of undiagnosed DM, prediabetes and prehypertension. Models performed well in own country and external populations regarding predictor-outcome association and discrimination. Risk tests (high vs. low) showed area under the curve >0.75, sensitivity >84%, specificity >45%, positive predictive value >8%, and negative predictive value >99%. Discrimination was better for DM, compared to the combined outcome of DM and prediabetes, and excellent for CKD due to age.
-
Conclusion
- Four easy-to-use screening scores for DM and CKD are well-validated in contemporary United States and Korean populations. Prevention of DM and CKD may serve as first-step in public health, with these self-assessment tools as basic tools to help health education and disparity.
- • Screening scores for Diabetes & Chronic Kidney Disease are available in USA & Korea.
- • These scores performed well in contemporary national samples (vs. original samples).
- • Korean adults tend to have lower cardiovascular risk than American adults.
- • Korea is not a "safe" zone for prehypertension, prediabetes & undiagnosed diabetes.
- • Screening scores could be useful tools for self-assessment and health education.
Highlights
- Prediction models and risk assessment tools have been a clinical research focus for a few decades, with some promising news, but not without controversy or skepticism [1-4]. Their value remains uncertain such that they are used infrequently in practice. Although screening or prediction of many medical conditions can benefit public health, early identification of individuals at risk for type 2 diabetes mellitus (DM) and chronic kidney disease (CKD) is important for two reasons [5,6]. First, these conditions may be undiagnosed, challenging the need to screen for current or future events in individuals with or free of asymptomatic or occult disease. Second, both conditions are increasingly prevalent in many regions and closely-related or inter-dependent (with several shared risk factors and underlying mechanisms), with significant global health implications for itself as well as based on their associations with other comorbidities including cardiovascular disease (CVD) [7]. Currently, some models are widely available in research community and public domain, and provide health education via self-assessment of disease risk using a short checklist of simple questions (excluding lab data or difficult medical terms), with broad endorsement from the medical community [8-10].
- In this study, we aimed to compare and validate ‘four screening tools’ to help identify undiagnosed DM (alone or with preDM) and CKD being used in the United States and Korea. The original models were developed using data from up to two decades ago [11-15] with some adaptations over years. Therefore, we evaluated the currently used models/questionnaires using the most recent national survey data collected from the two countries, with comprehensive statistical measures; let us call 2×2×2 (two medical conditions by two countries’ models by two countries’ populations/datasets) temporal and cross-validation and comparison—we focused on associational measure (via regression fit) and diagnostic performance (high vs. low risk based on the risk test). As a secondary aim, we aimed to compare these two countries’ population health in terms of DM and CKD and the related factors, which also coincide with CVD risk factors. Our study is timely as DM and CKD (and their associated risk factors) are suggested as key medical conditions among patients with coronavirus disease 2019 (COVID-19) [16], and diverging performance in COVID control has been contrasted between United States and Korea [17,18]. During the COVID-19 crisis, the California Department of Public Health (CDPH) recommends the “prediabetes quiz (taking <1 minute)” in connection with COVID-19 on the internet, TV and highway billboards, and used the prediabetes screening score to be described below [19-21]. Finally, we sought to address a criticism regarding widely-promoted web-based risk tests and “medicalization” of pre-DM [8,22,23].
INTRODUCTION
- Populations, data sources, models, and variable definitions
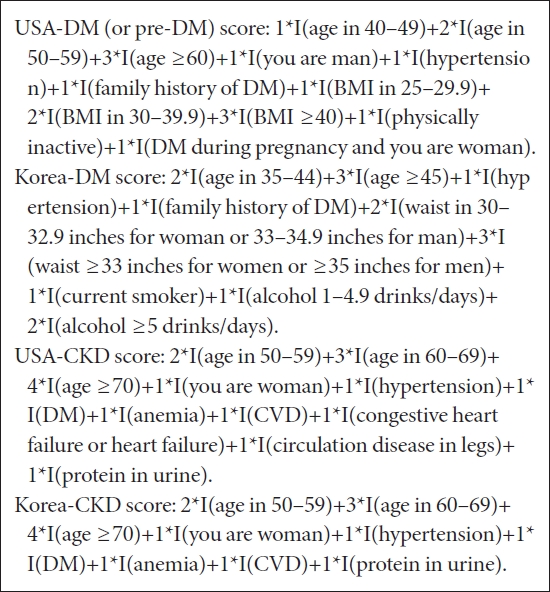
- We evaluated and compared DM and CKD screening scores used in United States for health education and disease surveillance at the American Diabetes Association (ADA), American Medical Association (AMA), and/or Centers for Disease Control and Prevention (CDC), among other authorities/agencies [8-10,19,24-26], and the Korean counterparts. Particularly, the CDC started to use DM and CKD screening scores from 2019 on their websites [9,10]. The four models were originally developed/derived from nationally representative health surveys, the National Health and Nutrition Examination Survey (NHANES) and Korea National Health and Nutrition Examination Survey (KNHANES) from 1999 to 2009; the final presentation of questionnaires and scoring algorithms are reasonably comparable and standardized, consisting of integer score (maximum score of 12). Predictors include demographics (age, gender), family and personal medical history (e.g., DM, hypertension, CVD), obesity measures (body mass index [BMI], waist circumference), and lifestyle variables (physical activity, smoking, alcohol). See the scoring algorithms in Box below; original models can be found in original publications [11-13,15,27], and original and adapted/tailored versions of models and questionnaires have been used in practice. Those in the box are the most widely used versions in practice [8-10,19,21].
- For the United States study, we used NHANES 2015–2016 and 2017–2018, and for the Korean counterpart, we used KNHANES 2016, 2017, and 2018. The study population was adults ≥19 years old. For the DM study, individuals with known DM were excluded, and those with known kidney failure/disease were excluded for the CKD study, as our study outcome was ‘undiagnosed’ cases, where ‘known’ means already diagnosed so participant knew the disease status at the time of survey. In practice, unlike DM, awareness of CKD is very low, so using a questionnaire to ascertain CKD will lead to significant underestimation of the population with CKD. Thus, it is possible that individuals with known CKD were included in our CKD analysis due to limited information collected. We addressed this issue in sensitivity analysis by treating persons with estimated glomerular filtration rate (eGFR) <15 or <30 mL/min/1.73 m2 as a surrogate for CKD known to patients but not queried or captured in survey.
- We also considered the combined outcome of DM and pre-DM because it has been reported that early detection of pre-DM may play a major role in disease reversal or delay [24,28-30]. Of note, the same scoring algorithm has been justified for undiagnosed DM alone, or DM and pre-DM together, employing same or different cutpoints to define at-risk groups in practice [10,12,19,31]. Currently, United States uses the same risk score for DM and pre-DM [10,19,24].
- Outcome measures were based on current clinical practice guidelines in United States and Korea: briefly speaking, glucose (with/without fasting), glycosylated hemoglobin (HbA1c), and 2h-oral glucose tolerance test (OGTT) for DM and pre-DM; and eGFR based on Chronic Kidney Disease Epidemiology Collaboration (CKD-EPI) standards for both United States and Korean studies. Korean version of CKD-EPI was used as sensitivity analysis. For other variables, we also used widely accepted definitions used in clinical practice and previous research [5,24,32-35]. Of note, KNHANES did not collect data on gestational DM, anemia treatment, (congestive) heart failure, and OGTT, and both surveys did not collect data on peripheral artery or vascular disease (phrased ‘circulation disease in legs’ in the questionnaire), unlike older versions of NHANES. Of note, NHANES collected self-reported weight and height and obesity status (normal vs. overweight) but we did not use these variables in our primary analyses. See Appendix 1 for variable definitions.
- Statistical analyses
- We used descriptive statistics to summarize nationally representative samples based on complex survey designs: mean±standard error for continuous variables and percent for categorical variables. To represent the entire country’s adult population and compute national health statistics (e.g., mean age, prevalence of medical condition), design features—weights (i.e., interview, medical exam and fasting subsample weights for multiple years, as appropriate), clusters, and strata—were accounted for. We followed the NHANES and KNHANES analyses guidelines as well as previous publications [11,13,31]. In the descriptive and inferential health statistics (presented in Table 1), known cases of DM and CKD were not excluded in order to represent the entire adult population in the nation. In the remaining screening score or risk test-related analyses where undiagnosed case is the outcome of interest, known cases were excluded.
- First, we fitted the four risk score models in the originally intended populations for temporal validation, i.e., United States models in the United States sample and Korean models in the Korean sample. Next, we performed cross-validation, i.e., United States models in the Korean sample, and Korean models in the United States sample, previously described as a ‘2×2×2 approach.’ Multiple logistic regression was used to estimate odds ratio (OR), 95% confidence interval (CI), and P value for each predictor and outcome, along with area under the receiver operating characteristic (ROC) curve (AUC). For diagnostic performance, we computed percent (%) of participants who scored high (≥5 for DM and ≥4 for CKD), sensitivity, specificity, positive predictive value (PPV), negative predictive value (NPV), likelihood ratio positive/negative (LR+/–), Youden index, and AUC, along with ROC curve and calibration plot.
- Sensitivity analyses were conducted for checking the robustness of the primary analysis results to adaptations/modifications that have been or could be considered in practice; that is, subgroup analyses based on demographics, under different data availability, with different weighting, or variations in outcome definition, and AUCs were reported as a key prediction summary measure. When findings were inconsistent or counterintuitive, we sought to provide scientific explanation(s) of the underlying mechanism. Of note, when we evaluated regression models and the final risk test (high vs. low score), final results were qualitatively similar in weighted and unweighted analyses, especially, third decimal point changed in AUC. SAS version 9.4 (SAS Institute Inc., Cary, NC, USA) was used for data analyses.
- Ethics approval
- The University of California Institutional Review Board (IRB) determined that IRB review is not required because the research is based on publicly available, de-identified data (IRB ID: 1653151-1). Written informed consent by the patients was waived due to the use of publicly available data in our study.
- Data availability
- Original data are publicly available by CDC and Korea CDC. The analysis datasets used are available from the first and last authors upon request.
METHODS
- Characteristics and general health status of American and Korean adults
- The NHANES includes 11,000 adults in the United States and KNHANES includes 18,560 adults in Korea. Table 1 presents the characteristics of the adult population of similar mean ages, approximately 47.5 years old. The United States population demonstrated 12.1% of known DM and 3.2% of known CKD; the corresponding estimates for the Korean population were 7.7% and <0.5%, respectively. It is noteworthy, but not surprising, that obesity distributions were markedly different, although prevalence of DM and pre-DM (based on lab tests) was similar in the two countries. This offers more evidence toward postulated differences between Western versus Asian populations in terms of DM etiology, particularly, in genetics, BMI cutpoints, different obesity measures, and lifestyles [28,36-39]. Prevalence of hypertension (but not prehypertension), CVD, CKD, and family history of DM were higher in United States. Interestingly, the prevalence of physical activity and smoking (as binary variables) and mean hemoglobin (14.2 g/dL) were very similar in the two countries. Difference in alcohol consumption may be attributed to varying approaches to phrasing of queries and information collected/available or cultural differences. Among outcomes-related variables, the mean of HbA1C was 5.6% to 5.7%; prevalence of DM based on lab tests was 10% to 11% (where approximately 20 and 34% of total DM cases were newly diagnosed in the United States and Korea, respectively), and prevalence of pre-DM was 32% to 34% in the two countries. In contrast, 6.8% of the United States population and approximately 2.8% of the Korean population had eGFR<60 mL/min/1.73 m2.
- Risk model fits in newest survey data in the United States and Korea: model performance
- Overall, logistic regression showed direction, magnitude, and statistical significance of associations (assessed by OR, CI, and P value), qualitatively consistent with the original model developments. Although DM, the most important risk factor along with hypertension, was not statistically significant for CKD (which may seem counterintuitive), it may be explained by a statistical phenomenon called ‘multicollinearity’; in simple/unadjusted logistic regression, DM yielded OR, 2.95 (P<0.001) and was correlated with hypertension and proteinuria. Different directions in the relationship between alcohol consumption and DM in the United States versus Korea are interesting, although a protective effect of light or moderate alcohol use in DM risk prediction has been reported [40], which might further reflect differences and difficulty in measuring/quantifying consumption and/or lifestyle factors that could be region- or population-specific. AUC was 0.75 for the USA-DM model in the United States population and 0.77 for the K-DM model in the Korean population. AUC was higher for the CKD counterparts (0.89 for USA and 0.91 for Korea), where high AUCs, even higher than the values reported in the original model developments, are partly due to very strong age effect. These results are summarized in Tables 2 and 3, and Supplementary Fig. 1.
- Calibration based on observed versus predicted probabilities was satisfactory, showing a similar pattern in the two countries for the same disease. For DM, these probabilities ranged from 0% to 15% based on deciles, with slight overestimation in the highest risk group (for the 10th decile, 15% predicted vs. 13% observed), and for CKD, >50% of the participants were classified as low risk, with <5% of both predicted and observed probabilities, reflecting low risk in young age group (Supplementary Fig. 2).
- Diagnostic performance of the risk tests
- Diagnostic characteristics, using cutpoints for the high risk group, in the four models showed sensitivity 84%–96%, specificity 45%–65%, PPV 8%–16%, and NPV >99% in temporal validation. Some of these values were even higher in some external populations, i.e., cross-validation, but overall summary prediction/discrimination measure, AUC, was robust; e.g., lowest AUC 0.71 when the K-DM model was fitted to the United States population. With regard to regression model fits in addition to diagnostic measures, KNHANES consistently showed better discrimination (higher AUC) in all four models, which we did not expect. For example, the USA-DM model provided better discrimination in KNHANES than NHANES (AUC=0.78 vs. 0.75), likely offering extra-support toward external validity or transportability of the model or randomness. Discrimination was harder when DM/pre-DM are combined, compared to DM alone, since pre-DM is a middle group in risk spectrum. Uniformly attenuated regression coefficients but in the same direction for the composite outcome of DM/pre-DM seem to justify the same risk test/questionnaire for both conditions of the same kind, which reflects the current usage in practice. Temporal- and cross-validation results along with regression model fits for DM, DM/pre-DM combined, and CKD are presented in Table 4, and Supplementary Tables 1-4. PPV >50% for DM/pre-DM means that 1 out of 2 who scored high (≥5) is likely to have DM or pre-DM that is newly identified, suggesting a reasonable yield for pre-screening/self-risk assessment, where it is well known that PPV is a function of disease prevalence.
- Sensitivity analyses
- Supplementary Table 3 summarizes sensitivity analyses and their impact on discrimination. AUCs were quite robust in different settings, when samples were unweighted versus weighted; predictors were assessed via questionnaires only versus supplemented/informed by physical examinations; and for different genders and races. The older age group (≥60 years old) showed lowest AUC for DM, which may imply limited value or usefulness of these screening scores in this subgroup, as previously pointed out [8]. Interestingly, women and Koreans showed uniformly higher AUCs, which may deserve future investigation and elucidation. In one extreme scenario, omitting unmodifiable demographic factors and family history demonstrated AUCs >0.7. Lowest AUC (=0.60) for CKD in Koreans who were <40 years old might reflect a uniformly low risk in this subgroup. Results were robust to somewhat different outcome definitions employed in practice—for instance, glucose alone vs. HbA1c alone for DM; original United States CKD-EPI vs. Korean version of CKD-EPI vs. older Modification of Diet in Renal Disease (MDRD) equations for CKD [5,33]. Finally, prediction equations are provided in Supplementary Table 4 to calculate (updated) probability estimates for interested users or calculators.
RESULTS
- Models of various complexity are increasingly available for DM and CKD; yet, few have examined their performance with extensive temporal and external validations. As our primary aim, we evaluated and compared the performance of the relatively widely available DM and CKD screening or risk models in the contemporary United States and Korean populations. Overall, discrimination and risk factor-outcome associations remained stable, with reasonably consistent findings between the original, old data used for model developments versus most recent data available. Minor variations were noted as follows: AUC was somewhat lower in the current validation (0.75) versus original publication (0.79) for the USA-DM model, and the corresponding values were 0.73 to 0.77 for the K-DM model; AUC was also higher in the current validation of the USA-CKD and K-CKD models (0.83–0.88 to 0.89–0.91). In contrast, cross-validation provided somewhat intriguing results. The United States models showed better discrimination in the Korean population, which may reflect random variation and/or strong external validity. To compare, prediction models for DM developed from another CDC dataset and machine learning techniques; for example, with 27 variables from >138,000 participants, showed AUC=0.72–0.79 [41]. Also, risk for female gender in CKD scores was attenuated in our study (e.g., weaker statistical significance or reversed direction), and this is partly explained by the eGFR formula used (MDRD, CKD-EPI, or Korean CKD-EPI). As such, “female” in the CKD score in both countries may be optional.
- According to currently available risk tests, 30% to 60% of respondents may be classified as being at high risk of DM or CKD [8,10,19,24]. This may cause a legitimate concern that overestimating people at risk can create false alarm or challenge the utility. Depending on perceived burden or available resources, different cutpoints (say, 4, 5, 6) may be justified; indeed, adaptations/modifications in questionnaire design (e.g., translation, cultural adaptation or substitution of Asian BMI table) and different cutpoints for high risk designation in the DM and CKD risk scores have been suggested and incorporated [10,12,19,24,25,39,42]. Further, some groups may be more accepting and responsive to tests that are tailored to their population; we generally do not recommend the K-DM model for the United States population or the USA-DM model for the Korean population despite good numerical performance. We assert that the two countries can or should adopt different obesity measures and criteria, and should try to identify lifestyle and culturally appropriate risk or protective factors (physical activity, alcohol consumption, smoking—possibly gender-specific and how to capture/measure). For instance, Korea currently does not follow the United States revised guidelines on blood pressure thresholds in order to avoid over-classifying people as high risk (with possible over-treatment) and communicational challenge with the public, based on limited evidence among Asians (comprising 1% to 2% of the entire sample studied) [33,43]. Moreover, we should emphasize ‘modifiable’ or ‘controllable’ factors in most predictions; as an example, a very high AUC is not always ideal for prediction, especially when driven by deterministic factors—whether unmodifiable (e.g., age, family history, genetics) or a surrogate, imminent marker or early onset (e.g., elevated glucose or creatinine) —which may be better suited for diagnostics, instead of meaningful prediction [44,45].
- As our secondary aim, we estimated and compared the prevalence of DM and CKD (and distribution of raw variables) along with well-known and validated risk factors. As expected, there were differences in the prevalence of some factors such as obesity, but some others—especially, prehypertension, pre-DM, and HbA1c level—were comparable in the two countries. Moreover, undiagnosed DM and proteinuria were more prevalent among Koreans (with different definitions/tests used for proteinuria). Thus, Korea is not a “safe zone” for hypertension and diabetes despite a relatively healthy national profile, excellent health care access, service and longevity [17,46].
- As the tertiary aim, we considered potential adverse effects from the use of widely endorsed and available risk tests and possible medicalization of pre-DM [8]. It is true that a substantial proportion of individuals are designated as high risk (e.g., over 50% having a high score, 42% having prehypertension, and 34% having pre-DM), which may create unnecessary alarm that can lead to loss of trust or wasted medical resources. A possible (small and limited) solution may be to institute a higher cutoff (e.g., 6 instead of 5) or a priority or closer monitoring given to a subgroup with a higher level of HbA1c or glucose within pre-DM designation, as the range might be broad and monotonicity in risk is apparent [34,47]. Such adaptive measures may be wiser than abandoning risk tests totally or mechanical adoption.
- Indeed, it has taken a long time to educate the general public regarding CVD and its associated risk factors, such as high blood pressure and cholesterol, partly through the Framingham risk score, a landmark risk model; yet many lay persons remain unfamiliar with key biomarkers such as HbA1c, creatinine, BMI, various obesity measures, or original/revised risk score itself. Recently, we may be seeing a momentum or progress in DM and CKD health education in many countries. These (standardized) screening tools have potential to promote disease awareness, health education, and possible risk reduction globally. Although risk assessment or prediction of CVD and cancer risk are equally important, this generally requires lab testing or complex information that may exceed a layman’s medical understanding. The easy-to-use DM and CKD risk assessment tools may improve accessibility and dissemination of solidly validated, widely relevant health-related information to the general public, and may help reduce health disparity gaps—the two goals of “Healthy People 2030.”
- Limitations of our study should be noted. First, unavailability and lack of standardization of some variables or tests across countries may explain some inconclusive findings, as summarized in variable definitions in the Appendix 1. For example, the role of alcohol use on DM was not further elucidated; however, this can be a common occurrence when we combine disparate studies or heterogenous populations/datasets, yet may also be viewed valuable as it reflects real-world scenarios. Second, our investigation on temporal and cross-validation was based on the same types of survey data over >10 years apart; thus, good performance must be partly due to similarities in study design, and high internal consistency and high data quality from the two developed countries [17]. Diverse real-world settings (e.g., community, hospital, resource-poor) or special contexts (e.g., human immunodeficiency virus patients or other continents) may provide less ideal results [48].
- Additionally, the following points are mentioned for consideration in similar line of research (e.g., based on cross-sectional survey data), not as limitations of this particular study. Causal or directional relationships (e.g., CKD to/from anemia) cannot be drawn from our study, which focused strictly on associations or correlations for cross-sectional events—DM and CKD present but unknown. Causation is not needed for screening and prediction, but the relevance, interpretability and meaningfulness of the models could improve user acceptance [45]. Also, risk score or self-assessment (especially, with low specificity and PPV) cannot replace professional medical advice and should remain a secondary or tertiary, or pre-screening or educational tool, with proper warnings to accompany any use. Because the outcome/cases in this study are “prevalent” events identified in a cross-sectional manner, risk in our study is technically odds or probability/prevalence. This approach is necessary in screening when the goal is to identify individuals with prevalent but currently undiagnosed disease. We have compared a version of the USA-CKD screening score to point of care urine and blood tests to identify individuals with CKD [49].
- The main strengths of our study are large, nationally representative, contemporary multi-country data with key variables available (or reasonable proxies) for two prolific medical conditions. To that end, we were able to study similarities and differences between the two countries, representing different environments, with high statistical power. To our knowledge, this is the first study to attempt temporal- and cross-validation of the United States and Asian prediction/screening models.
- In conclusion, our study supports high internal and external validity of the DM and CKD risk scores widely disseminated in United States and Korea and beyond, adding to the body of existing independent validation efforts. Perhaps our study provides support for country-specific models for DM, which is a trend in related research. These four models may be safely used as a supporting tool (online, pencil and paper, health fair) in a variety of different settings including those with limited resources, with possible adaptation or improvement. Despite active development and promotion by researchers (including machine learning and artificial intelligence-based models), the real impact of risk scores and prediction models are infrequently studied or reported. Wise use and appropriate adaptation or revision of currently available and effective models, as ADA/CDC/AMA/CDPH did for DM and pre-DM [8], aka ‘join forces’ for a similar goal, may be preferable to developing even more (similar, different, or confusing) models with minor improvements [1,2,4]. Risk assessment tools can be an essential component of patient-centeredness and communication and shared decision-making between clinicians and patients/families [50]. Rigorous assessment and reporting of value and potential harm should continue to garner patients’ and providers’ trust in research, to evaluate the real impact of the risk prediction tools on public and personal health, and to serve as a good example in translational research.
DISCUSSION
Supplementary Materials
Supplementary Table 1.
Supplementary Table 2.
Supplementary Table 3.
Supplementary Fig. 1.
Supplementary Fig. 2.
-
CONFLICTS OF INTEREST
No potential conflict of interest relevant to this article was reported.
-
AUTHOR CONTRIBUTIONS
Conception or design: L.M., H.B.
Acquisition, analysis, or interpretation of data: L.M., K.S.K., J.K., H.B.
Drafting the work or revising: K.S.K., D.J.K., Y.L., J.K., A.V.K.
Final approval of the manuscript: L.M., K.S.K., D.J.K., Y.L., J.K., A.V.K., H.B.
-
FUNDING
Heejung Bang is partly supported by the National Institutes of Health through grant UL1 TR001860. The funding source had no role in the study design or implementation.
NOTES
-
Acknowledgements
- The authors thank Caron Modeas, Evolved Editing, LLC, for English editing, and Dr. J David Spence for useful advice and comments. The authors also thank valuable resources publicly provided by US CDC as well as Korea CDC.
| Characteristic | US population in NHANES (n=11,000)a | Korean population in KNHANES (n=18,560)a | |
|---|---|---|---|
| Age, yr | 47.7±0.39 | 47.3±0.24 | |
| Women, % | 51.8 | 50.2 | |
| BMI, kg/m2 | 29.6±0.18 | 24.0±0.04 | |
| BMI/obesity status (based on USA/Asian criteria) | |||
| BMI <25/BMI <23 kg/m2 | 28.5/17.3 | 65.0/42.6 | |
| 25≤ BMI <30/23≤ BMI <27.5 kg/m2 | 31.0/27.0 | 29.3/42.8 | |
| 30≤ BMI <40/27.5≤ BMI <35 kg/m2 | 32.3/36.9 | 5.5/13.7 | |
| BMI ≥40/BMI ≥35 kg/m2 | 8.2/18.8 | 0.1/0.8 | |
| Waist (women/men), inches | 38.7±0.23/40.4±0.21 | 30.9±0.06/33.9±0.05 | |
| Hypertension, % | 38.7 | 28.6 | |
| Prehypertension, % | 42.8 | 41.6 | |
| SBP/DBP, mm Hg | 123.7±0.32/71.2±0.37 | 117.7±0.19/75.8±0.12 | |
| Family history of DM, % | 42.0 | 23.3 | |
| Known DM, % | 12.1 | 7.7 | |
| Known kidney disease (kidney weak, failure, or dialysis), % | 3.2 | 0.26/0.06–0.21b | |
| Physically inactive, % | 58.3 | 57.0 | |
| Gestational diabetes (among women), % | 6.6 | Unavailable | |
| Current smoker, % | 24.1 | 21.4 | |
| Alcohol, light or moderate/heavy, % | 46.9/26.3c | 34.2/16.7c | |
| Anemia treatment, % | 3.8 | Unavailable | |
| Hemoglobin, g/dL | 14.2±0.04 | 14.2±0.02 | |
| Cardiovascular disease, % | 7.4 | 3.6 | |
| (Congestive) heart failure, % | 2.3 | Unavailable | |
| Proteinuria, % | 9.9 | 12.7 | |
| Outcomes-related | |||
| Fasting glucose (at least 8 hours), mg/dL | 109.6±0.61 | 99.8±0.23 | |
| Hemoglobin HbA1c, % | 5.7±0.02 | 5.6±0.01 | |
| 2-hour glucose, mg/dL | 117.1±1.28c | Unavailable | |
| DM (based on lab tests), % | 11.0 | 10.0 | |
| Pre-DM (based on lab tests), % | 31.5 | 34.3 | |
| Undiagnosed DM (no. of newly diagnosed DM/no. of total DM), % | 20.1 | 34.1 | |
| Creatinine, mg/dL | 0.87±0.005 | 0.83±0.002 | |
| eGFR, mL/min/1.73 m2 | 94.9±0.58 | 97.8±0.23/98.9±0.23d | |
| eGFR <60 mL/min/1.73 m2, % | 6.8 | 2.7/2.9d | |
Values are presented as mean±standard error.
NHANES, National Health and Nutrition Examination Survey; KNHANES, Korea National Health and Nutrition Examination Survey; BMI, body mass index; SBP, systolic blood pressure; DBP, diastolic blood pressure; HbA1c, glycosylated hemoglobin; DM, diabetes mellitus; eGFR, estimated glomerular filtration rate.
a Before excluding known/already diagnosed DM and chronic kidney disease (CKD) cases. Sample sizes (number) are unweighted, while other summary statistics are weighted (following NHANES/KNHANES analysis guidelines),
b Left/right values are because weak kidney was not asked/when we included eGFR <15 to <30 mL/min/1.73 m2 (note that creatinine was missing among 707 participants in KNHANES),
c Due to different assessments, % may not be comparable in the two countries,
d Left/right values are when USA/Korean Chronic Kidney Disease Epidemiology Collaboration (CKD-EPI) formulas were used. See Appendix 1 for variable definitions.
|
USA-DM score in NHANES (428 DM cases, n=8,928; AUC=0.753) |
K-DM score in KNHANES (791 DM cases, n=16,209; AUC=0.766) |
||||
|---|---|---|---|---|---|
| Predictor (assigned score) | OR (95% CI) | P valueb | Predictor (assigned score) | OR (95% CI) | P value |
| Age, yr | Age, yr | ||||
| 40–49 (1) | 2.68 (1.83–3.93) | <0.001 | 35–44 (2) | 3.07 (2.00–4.71) | <0.001 |
| 50–59 (2) | 4.65 (3.25–6.64) | <0.001 | ≥45 (3) | 5.27 (3.54–7.84) | <0.001 |
| ≥60 (3) | 4.96 (3.52–6.99) | <0.001 | c | ||
| Male (1) | 1.29 (1.05–1.58) | 0.012 | c | ||
| Hypertension (1) | 1.49 (1.20–1.86) | <0.001 | Hypertension (1) | 2.03 (1.74–2.38) | <0.001 |
| Family DM (1) | 1.29 (1.06–1.58) | 0.013 | Family DM (1) | 1.83 (1.55–2.15) | <0.001 |
| BMI, kg/m2 | Waist, inches | ||||
| 25–29.9 (1) | 1.23 (0.90–1.69) | 0.194 | 30–32.9/33–34.9 (F/M) (2) | 1.77 (1.40–2.23) | <0.001 |
| 30–39.9 (2) | 2.65 (1.99–3.53) | <0.001 | ≥33/35 (F/M) (3) | 3.84 (3.13–4.72) | <0.001 |
| ≥40 (3) | 3.83 (2.63–5.59) | <0.001 | c | ||
| Physically inactive (1) | 1.36 (1.09–1.69) | 0.006 | Current smoker (1) | 1.43 (1.18–1.73) | <0.001 |
| Gestational DM, women only (1) | 2.46 (1.53–3.95) | <0.001 | Alcohol, drinks/day | ||
| Light or moderate, 1–4.9 (1) | 0.92 (0.77–1.11) | 0.387 | |||
| Heavy, ≥5 (2) | 1.17 (0.95–1.44) | 0.137 | |||
DM, diabetes mellitus; NHANES, National Health and Nutrition Examination Survey; AUC, area under the receiver operating characteristic (ROC) curve; KNHANES, Korea National Health and Nutrition Examination Survey; OR, odds ratio; CI, confidence interval; BMI, body mass index.
a NHANES 2015–2018 and KNHANES 2016–2018 among adults (≥19 year old) were used. For DM, known DM were excluded. Prediction equations are in Supplementary Table 4,
b P value is calculated with chi-square test,
c Empty cells are due to different questions included in different questionnaires.
|
USA-CKD score in NHANES (664 CKD cases, n=9,890; AUC=0.893) |
K-CKD score in KNHANES (653 CKD cases, n=17,803; AUC=0.912) |
||||
|---|---|---|---|---|---|
| Predictor (assigned score) | OR (95% CI) | P value | Predictor (assigned score) | OR (95% CI) | P value |
| Age, yr | Age, yr | ||||
| 50–59 (2) | 5.54 (3.10–9.90) | <0.001 | 50–59 (2) | 5.41 (2.79–10.5) | <0.001 |
| 60–69 (3) | 20.3 (12.1–34.0) | <0.001 | 60–69 (3) | 17.1 (9.31–31.2) | <0.001 |
| ≥70 (4) | 73.3 (44.3–121) | <0.001 | ≥70 (4) | 59.9 (33.2–108) | <0.001 |
| Female (1) | 1.19 (0.99–1.42) | 0.065 | Female (1) | 0.74 (0.62–0.88) | <0.001b |
| Hypertension (1) | 1.50 (1.21–1.87) | <0.001 | Hypertension (1) | 2.24 (1.81–2.76) | <0.001 |
| DM (1) | 1.12 (0.92–1.35) | 0.264c | DM (1) | 2.00 (1.67–2.39) | <0.001 |
| Anemia (1) | 2.04 (1.48–2.81) | <0.001 | Anemia (1) | 4.09 (3.36–4.99) | <0.001 |
| CVD (1) | 1.54 (1.23–1.92) | <0.001 | CVD (1) | 1.36 (1.07–1.73) | 0.011 |
| CHF or HF (1) | 1.65 (1.20–2.27) | 0.002 | d | ||
| PAD (1) | Unavailable | d | |||
| Proteinuria (1) | 1.89 (1.54–2.33) | <0.001 | Proteinuria (1) | 2.32 (1.88–2.85) | <0.001 |
CKD, chronic kidney disease; NHANES, National Health and Nutrition Examination Survey; AUC, area under the receiver operating characteristic (ROC) curve; KNHANES, Korea National Health and Nutrition Examination Survey; OR, odds ratio; CI, confidence interval; DM, diabetes mellitus; CVD, cardiovascular disease; CHF, congestive heart failure; HF, heart failure; PAD, peripheral artery disease (or circulation problems in legs in the questionnaire).
a NHANES 2015–2018 and KNHANES 2016–2018 among adults (≥19 year old) were used. For CKD, known kidney failure/disease were excluded. Prediction equations are in Supplementary Table 4,
b When Korean Chronic Kidney Disease Epidemiology Collaboration (CKD-EPI) was used, there were 697 CKD cases, and “female” showed OR, 1.10 (95% CI, 0.93 to 1.31; P=0.27 and AUC=0.907),
c Is due to multicollinearity; DM showed unadjusted OR, 2.95 (95% CI, 2.50 to 3.48; P<0.001), and OR, 1.23 (95% CI, 1.02 to 1.48; P=0.029) when proteinuria was excluded. For DM, total DM (i.e., diagnosed and undiagnosed together) was used. When only known/diagnosed DM was used, results did not change materially; beta coefficient was slightly attenuated but AUC was unchanged (i.e., second or third decimal point change),
d Empty cells are due to different questions included in different questionnaires.
| Model, population | % of high score | Se | Sp | PPV | NPV | LR+ | LR– | Youden | AUC | |
|---|---|---|---|---|---|---|---|---|---|---|
| Outcome: undiagnosed DM (cutpoint ≥5 for high risk) | ||||||||||
| USA-DM score, in NHANES | 48 | 84 | 53 | 8 | 99 | 1.79 | 0.30 | 37 | 0.75 | |
| USA-DM score, in KNHANES | 31 | 67 | 70 | 10 | 98 | 2.23 | 0.47 | 37 | 0.78 | |
| K-DM score, in KNHANES | 57 | 89 | 45 | 8 | 99 | 1.62 | 0.24 | 34 | 0.77 | |
| K-DM score, in NHANES | 72 | 93 | 29 | 6 | 99 | 1.31 | 0.24 | 22 | 0.71 | |
| USA-DM score for DM/pre-DM, in NHANESb | 49 | 70 | 66 | 59 | 76 | 2.06 | 0.45 | 36 | 0.73 | |
| USA-DM score for DM/pre-DM, in KNHANESb | 31 | 48 | 82 | 68 | 67 | 2.67 | 0.63 | 30 | 0.75 | |
| Outcome: undiagnosed CKD (cutpoint ≥4 for high risk) | ||||||||||
| USA-CKD score, in NHANES | 39 | 94 | 65 | 16 | 99 | 2.69 | 0.09 | 59 | 0.89 | |
| USA-CKD score, in KNHANES | 38 | 96 | 64 | 9 | 100 | 2.67 | 0.06 | 60 | 0.91 | |
| K-CKD score, in KNHANES | 38 | 96 | 64 | 9 | 100 | 2.67 | 0.06 | 60 | 0.91 | |
| K-CKD score, in NHANES | 39 | 94 | 65 | 16 | 99 | 2.69 | 0.09 | 59 | 0.89 | |
DM, diabetes mellitus; CKD, chronic kidney disease; Se, sensitivity; Sp, specificity; PPV, positive predictive value; NPV, negative predictive value; LR+, likelihood ratio positive; LR–, likelihood ratio negative; AUC, area under the ROC curve; NHANES, National Health and Nutrition Examination Survey; KNHANES, Korea National Health and Nutrition Examination Survey.
a NHANES 2015–2018 and KNHANES 2016–2018 data among adults (≥19 year old) were used. For DM (and DM/pre-DM), known DM were excluded. For CKD, known kidney failure or disease were excluded,
b 3,767 had DM/pre-DM among 8,743 in NHANES and 7,144 had DM/pre-DM among 16,148 in KNHANES. Of note, denominators are slightly reduced due to the fact that persons with unknown DM/pre-DM status were excluded.
- 1. Liao L, Mark DB. Clinical prediction models: are we building better mousetraps? J Am Coll Cardiol 2003;42:851-3.PubMed
- 2. Adibi A, Sadatsafavi M, Ioannidis JP. Validation and utility testing of clinical prediction models: time to change the approach. JAMA 2020;324:235-6.ArticlePubMed
- 3. Dawes RM, Faust D, Meehl PE. Clinical versus actuarial judgment. Science 1989;243:1668-74.ArticlePubMed
- 4. Wyatt JC, Altman DG. Prognostic models: clinically useful or quickly forgotten? BMJ 1995;311:1539.ArticlePMC
- 5. Chin HJ, Kim S. Chronic kidney disease in Korea. Korean J Med 2009;76:511-4.
- 6. Kim BY, Won JC, Lee JH, Kim HS, Park JH, Ha KH, et al. Diabetes fact sheets in Korea, 2018: an appraisal of current status. Diabetes Metab J 2019;43:487-94.ArticlePubMedPMCPDF
- 7. International Diabetes Federation: Diabetes and the kidneys. Available from: https://idf.org/our-activities/care-prevention/diabetes-and-the-kidney.html (cited 2021 Aug 6).
- 8. Shahraz S, Pittas AG, Kent DM. Prediabetes risk in adult Americans according to a risk test. JAMA Intern Med 2016;176:1861-3.ArticlePubMed
- 9. Centers for Disease Control and Prevention: Chronic Kidney Disease (CKD) Surveillance System. CKD Risk Calculators. Available from: https://nccd.cdc.gov/ckd/Calculators.aspx (cited 2021 Aug 6).
- 10. Centers for Disease Control and Prevention: Could you have prediabetes? Available from: https://www.cdc.gov/prediabetes/takethetest (cited 2021 Aug 6).
- 11. Lee YH, Bang H, Kim HC, Kim HM, Park SW, Kim DJ. A simple screening score for diabetes for the Korean population: development, validation, and comparison with other scores. Diabetes Care 2012;35:1723-30.PubMedPMC
- 12. Bang H, Edwards AM, Bomback AS, Ballantyne CM, Brillon D, Callahan MA, et al. Development and validation of a patient self-assessment score for diabetes risk. Ann Intern Med 2009;151:775-83.ArticlePubMedPMC
- 13. Kwon KS, Bang H, Bomback AS, Koh DH, Yum JH, Lee JH, et al. A simple prediction score for kidney disease in the Korean population. Nephrology (Carlton) 2012;17:278-84.ArticlePubMed
- 14. Echouffo-Tcheugui JB, Kengne AP. Risk models to predict chronic kidney disease and its progression: a systematic review. PLoS Med 2012;9:e1001344.ArticlePubMedPMC
- 15. Bang H, Vupputuri S, Shoham DA, Klemmer PJ, Falk RJ, Mazumdar M, et al. SCreening for Occult REnal Disease (SCORED): a simple prediction model for chronic kidney disease. Arch Intern Med 2007;167:374-81.ArticlePubMed
- 16. Centers for Disease Control and Prevention: People with certain medical conditions. Available from: https://www.cdc.gov/coronavirus/2019-ncov/need-extra-precautions/people-with-medical-conditions.html (cited 2021 Sep 2).
- 17. Solano JJ, Maki DG, Adirim TA, Shih RD, Hennekens CH. Public health strategies contain and mitigate COVID-19: a tale of two democracies. Am J Med 2020;133:1365-6.ArticlePubMedPMC
- 18. You J. Lessons from South Korea’s COVID-19 policy response. Am Rev Public Adm 2020;50:801-8.ArticlePDF
- 19. American Diabetes Association: Do I have prediabetes? Available from: https://doihaveprediabetes.org/take-the-risk-test (cited 2021 Aug 6).
- 20. Ali MK, McKeever Bullard K, Imperatore G, Benoit SR, Rolka DB, Albright AL, et al. Reach and use of diabetes prevention services in the United States, 2016-2017. JAMA Netw Open 2019;2:e193160.ArticlePubMedPMC
- 21. YouTube: Take the prediabetes risk test: type 2 diabetes prevention. Available from: https://www.youtube.com/watch?v=s020q-FE0H4 (cited 2021 Aug 6).
- 22. Redberg RF. The medicalization of common conditions. JAMA Intern Med 2016;176:1863.ArticlePMC
- 23. Piller C. Dubious diagnosis. Science 2019;363:1026-31.ArticlePubMed
- 24. American Diabetes Association. Standards of medical care in diabetes: 2021. Diabetes Care 2021;44(Suppl 1):1-225.PubMed
- 25. Asgari S, Lotfaliany M, Fahimfar N, Hadaegh F, Azizi F, Khalili D. The external validity and performance of the no-laboratory American Diabetes Association screening tool for identifying undiagnosed type 2 diabetes among the Iranian population. Prim Care Diabetes 2020;14:672-7.ArticlePubMed
- 26. Yarnoff BO, Hoerger TJ, Simpson SK, Leib A, Burrows NR, Shrestha SS, et al. The cost-effectiveness of using chronic kidney disease risk scores to screen for early-stage chronic kidney disease. BMC Nephrol 2017;18:85.ArticlePubMedPMCPDF
- 27. Kshirsagar AV, Bang H, Bomback AS, Vupputuri S, Shoham DA, Kern LM, et al. A simple algorithm to predict incident kidney disease. Arch Intern Med 2008;168:2466-73.ArticlePubMedPMC
- 28. Dutta D, Mukhopadhyay S. Intervening at prediabetes stage is critical to controlling the diabetes epidemic among Asian Indians. Indian J Med Res 2016;143:401-4.ArticlePubMedPMC
- 29. Cai X, Zhang Y, Li M, Wu JH, Mai L, Li J, et al. Association between prediabetes and risk of all cause mortality and cardiovascular disease: updated meta-analysis. BMJ 2020;370:m2297.ArticlePubMedPMC
- 30. Spence JD, Viscoli CM, Inzucchi SE, Dearborn-Tomazos J, Ford GA, Gorman M, et al. Pioglitazone therapy in patients with stroke and prediabetes: a post hoc analysis of the IRIS randomized clinical trial. JAMA Neurol 2019;76:526-35.ArticlePubMedPMC
- 31. Poltavskiy E, Kim DJ, Bang H. Comparison of screening scores for diabetes and prediabetes. Diabetes Res Clin Pract 2016;118:146-53.ArticlePubMedPMC
- 32. Kim MK, Ko SH, Kim BY, Kang ES, Noh J, Kim SK, et al. 2019 Clinical practice guidelines for type 2 diabetes mellitus in Korea. Diabetes Metab J 2019;43:398-406.ArticlePubMedPMCPDF
- 33. Jeong TD, Lee W, Yun YM, Chun S, Song J, Min WK. Development and validation of the Korean version of CKD-EPI equation to estimate glomerular filtration rate. Clin Biochem 2016;49:713-9.ArticlePubMed
- 34. Oh JY, Lim S, Kim DJ, Kim NH, Kim DJ, Moon SD, et al. A report on the diagnosis of intermediate hyperglycemia in Korea: a pooled analysis of four community-based cohort studies. Diabetes Res Clin Pract 2008;80:463-8.ArticlePubMed
- 35. Vart P, Powe NR, McCulloch CE, Saran R, Gillespie BW, Saydah S, et al. National trends in the prevalence of chronic kidney disease among racial/ethnic and socioeconomic status groups, 1988-2016. JAMA Netw Open 2020;3:e207932.ArticlePubMedPMC
- 36. WHO Expert Consultation. Appropriate body-mass index for Asian populations and its implications for policy and intervention strategies. Lancet 2004;363:157-63.ArticlePubMed
- 37. Matsushita K, Tang O, Selvin E. Addressing challenges and implications of national surveillance for racial/ethnic disparities in diabetes. JAMA 2019;322:2387-8.ArticlePubMedPMC
- 38. Spracklen CN, Horikoshi M, Kim YJ, Lin K, Bragg F, Moon S, et al. Identification of type 2 diabetes loci in 433,540 East Asian individuals. Nature 2020;582:240-5.PubMedPMC
- 39. Reaching Immigrants through Community Empowerment (RICE): Project RICE. Available from: https://med.nyu.edu/sites/default/files/prevention-research2/RICE%20-%20KCS%20Newsletter%207.19.13%20FINAL%20ENG.pdf (cited 2021 Aug 6).
- 40. Kahn HS, Cheng YJ, Thompson TJ, Imperatore G, Gregg EW. Two risk-scoring systems for predicting incident diabetes mellitus in U.S. adults age 45 to 64 years. Ann Intern Med 2009;150:741-51.ArticlePubMed
- 41. Xie Z, Nikolayeva O, Luo J, Li D. Building risk prediction models for type 2 diabetes using machine learning techniques. Prev Chronic Dis 2019;16:E130.ArticlePubMedPMC
- 42. Magacho EJ, Andrade LC, Costa TJ, Paula EA, Araujo Sde S, Pinto MA, et al. Translation, cultural adaptation, and validation of the screening for occult renal disease (SCORED) questionnaire to Brazilian Portuguese. J Bras Nefrol 2012;34:251-8.ArticlePubMed
- 43. Chu M. Korea keeps high blood pressure standard at 140/90 mmHg. Available from: http://www.koreabiomed.com/news/articleView.html?idxno=3319 (cited 2021 Aug 6).
- 44. Lee YH, Bang H, Kim DJ. How to establish clinical prediction models. Endocrinol Metab (Seoul) 2016;31:38-44.ArticlePubMedPMCPDF
- 45. Bang H. Biomarker score in risk prediction: beyond scientific evidence and statistical performance. Diabetes Metab J 2020;44:245-7.ArticlePubMedPMCPDF
- 46. Gaind N. Life expectancy set to hit 90 in South Korea. Nature 2017. https://doi.org/10.1038/nature.2017.21535.
- 47. Sussman JB, Kent DM, Nelson JP, Hayward RA. Improving diabetes prevention with benefit based tailored treatment: risk based reanalysis of Diabetes Prevention Program. BMJ 2015;350:h454.ArticlePubMedPMC
- 48. Dimala CA, Atashili J, Mbuagbaw JC, Wilfred A, Monekosso GL. A comparison of the diabetes risk score in HIV/AIDS patients on Highly Active Antiretroviral Therapy (HAART) and HAART-naive patients at the Limbe Regional Hospital, Cameroon. PLoS One 2016;11:e0155560.ArticlePubMedPMC
- 49. Harward DH, Bang H, Hu Y, Bomback AS, Kshirsagar AV. Evaluation of the SCORED questionnaire to identify individuals with chronic kidney disease in a community-based screening program in rural North Carolina. J Community Med Health Educ 2014;4(Suppl 2):007.PubMedPMC
- 50. Poon EG, Gandhi TK, Sequist TD, Murff HJ, Karson AS, Bates DW. “I wish I had seen this test result earlier!”: dissatisfaction with test result management systems in primary care. Arch Intern Med 2004;164:2223-8.ArticlePubMed
REFERENCES
Appendix
Appendix 1.
NHANES, National Health and Nutrition Examination Survey; KNHANES, Korea National Health and Nutrition Examination Survey; DM, diabetes mellitus; eGFR, estimated glomerular filtration rate; HbA1c, glycosylated hemoglobin; CKD-EPI, Chronic Kidney Disease Epidemiology Collaboration; MDRD, Modification of Diet in Renal Disease; KDIGO, Kidney Disease: Improving Global Outcomes.
Figure & Data
References
Citations
- A meta‐analysis of diabetes risk prediction models applied to prediabetes screening
Yujin Liu, Sunrui Yu, Wenming Feng, Hangfeng Mo, Yuting Hua, Mei Zhang, Zhichao Zhu, Xiaoping Zhang, Zhen Wu, Lanzhen Zheng, Xiaoqiu Wu, Jiantong Shen, Wei Qiu, Jianlin Lou
Diabetes, Obesity and Metabolism.2024; 26(5): 1593. CrossRef - Performance Analysis and Assessment of Type 2 Diabetes Screening Scores in Patients with Non-Alcoholic Fatty Liver Disease
Norma Latif Fitriyani, Muhammad Syafrudin, Siti Maghfirotul Ulyah, Ganjar Alfian, Syifa Latif Qolbiyani, Chuan-Kai Yang, Jongtae Rhee, Muhammad Anshari
Mathematics.2023; 11(10): 2266. CrossRef - A Comprehensive Analysis of Chinese, Japanese, Korean, US-PIMA Indian, and Trinidadian Screening Scores for Diabetes Risk Assessment and Prediction
Norma Latif Fitriyani, Muhammad Syafrudin, Siti Maghfirotul Ulyah, Ganjar Alfian, Syifa Latif Qolbiyani, Muhammad Anshari
Mathematics.2022; 10(21): 4027. CrossRef
 PubReader
 ePub Link
 Cite
Cite


