ABSTRACT
-
Background
- Tyrosine kinase 2 (TYK2) is a candidate gene for type 1 diabetes mellitus (T1DM) since it plays an important role in regulating apoptotic and pro-inflammatory pathways in pancreatic β-cells through modulation of the type I interferon signaling pathway. The rs2304256 single nucleotide polymorphism (SNP) in TYK2 gene has been associated with protection for different autoimmune diseases. However, to date, only two studies have evaluated the association between this SNP and T1DM, with discordant results. This study thus aimed to investigate the association between the TYK2 rs2304256 SNP and T1DM in a Southern Brazilian population.
-
Methods
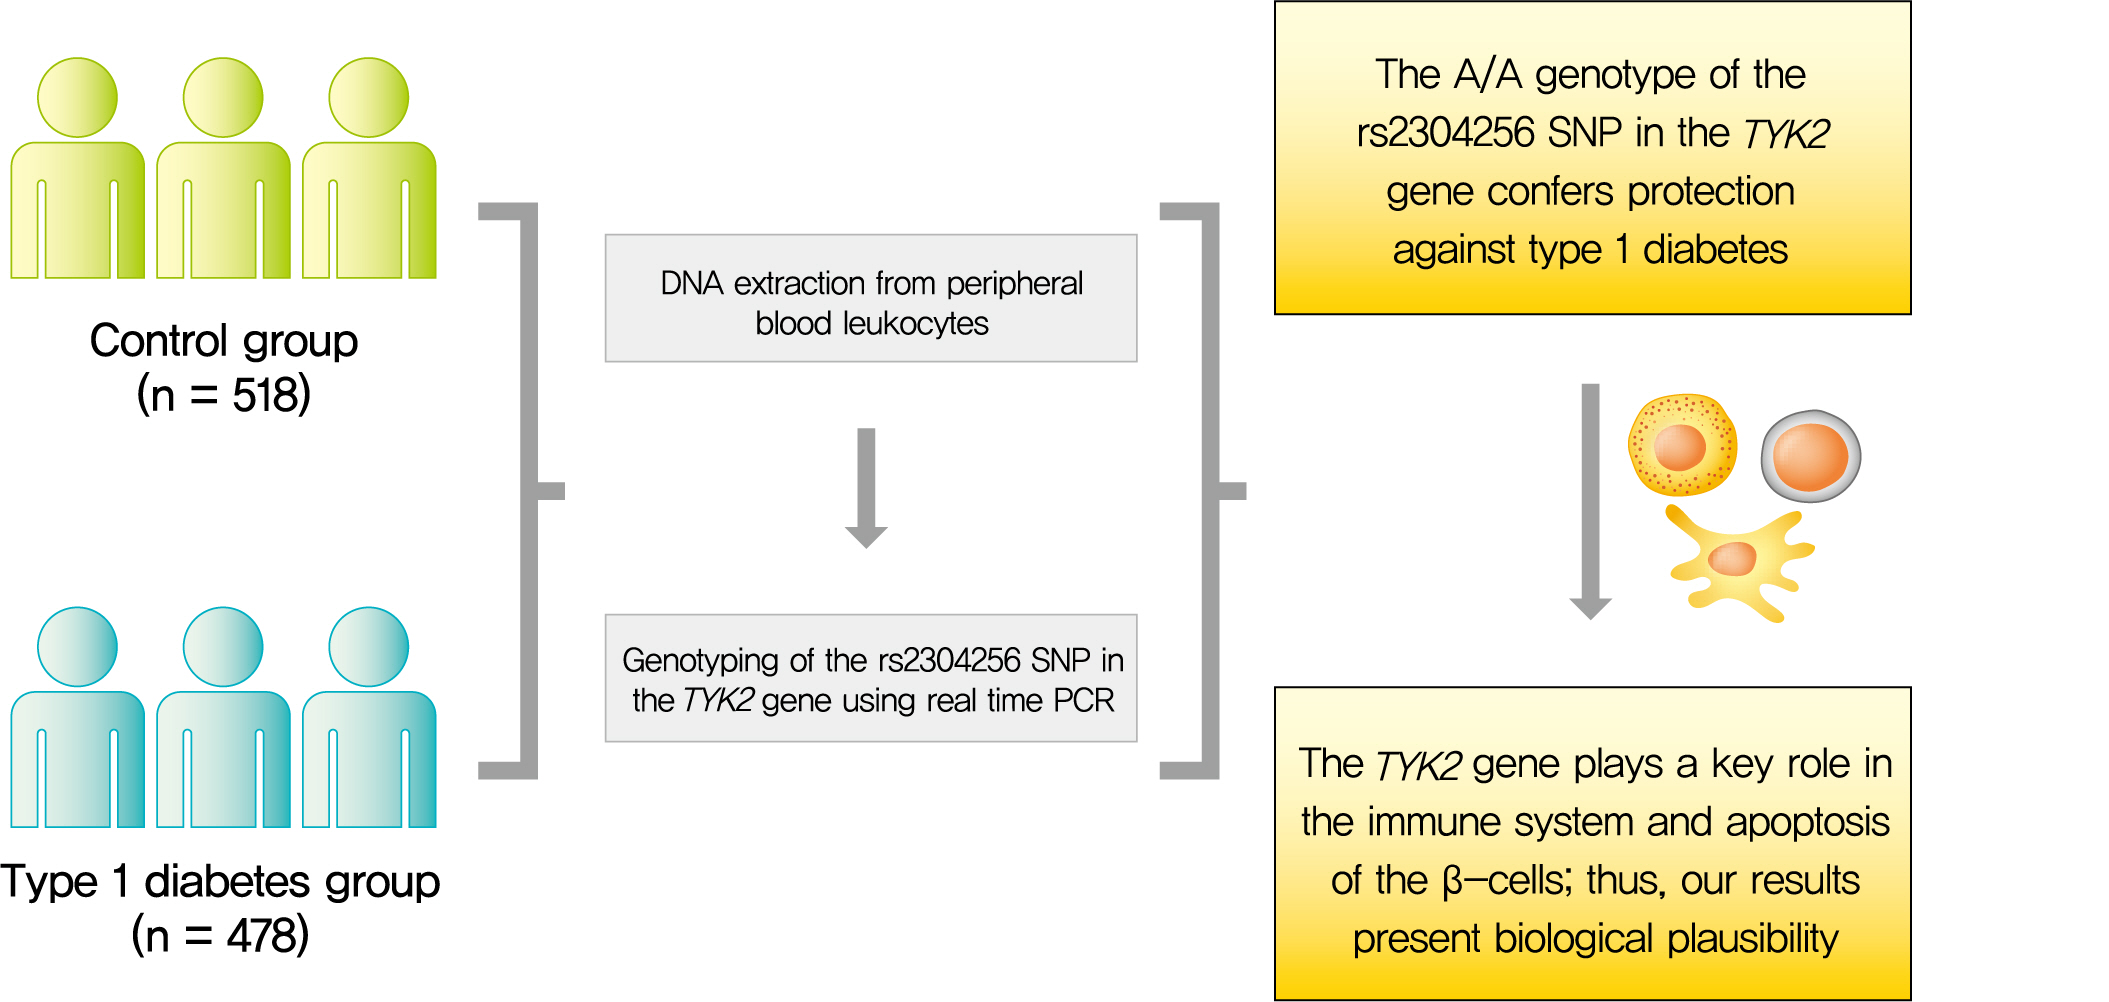
- This case-control study comprised 478 patients with T1DM and 518 non-diabetic subjects. The rs2304256 (C/A) SNP was genotyped by real-time polymerase chain reaction technique using TaqMan minor groove binder (MGB) probes.
-
Results
- Genotype and allele frequencies of the rs2304256 SNP differed between T1DM patients and non-diabetic subjects (P<0.0001 and P=0.001, respectively). Furthermore, the A allele was associated with protection against T1DM under recessive (odds ratio [OR], 0.482; 95% confidence interval [CI], 0.288 to 0.806) and additive (OR, 0.470; 95% CI, 0.278 to 0.794) inheritance models, adjusting for human leukocyte antigen (HLA) DR/DQ genotypes, gender, and ethnicity.
-
Conclusion
- The A/A genotype of TYK2 rs2304256 SNP is associated with protection against T1DM in a Southern Brazilian population.
-
Keywords: Autoimmune diseases; Diabetes mellitus, type 1; Polymorphism, genetic; Polymorphism, single nucleotide; TYK2 kinase
Graphical abstract
INTRODUCTION
- Chronic hyperglycemia in type 1 diabetes mellitus (T1DM) is caused by the severe autoimmune destruction of pancreatic β-cells by macrophages and T lymphocytes, which renders subjects insulin-dependent for life [1]. Autoimmunity against β-cells occurs in the context of crosstalk between invading immune cells and the target β-cells, and is triggered by a multifaceted interaction between several genetic and environmental risk factors [1-3]. To date, genome-wide association studies have identified more than 60 loci associated with T1DM. Among these loci, the human leukocyte antigen (HLA) class II (DR/DQ) region has shown the greatest impact on T1DM susceptibility, with an odds ratio (OR) >7 [2,4,5]. Although single nucleotide polymorphisms (SNPs) in other loci confer modest risks (OR <2) for T1DM, studies have suggested the combination of HLA genotypes with non-HLA SNPs may be useful for disease prediction [5-7].
- β-Cells express 80% of T1DM candidate genes [8-10], which may contribute to T1DM pathogenesis by regulating important pathways in these cells, such as activation of apoptosis, antiviral activity, and innate immunity, involving retinoic acid-inducible-like (RIG-like) receptors and regulators of type I interferons (IFN-I) [8-11]. Tyrosine kinase 2 (TYK2) is a T1DM candidate gene that encodes a member of the Janus kinase (JAK) family of tyrosine kinases, which play a key role in the intracellular signaling of several cytokines and IFN-I.
- TYK2 is bound to the IFN-I receptor (IFNAR1) on cell surface in its inactive form. After IFN-α binding to the IFNAR1, TYK2, and JAK1 are activated, leading to recruitment and phosphorylation of signal transducer and activator of transcription (STAT) 1 and 2. STAT1/2 heterodimers translocate to the nucleus, where they regulate the expression of IFN-stimulated genes [8,11-13]. In β-cells, TYK2 seems to activate apoptotic and pro-inflammatory pathways via modulation of IFN-I signaling after a viral infection [8]. Interestingly, a study performed by Izumi et al. [14] in C57BL/6 mice carrying a mutant promoter region haplotype (containing 11 mutations) in the Tyk2 gene demonstrated this haplotype was associated with susceptibility to T1DM induced by viral infection.
- Accordingly, SNPs in the TYK2 gene have been associated with protection against autoimmune diseases, including systemic lupus erythematosus (SLE), ulcerative colitis (UC), Crohn’s disease (CD), multiple sclerosis, and rheumatoid arthritis (RA) [15-17]. The minor A allele of the rs2304256 SNP in TYK2 has also been associated with protection against T1DM [18]. Importantly, this missense SNP (C/A; Val362Phe) in exon 8 of the TYK2 gene seems to be functional, since B lymphoblastoid cells (BLCLs) obtained from subjects with the A/A genotype showed less marked IFN-α-induced STAT1 phosphorylation compared to cells from subjects with the C/C genotype [8]. Another study performed in a Japanese population was not able to confirm the association with T1DM [19]. To our knowledge, no other study has evaluated the association between this SNP and T1DM susceptibility. Thus, we sought to investigate the association between the TYK2 rs2304256 SNP and T1DM in a Southern Brazilian population of mixed ethnicity.
METHODS
- Case and control samples, phenotype measurements, and laboratory analyses
- This case-control study was designed and performed following the Strengthening the Reporting of Observational Studies in Epidemiology (STROBE) and STrengthening the REporting of Genetic Association Studies (STREGA) guidelines [20,21]. The case group consisted of 478 T1DM patients recruited from the outpatient clinic of Hospital de Clínicas de Porto Alegre (Rio Grande do Sul, Brazil). T1DM was diagnosed according to the American Diabetes Association (ADA) guidelines [1]. Briefly, patients were diagnosed as having T1DM if they presented with clinical manifestations of T1DM, including presence of ketoacidosis, low or normal body mass index (BMI), young age (<30 years), need for insulin treatment since diagnosis, and hyperglycemia in the range described in ADA guidelines [1]. If questions remained regarding the type of diabetes, C-peptide levels and autoantibodies were also evaluated. Of note, T1DM classification was based on a practical definition used by staff physicians at the outpatient clinic. The control group comprised 518 non-diabetic blood donors recruited from the same hospital. Subjects with glycosylated hemoglobin (HbA1c) levels ≥5.7% [1] and/or a family history of diabetes were excluded from the control sample. Ethnicity was defined based on self-classification, and categorized dichotomously as white or non-white.
- For the case group, a standard questionnaire was used to collect information regarding age, age at T1DM diagnosis, drug treatment, and ethnicity. All patients underwent complete physical examination and laboratory tests, as previously described by our research group [22,23]. For the control group, a simplified questionnaire was applied to collect information on age, family history of diabetes or other diseases, current drug treatment, and presence of arterial hypertension. Weight and height were measured for BMI calculation, and blood was collected for HbA1c measurement. From both T1DM and control subjects, peripheral blood was collected for DNA extraction. All patients and non-diabetic subjects gave assent and written informed consent prior to inclusion in the study, and the Ethic Committee in Research at Hospital de Clínicas de Porto Alegre approved the study protocol (number: 2018-0051). All study procedures were in accordance with the ethical standards laid down in the Declaration of Helsinki.
- Genotyping of the rs2304256 SNP in the TYK2 gene and HLA DR/DQ genotypes
- DNA was extracted from peripheral blood leukocytes by a standardized salting-out technique [24]. The rs2304256 (C/A) SNP in TYK2 was genotyped by allele discrimination-real time polymerase chain reaction (PCR) technique using a TaqMan SNP Genotyping Assay (Thermo Fisher Scientific, Foster City, CA, USA) specific for this SNP (Assay ID: C_25473911_10). Real-time PCR reactions were performed in 384-well plates, in a total volume of 5 µL, using 2 ng of DNA, Mastermix TaqPath ProAmp 1x (Thermo Fischer Scientific), and TaqMan SNP Genotyping Assay 1x. The plates were then placed in the ViiA7 Real-Time PCR System (Thermo Fischer Scientific) and heated for 10 minutes at 95°C, followed by 50 cycles at 95°C for 15 seconds and 62°C for 1 minute, as suggested by the manufacturer. Of note, 10% of all PCR reactions were performed twice, with a calculated error rate based on PCR duplicates of <0.5%. Genotyping success was >95% in our samples.
- Considering that HLA DR/DQ genotypes may affect the association between the rs2304256 SNP and T1DM, we also analyzed frequencies of HLA high-risk genotypes in all subjects in order to control for a possible association between the TYK2 SNP and T1DM for the HLA genotypes. For this purpose, three SNPs (rs3104413, rs2854275, and rs9273363) adjacent to the HLA class II DR/DQ region were genotyped by using specific Custom TaqMan Genotyping Assays 40x (Thermo Fischer Scientific), as previously described [25]. This method was used considering that Nguyen et al. [26] showed these SNPs can predict HLA DR/DQ genotypes associated with T1DM susceptibility with an accuracy higher than 99%. Thus, using this method, we calculated predicted frequencies of the following HLA DR/DQ genotypes: high-risk (DR4/DQ8 or DR3/DR4-DQ-8 or DR3/DR3), intermediate-risk (DR3/DRx), and low-risk (DRx/DRx or D4/DQ7) genotypes, where x can be different non-risk alleles [26]. These three SNPs are located in the intergenic region between HLA-DRB1, HLA-DQA1, and HLA-DQB1, being in strong linkage disequilibrium with the high-risk HLA genotypes. For this reason, they show high accuracy for high-risk HLA DR/DQ genotype prediction.
- Statistical analyses
- Allele frequencies were calculated by gene counting, and deviations from Hardy-Weinberg equilibrium (HWE) were analyzed using chi-square tests. Allele and genotype frequencies were compared between case and control groups with chi-square tests. Moreover, genotypes were compared between groups under additive, recessive, and dominant inheritance models [27, 28]. Normality of distribution of variables was checked using Kolmogorov-Smirnov and Shapiro-Wilk tests. Quantitative variables are shown as mean±standard deviation, while categorical variables are shown as percentages. Clinical and laboratory characteristics were compared between groups using unpaired Student’s t-test or chi-square tests, as appropriate. Logistic regression analyses were used to estimate ORs with 95% confidence intervals (CI) and P values for the effects of rs2304256 genotypes on T1DM susceptibility, both for genotype frequencies and different inheritance models and adjusting for covariates. Power calculation was performed online at www.openepi.com. The study has a power of approximately 80% (α=0.05) to detect an OR lower than 0.65, considering an A allele frequency of 30% in controls. Statistical analyses were performed in PASW Statistics version 18.0 software (SPSS Inc., Chicago, IL, USA), and P values <0.05 were considered significant.
RESULTS
- Sample description
- Clinical and laboratory characteristics of the T1DM patients and non-diabetic subjects included in this study are shown in Table 1. Mean BMI and the percentage of males were higher in the control group than in the T1DM group. Non-white subjects comprised 9.3% of the T1DM group and 11.8% of the control sample (P=0.233). As expected, mean HbA1c levels and frequency of high-risk HLA DR/DQ genotypes were higher in T1DM patients compared with controls. Mean age at T1DM diagnosis was 17.4±9.7 years, and the mean T1DM duration was 20.2±9.1 years. Moreover, 59.8% of patients with T1DM had diabetic retinopathy (DR), while 40.4% had diabetic kidney disease (DKD). Mean age did not differ between groups.
- Genotype and allele distributions
- Genotype frequencies of the TYK2 rs2304256 (C/A) SNP were not in accordance with those predicted by the HWE in controls (P<0.001). Table 2 shows genotype and allele frequencies of this SNP in T1DM patients and non-diabetic subjects. Genotype frequencies were significantly different between the T1DM and control groups (P=0.001). Accordingly, the A allele frequency was lower in T1DM patients compared with the control group (23.1% vs. 29.6%, P=0.001). Moreover, the A allele was associated with protection against T1DM under recessive (P<0.0001) and additive (P<0.0001) inheritance models. After adjustment for the presence of high-risk HLA DR/DQ genotypes, gender, and ethnicity, the A/A genotype remained independently associated with protection against T1DM in both inheritance models (recessive [OR, 0.482; 95% CI, 0.288 to 0.806; P=0.005], additive [OR, 0.470; 95% CI, 0.278 to 0.794; P=0.005]).
- Genotype distributions of the rs2304256 SNP were different between white and non-white subjects (white: 55.5% C/C, 33.5% C/A, and 11.0% A/A; non-white: 69.5% C/C, 27.6% C/A, and 2.9% A/A; P=0.005). Accordingly, the A allele frequency was increased in white subjects compared with non-white subjects (28.0% vs. 17.0%, P=0.0008). Thus, to evaluate whether ethnicity could influence our results, we next analyzed the association of the rs2304256 SNP with T1DM after stratifying samples by ethnicity (Table 3). In white subjects, the A allele frequency remained significantly decreased in T1DM patients compared with control subjects (24.0% vs. 31.0%, P<0.001), and this allele remained significantly associated with protection against T1DM for both recessive and additive models, adjusting for high-risk HLA DR/DQ genotypes and gender (Table 3). In non-white subjects, genotype and allele frequencies of the rs2304256 SNP did not differ significantly between case and control groups; however, these data should be interpreted with caution considering the small number of non-white subjects and consequent lack of statistical power.
-
Table 4 depicts clinical and laboratory characteristics of T1DM patients broken down by presence of the A/A genotype of the rs2304256 SNP (recessive model: C/C+C/A vs. A/A). Frequencies of gender, high-risk HLA DR/DQ genotypes, ethnicity, hypertension, DR, and DKD, as well as mean age, age at diagnosis, T1DM duration, HbA1c, and BMI were not significantly different between T1DM patients with the A/A genotype and patients carrying the C allele (all P values >0.05). Of note, excluding non-white subjects from these analyses did not change the results (data not shown). The same variables were not significantly different between T1DM patients carrying the A allele (C/A+A/A) and patients with the C/C genotype (dominant model of inheritance, data not shown).
DISCUSSION
- TYK2 plays an important role in immunity because it encodes a nonreceptor tyrosine kinase that is constitutively expressed across different immune cells and activates dendritic cells to present self-antigens to autoreactive T-cells [15,29]. Moreover, TYK2 has a key role in regulating the intracellular signaling of several cytokines and IFN-I, and seems to be involved in β-cells apoptosis, which are key mechanisms implicated in T1DM pathogenesis [8]. Thus, TYK2 is a candidate gene for T1DM. Even though the TYK2 rs2304256 (C/A) SNP has been associated with other autoimmune diseases in different populations [15,17-19,30-34], only two studies evaluated its association with T1DM [18,19]. Thus, for the first time, we replicated the association of the TYK2 rs2304256 SNP with T1DM in a Southern Brazilian population of mixed ethnicity, showing that the A/A genotype of this SNP protects against T1DM.
- Our results are in accordance with a previous study by Wallace et al. [18], who evaluated the rs2304256 SNP in 2,686 patients with T1DM and 4,794 non-diabetic controls of European ancestry and found the A allele to be associated with protection for T1DM (OR, 0.87; 95% CI, 0.81 to 0.94). In contrast, another study that included 244 patients with T1DM and 254 non-diabetic controls from a Japanese population was not able to confirm this association [19]. These contradictory results might be explained by differences in genetic backgrounds related to the ethnicities analyzed and to the lower incidence of T1DM in East Asians compared with Europeans and Brazilians [35]. Even though mean age and HbA1c levels were similar between patients from the study by Nagafuchi et al. [19] and our sample, the mean age at T1DM diagnosis was higher in their study compared with ours (27.8±17.9 years vs. 17.4±9.7 years), which could also have influenced the discrepant results.
- Besides T1DM, the rs2304256 A allele has also been associated with protection against other autoimmune diseases. Tao et al. [17] performed a meta-analysis of 11 studies (21,497 cases and 22,647 healthy controls) to confirm the association of a number of TYK2 SNPs with some autoimmune and inflammatory diseases (SLE, RA, UC, and CD). Their data showed the rs2304256 A allele to be associated with protection against these diseases (OR, 0.69; 95% CI, 0.59 to 0.81, for the dominant model of inheritance) [17]. The authors speculated that the rs2304256 A allele may reduce TYK2 function, resulting in a decreased susceptibility to autoimmune diseases [17]. Another meta-analysis including 12 studies, totalizing 16,335 cases with SLE or RA and 30,065 controls, confirmed that the rs2304256 A allele confers protection against these rheumatic diseases (OR, 0.88; 95% CI, 0.80 to 0.98) [16].
- The TYK2 rs2304256 SNP causes a valine-to-phenylalanine change at position 362 in the Jak-homology 4 (JH4) region, which is critical for interaction with IFNAR1 [8,36]. Although the functional significance of this SNP remains unclear, it may be related to abnormal downstream regulation of the IFN-I pathway [16]. Accordingly, Nyaga et al. [36], analyzing T1DM-associated SNP-gene pairs using the Genotype-Tissue Expression (GTEx) database and bioinformatics analyses, predicted that the TYK2 rs2304256 SNP may contribute to T1DM pathogenesis by cis-regulating a number of genes within the IFN-I signaling pathway.
- Moreover, a study demonstrated that TYK2 silencing in human β-cells exposed to polyinosinic:polycytidylic acid (poly I:C [PIC], a mimic of double-stranded RNA produced during viral infection) decreased IFN-I pathway activation and expression of C-X-C motif chemokine ligand 10 (CXCL10) and major histocompatibility complex (MHC) class I proteins, a hallmark of early β-cell inflammation in T1DM [8]. Consequently, TYK2 inhibition also prevented PIC-induced β-cell apoptosis [8]. Importantly, these authors showed that BLCLs isolated from subjects with the rs2304256 A/A genotype showed a trend for less marked IFN-α-induced STAT1 phosphorylation compared with subjects carrying the C/C genotype (3.5-fold STAT1 phosphorylation vs. 5.7-fold increase compared to the basal condition, respectively) [8]. Therefore, the authors concluded that the protective effect of the A allele against T1DM is mediated by downregulation of IFN-α signaling, which decreases the production of proinflammatory cytokines and inflammation [8].
- Besides the rs2304256 SNP, other SNPs in the TYK2 gene have been associated with T1DM [19,32,33]. The minor alleles of the rs34536443 (G/C) and rs12720356 (A/C) SNPs were associated with protection against T1DM (OR, 0.67; P=4.4×10⁻¹⁵; and OR, 0.82; P=3.7×10⁻⁷, respectively) in samples from different localities in Europe [32]. In addition, Nagafuchi et al. [19] evaluated different SNPs at the promoter region and exons of the TYK2 gene in 302 T1DM patients and 331 non-diabetic controls from a Japanese population, and showed that a haplotype constituted of two rare SNPs at the promoter region (-930G/A and -929G/T) conferred risk for T1DM (OR, 2.4; 95% CI, 1.2 to 4.6). Interestingly, the TYK2 haplotype was associated with decreased promoter activity and conferred higher risk for T1DM in those patients with a flu-like syndrome (OR, 3.6; 95% CI, 1.5 to 8.5), suggesting that this haplotype is a putative candidate for a virus-induced diabetes susceptibility region in humans [19].
- Based on the above-mentioned evidence, we hypothesized that the TYK2 rs2304256 A allele might protect against T1DM through TYK2 downregulation, which would consequently blunt the IFN-I pro-inflammatory pathway, thus reducing the production of proinflammatory cytokines and inflammation in β-cells. In this context, blocking the TYK2/IFN-I pathway in recently-diagnosed T1DM patients may hinder the autoimmunity against β-cells and, hence, preserve some residual β-cell function and improve glycemic control. Interestingly, Fujita et al. [37] reported that treating a patient with RA complicated by systemic sclerosis and T1DM for 52 weeks with baricitinib—a JAK 1/2 inhibitor that downregulates the IFN-pathway and is approved for the treatment of RA [38]—attenuated RA symptoms, skin sclerosis, and decreased daily insulin requirements and HbA1c levels. Baricitinib has also being tested for the treatment of other autoimmune diseases, such as SLE and psoriasis [39,40]. Thus, IFN-I blockade could be effective in the treatment of recent-diagnosed T1DM.
- A few limitations should be considered in interpreting our results. First, genotype frequencies of the rs2304256 SNP were not in agreement with those predicted by HWE in the control group. Even though genotyping by real-time PCR is a reliable technique [41], we checked all genotype data manually to exclude the possibility of genotyping errors, and also genotyped 10% of the samples twice. Moreover, to exclude a possible effect of stratification bias in this deviation from HWE, we excluded the non-white subjects from the sample. However, genotype frequencies remained not in agreement with those predicted by HWE in the control group constituted only of white subjects. Thus, one possible explanation for this deviation from HWE is that the rs2304256 SNP is associated with protection against T1DM with a lower OR and, therefore, could be under selective forces. Second, we cannot exclude the possibility of population stratification bias when analyzing our data, despite the frequencies of the rs2304256 SNP not being statistically different between white and non-white subjects. To exclude this bias, regression analyses included ethnicity as a covariate, showing that the observed association with T1DM was independent of ethnicity. Moreover, we analyzed white and nonwhite subgroups separately (Table 3), confirming the observed association in white subjects. However, the association with T1DM was not confirmed in the non-white group, probably due to lack of statistical power. Third, we did not have available data regarding C-peptide and glutamic acid decarboxylase (GAD) autoantibodies at the time of T1DM patient selection; thus, despite all efforts, we cannot exclude the possibility of selection bias in our study. Of note, as mentioned above, all patients included in the T1DM group met the ADA [1] criteria and were diagnosed at a center of excellence for T1DM care. In this context, T1DM classification was mainly based on clinical characteristics; C-peptide and/or anti-GAD were measured only in a small group of subjects when there were doubts about diabetes classification. Theoretically, this could lead to some misclassification, and some insulinogenic T2DM patients may have been included.
- In conclusion, the present study indicates that the A/A genotype of the rs2304256 SNP in TYK2 is associated with protection against T1DM in a Southern Brazilian population of mixed ethnicity. This association is biologically plausible, considering the involvement of TYK2 in immune system function and in the regulation of inflammation and apoptosis of β-cells. The present data contribute to the search for possible genetic markers of T1DM susceptibility and, if the association of the TYK2 rs2304256 SNP with protection against T1DM is confirmed in further studies, to the development of predictive scores for T1DM.
NOTES
-
CONFLICTS OF INTEREST
No potential conflict of interest relevant to this article was reported.
-
AUTHOR CONTRIBUTIONS
Conception or design: F.M.P., B.M.S., D.C.
Acquisition, analysis, or interpretation of data: F.M.P., C.D., G.C.K.D., L.H.C., D.C.
Drafting the work or revising: F.M.P., C.D., G.C.K.D., L.H.C., B.M.S., D.C.
Final approval of the manuscript: F.M.P., C.D., G.C.K.D., L.H.C., B.M.S., D.C.
-
FUNDING
The study was partially funded by Coordenação de Aperfeiçoamento de Pessoal de Nível Superior (CAPES), Conselho Nacional de Desenvolvimento Científico e Tecnológico (CNPq), Fundação de Amparo à Pesquisa do Estado do Rio Grande do Sul (FAPERGS) and Fundo de Incentivo à Pesquisa e Eventos at Hospital de Clínicas de Porto Alegre (FIPE-HCPA) (grant number: 2018-0051).
Acknowledgements- Daisy Crispim and Guilherme Coutinho Kullmann Duarte are recipients of scholarships from CNPq. Felipe Mateus Pellenz, Bianca Marmontel de Souza, and Cristine Dieter are recipients of scholarships from CAPES.
Table 1.Clinical and laboratory characteristics of T1DM patients (cases) and non-diabetic subjects (controls)
|
Characteristic |
Control group (n=518) |
T1DM group (n=478) |
P valuea
|
|
Age, yr |
39.1±10.0 |
38.3±12.6 |
0.296 |
|
Male sex, % |
59.1 |
51.5 |
0.019 |
|
T1DM duration, yr |
- |
20.2±9.1 |
- |
|
Ethnicity (non-White), % |
11.8 |
9.3 |
0.233 |
|
HbA1c, % (mmol/mol) |
5.3±0.3 (34±0.39) |
8.7±2.0 (72±10) |
<0.0001 |
|
High-risk HLA DR/DQ genotypes, %b
|
17.5 |
58.0 |
<0.0001 |
|
BMI, kg/m2
|
27.1±4.5 |
24.4±3.7 |
<0.0001 |
|
Hypertension, % |
- |
46.4 |
- |
|
Age at T1DM diagnosis, yr |
- |
17.4±9.7 |
- |
|
Diabetic kidney disease, % |
- |
40.4 |
- |
|
Diabetic retinopathy, % |
- |
59.8 |
- |
Table 2.Genotype and allele frequencies of TYK2 rs2304256 polymorphism in T1DM patients and non-diabetic subjects
|
Variable |
Control group (n=518) |
T1DM group (n=478) |
P valuea
|
Adjusted OR (95% CI)/P valueb
|
|
Genotypes |
|
|
|
|
|
C/C |
282 (54.4) |
287 (60.0) |
0.001 |
1 |
|
C/A |
165 (31.9) |
161 (33.7) |
|
0.921 (0.660–1.285)/0.627 |
|
A/A |
71 (13.7) |
30 (6.3) |
|
0.467 (0.275–0.794)/0.005 |
|
Alleles |
|
|
|
|
|
C |
0.704 |
0.769 |
0.001 |
- |
|
A |
0.296 |
0.231 |
|
|
|
Recessive model |
|
|
|
|
|
C/C+C/A |
447 (86.3) |
448 (93.7) |
<0.0001 |
1 |
|
A/A |
71 (13.7) |
30 (6.3) |
|
0.482 (0.288–0.806)/0.005 |
|
Additive model |
|
|
|
|
|
C/C |
282 (79.9) |
287 (90.5) |
<0.0001 |
1 |
|
A/A |
71 (20.1) |
30 (9.5) |
|
0.470 (0.278–0.794)/0.005 |
|
Dominant model |
|
|
|
|
|
C/C |
282 (54.4) |
287 (60.0) |
0.074 |
1 |
|
C/A+A/A |
236 (45.6) |
191 (40.0) |
|
0.782 (0.575–1.063)/0.116 |
Table 3.Genotype and allele frequencies of TYK2 rs2304256 polymorphism between cases and controls stratified by ethnicity
|
Variable |
Control group (n=456) |
T1DM group (n=431) |
P valuea
|
Adjusted OR (95% CI)/P valueb
|
|
White subjects |
|
|
|
|
|
Genotypes |
|
|
|
|
|
C/C |
240 (52.6) |
252 (58.5) |
<0.0001 |
1 |
|
C/A |
147 (32.2) |
150 (34.8) |
|
0.839 (0.585–1.203)/0.339 |
|
A/A |
69 (15.1) |
29 (6.7) |
|
0.485 (0.276–0.851)/0.012 |
|
Alleles |
|
|
|
|
|
C |
0.690 |
0.760 |
<0.001 |
- |
|
A |
0.310 |
0.240 |
|
|
|
Recessive model |
|
|
|
|
|
C/C+C/A |
387 (84.9) |
402 (93.3) |
<0.0001 |
1 |
|
A/A |
69 (15.1) |
29 (6.7) |
|
0.518 (0.301–0.894)/0.018 |
|
Additive model |
|
|
|
|
|
C/C |
240 (77.7) |
252 (89.7) |
<0.0001 |
1 |
|
A/A |
69 (22.3) |
29 (10.3) |
|
0.488 (0.281–0.846)/0.011 |
|
Dominant model |
|
|
|
|
|
C/C |
240 (52.6) |
252 (58.5) |
0.093 |
1 |
|
C/A+A/A |
216 (47.4) |
179 (41.5) |
|
0.734 (0.526–1.023)/0.068 |
|
Non-white subjects |
61 |
44 |
|
|
|
Genotypes |
|
|
|
|
|
C/C |
41 (67.2) |
32 (72.7) |
0.823 |
1 |
|
C/A |
18 (29.5) |
11 (25.0) |
|
1.234 (0.389–3.910)/0.721 |
|
A/A |
2 (3.3) |
1 (2.3) |
|
0.816 (0.056–11.957)/0.882 |
|
Alleles |
|
|
|
|
|
C |
0.820 |
0.850 |
0.661 |
- |
|
A |
0.180 |
0.150 |
|
|
|
Dominant model |
|
|
|
|
|
C/C |
41 (67.2) |
32 (72.7) |
0.696 |
1 |
|
C/A+A/A |
20 (32.8) |
12 (27.3) |
|
1.164 (0.393–3.451)/0.784 |
Table 4.Clinical and laboratory characteristics of T1DM patients broken down by the presence of the A/A genotype of the rs2304256 SNP in TYK2 gene (recessive model)
|
Characteristic |
C/C+C/A (n=448) |
A/A (n=30) |
P valuea
|
|
Age, yr |
38.4±12.7 |
37.6±11.2 |
0.768 |
|
Age at diagnosis, yr |
17.3±9.8 |
18.5±9.9 |
0.557 |
|
T1DM duration, yr |
20.1±8.8 |
20.8±6.4 |
0.701 |
|
Male sex, % |
51.4 |
53.3 |
0.983 |
|
Ethnicity (non-white), % |
9.7 |
3.3 |
0.405 |
|
HbA1c, % (mmol/mol) |
8.7±2.0 (72±10) |
8.6±2.2 (70±12.5) |
0.772 |
|
T1DM high-risk HLA DR/DQ genotypes, % |
57.8 |
59.3 |
>0.999 |
|
BMI, kg/m2
|
24.4±3.7 |
24.6±3.6 |
0.843 |
|
Hypertension, % |
46.1 |
50.0 |
0.876 |
|
Diabetic retinopathy, % |
60.2 |
53.6 |
0.623 |
|
Diabetic kidney disease, % |
39.2 |
56.5 |
0.254 |
REFERENCES
- 1. American Diabetes Association 2. Classification and diagnosis of diabetes: standards of medical care in diabetes-2019. Diabetes Care 2019;42(Suppl 1):S13-28.PubMed
- 2. Redondo MJ, Steck AK, Pugliese A. Genetics of type 1 diabetes. Pediatr Diabetes 2018;19:346-53.ArticlePubMedPDF
- 3. Eizirik DL, Colli ML, Ortis F. The role of inflammation in insulitis and beta-cell loss in type 1 diabetes. Nat Rev Endocrinol 2009;5:219-26.ArticlePubMedPDF
- 4. Nyaga DM, Vickers MH, Jefferies C, Perry JK, O’Sullivan JM. The genetic architecture of type 1 diabetes mellitus. Mol Cell Endocrinol 2018;477:70-80.ArticlePubMed
- 5. Pociot F, Lernmark A. Genetic risk factors for type 1 diabetes. Lancet 2016;387:2331-9.ArticlePubMed
- 6. Winkler C, Krumsiek J, Buettner F, Angermuller C, Giannopoulou EZ, Theis FJ, et al. Feature ranking of type 1 diabetes susceptibility genes improves prediction of type 1 diabetes. Diabetologia 2014;57:2521-9.ArticlePubMedPDF
- 7. Steck AK, Rewers MJ. Genetics of type 1 diabetes. Clin Chem 2011;57:176-85.ArticlePubMedPMCPDF
- 8. Marroqui L, Dos Santos RS, Floyel T, Grieco FA, Santin I, Op de Beeck A, et al. TYK2, a candidate gene for type 1 diabetes, modulates apoptosis and the innate immune response in human pancreatic β-cells. Diabetes 2015;64:3808-17.ArticlePubMedPDF
- 9. Eizirik DL, Sammeth M, Bouckenooghe T, Bottu G, Sisino G, Igoillo-Esteve M, et al. The human pancreatic islet transcriptome: expression of candidate genes for type 1 diabetes and the impact of pro-inflammatory cytokines. PLoS Genet 2012;8:e1002552.ArticlePubMedPMC
- 10. Bergholdt R, Brorsson C, Palleja A, Berchtold LA, Floyel T, Bang-Berthelsen CH, et al. Identification of novel type 1 diabetes candidate genes by integrating genome-wide association data, protein-protein interactions, and human pancreatic islet gene expression. Diabetes 2012;61:954-62.ArticlePubMedPMCPDF
- 11. Santin I, Eizirik DL. Candidate genes for type 1 diabetes modulate pancreatic islet inflammation and β-cell apoptosis. Diabetes Obes Metab 2013;15 Suppl 3:71-81.ArticlePubMed
- 12. Babon JJ, Lucet IS, Murphy JM, Nicola NA, Varghese LN. The molecular regulation of Janus kinase (JAK) activation. Biochem J 2014;462:1-13.ArticlePubMedPDF
- 13. Strobl B, Stoiber D, Sexl V, Mueller M. Tyrosine kinase 2 (TYK2) in cytokine signalling and host immunity. Front Biosci (Landmark Ed) 2011;16:3214-32.ArticlePubMed
- 14. Izumi K, Mine K, Inoue Y, Teshima M, Ogawa S, Kai Y, et al. Reduced Tyk2 gene expression in β-cells due to natural mutation determines susceptibility to virus-induced diabetes. Nat Commun 2015;6:6748.ArticlePubMedPDF
- 15. Dendrou CA, Cortes A, Shipman L, Evans HG, Attfield KE, Jostins L, et al. Resolving TYK2 locus genotype-to-phenotype differences in autoimmunity. Sci Transl Med 2016;8:363ra149.ArticlePubMedPMC
- 16. Lee YH, Bae SC. Association between TYK2 polymorphisms and susceptibility to autoimmune rheumatic diseases: a meta-analysis. Lupus 2016;25:1307-14.ArticlePubMedPDF
- 17. Tao JH, Zou YF, Feng XL, Li J, Wang F, Pan FM, et al. Meta-analysis of TYK2 gene polymorphisms association with susceptibility to autoimmune and inflammatory diseases. Mol Biol Rep 2011;38:4663-72.ArticlePubMedPDF
- 18. Wallace C, Smyth DJ, Maisuria-Armer M, Walker NM, Todd JA, Clayton DG. The imprinted DLK1-MEG3 gene region on chromosome 14q32.2 alters susceptibility to type 1 diabetes. Nat Genet 2010;42:68-71.ArticlePubMedPDF
- 19. Nagafuchi S, Kamada-Hibio Y, Hirakawa K, Tsutsu N, Minami M, Okada A, et al. TYK2 promoter variant and diabetes mellitus in the Japanese. EBioMedicine 2015;2:744-9.ArticlePubMedPMC
- 20. von Elm E, Altman DG, Egger M, Pocock SJ, Gotzsche PC, Vandenbroucke JP, et al. The Strengthening the Reporting of Observational Studies in Epidemiology (STROBE) statement: guidelines for reporting observational studies. J Clin Epidemiol 2008;61:344-9.ArticlePubMed
- 21. Little J, Higgins JP, Ioannidis JP, Moher D, Gagnon F, von Elm E, et al. STrengthening the REporting of Genetic Association Studies (STREGA): an extension of the STROBE statement. Genet Epidemiol 2009;33:581-98.ArticlePubMed
- 22. Boucas AP, Brondani LA, Souza BM, Lemos NE, de Oliveira FS, Canani LH, et al. The A allele of the rs1990760 polymorphism in the IFIH1 gene is associated with protection for arterial hypertension in type 1 diabetic patients and with expression of this gene in human mononuclear cells. PLoS One 2013;8:e83451.ArticlePubMedPMC
- 23. Assmann TS, Brondani Lde A, Bauer AC, Canani LH, Crispim D. Polymorphisms in the TLR3 gene are associated with risk for type 1 diabetes mellitus. Eur J Endocrinol 2014;170:519-27.ArticlePubMed
- 24. Lahiri DK, Nurnberger JI Jr. A rapid non-enzymatic method for the preparation of HMW DNA from blood for RFLP studies. Nucleic Acids Res 1991;19:5444.ArticlePubMedPMC
- 25. Duarte GCK, Assmann TS, Dieter C, de Souza BM, Crispim D. GLIS3 rs7020673 and rs10758593 polymorphisms interact in the susceptibility for type 1 diabetes mellitus. Acta Diabetol 2017;54:813-21.ArticlePubMedPDF
- 26. Nguyen C, Varney MD, Harrison LC, Morahan G. Definition of high-risk type 1 diabetes HLA-DR and HLA-DQ types using only three single nucleotide polymorphisms. Diabetes 2013;62:2135-40.ArticlePubMedPMCPDF
- 27. Minelli C, Thompson JR, Abrams KR, Thakkinstian A, Attia J. The choice of a genetic model in the meta-analysis of molecular association studies. Int J Epidemiol 2005;34:1319-28.ArticlePubMed
- 28. Zintzaras E, Lau J. Synthesis of genetic association studies for pertinent gene-disease associations requires appropriate methodological and statistical approaches. J Clin Epidemiol 2008;61:634-45.ArticlePubMed
- 29. Guerder S, Joncker N, Mahiddine K, Serre L. Dendritic cells in tolerance and autoimmune diabetes. Curr Opin Immunol 2013;25:670-5.ArticlePubMed
- 30. International Multiple Sclerosis Genetics Consortium (IMSGC), Beecham AH, Patsopoulos NA, Xifara DK, Davis MF, Kemppinen A, et al. Analysis of immune-related loci identifies 48 new susceptibility variants for multiple sclerosis. Nat Genet 2013;45:1353-60.ArticlePubMedPMCPDF
- 31. Marroqui L, Dos Santos RS, Op de Beeck A, Coomans de Brachene A, Marselli L, Marchetti P, et al. Interferon-α mediates human beta cell HLA class I overexpression, endoplasmic reticulum stress and apoptosis, three hallmarks of early human type 1 diabetes. Diabetologia 2017;60:656-67.ArticlePubMedPDF
- 32. Onengut-Gumuscu S, Chen WM, Burren O, Cooper NJ, Quinlan AR, Mychaleckyj JC, et al. Fine mapping of type 1 diabetes susceptibility loci and evidence for colocalization of causal variants with lymphoid gene enhancers. Nat Genet 2015;47:381-6.ArticlePubMedPMCPDF
- 33. Mine K, Hirakawa K, Kondo S, Minami M, Okada A, Tsutsu N, et al. Subtyping of type 1 diabetes as classified by anti-GAD antibody, IgE levels, and tyrosine kinase 2 (TYK2) promoter variant in the Japanese. EBioMedicine 2017;23:46-51.ArticlePubMedPMC
- 34. Westra HJ, Martinez-Bonet M, Onengut-Gumuscu S, Lee A, Luo Y, Teslovich N, et al. Fine-mapping and functional studies highlight potential causal variants for rheumatoid arthritis and type 1 diabetes. Nat Genet 2018;50:1366-74.ArticlePubMedPMCPDF
- 35. Xia Y, Xie Z, Huang G, Zhou Z. Incidence and trend of type 1 diabetes and the underlying environmental determinants. Diabetes Metab Res Rev 2019;35:e3075.ArticlePubMedPDF
- 36. Nyaga DM, Vickers MH, Jefferies C, Perry JK, O’Sullivan JM. Type 1 diabetes mellitus-associated genetic variants contribute to overlapping immune regulatory networks. Front Genet 2018;9:535.ArticlePubMedPMC
- 37. Fujita Y, Nawata M, Nagayasu A, Someya K, Saito K, Tanaka Y. Fifty-two-week results of clinical and imaging assessments of a patient with rheumatoid arthritis complicated by systemic sclerosis with interstitial pneumonia and type 1 diabetes despite multiple disease-modifying antirheumatic drug therapy that was successfully treated with baricitinib: a novel case report. Case Rep Rheumatol 2019;2019:5293981.ArticlePubMedPMCPDF
- 38. Prieto-Pena D, Dasgupta B. Biologic agents and small-molecule inhibitors in systemic autoimmune conditions: an update. Pol Arch Intern Med 2021;131:171-81.PubMed
- 39. Wallace DJ, Furie RA, Tanaka Y, Kalunian KC, Mosca M, Petri MA, et al. Baricitinib for systemic lupus erythematosus: a double-blind, randomised, placebo-controlled, phase 2 trial. Lancet 2018;392:222-31.ArticlePubMed
- 40. Papp KA, Menter MA, Raman M, Disch D, Schlichting DE, Gaich C, et al. A randomized phase 2b trial of baricitinib, an oral Janus kinase (JAK) 1/JAK2 inhibitor, in patients with moderate-to-severe psoriasis. Br J Dermatol 2016;174:1266-76.ArticlePubMedPDF
- 41. Matsuda K. PCR-based detection methods for single-nucleotide polymorphism or mutation: real-time PCR and its substantial contribution toward technological refinement. Adv Clin Chem 2017;80:45-72.PubMed
Citations
Citations to this article as recorded by

- Associations of genetic variants within TYK2 with pulmonary tuberculosis among Chinese population
Mingwu Zhang, Zhengwei Liu, Yelei Zhu, Kunyang Wu, Lin Zhou, Ying Peng, Junhang Pan, Bin Chen, Xiaomeng Wang, Songhua Chen
Molecular Genetics & Genomic Medicine.2024;[Epub] CrossRef - Host genetic variants associated with COVID-19 reconsidered in a Slovak cohort
Maria Skerenova, Michal Cibulka, Zuzana Dankova, Veronika Holubekova, Zuzana Kolkova, Vincent Lucansky, Dana Dvorska, Andrea Kapinova, Michaela Krivosova, Martin Petras, Eva Baranovicova, Ivana Baranova, Elena Novakova, Peter Liptak, Peter Banovcin, Anna
Advances in Medical Sciences.2024; 69(1): 198. CrossRef - Cross-Domain Text Mining of Pathophysiological Processes Associated with Diabetic Kidney Disease
Krutika Patidar, Jennifer H. Deng, Cassie S. Mitchell, Ashlee N. Ford Versypt
International Journal of Molecular Sciences.2024; 25(8): 4503. CrossRef

 , Cristine Dieter1,2, Guilherme Coutinho Kullmann Duarte1,2, Luís Henrique Canani1,2, Bianca Marmontel de Souza1,2, Daisy Crispim1,2
 PubReader
 ePub Link
 Cite
Cite


