
- Current
- Browse
- Collections
-
For contributors
- For Authors
- Instructions to authors
- Article processing charge
- e-submission
- For Reviewers
- Instructions for reviewers
- How to become a reviewer
- Best reviewers
- For Readers
- Readership
- Subscription
- Permission guidelines
- About
- Editorial policy
Articles
- Page Path
- HOME > Diabetes Metab J > Volume 44(4); 2020 > Article
-
Original ArticleDrug/Regimen Switching to Once-Daily Insulin Degludec/Insulin Aspart from Basal Insulin Improves Postprandial Glycemia in Patients with Type 2 Diabetes Mellitus: Randomized Controlled Trial
-
Kyu Yong Cho1,2
 , Akinobu Nakamura1, Chiho Oba-Yamamoto1, Kazuhisa Tsuchida1, Shingo Yanagiya1, Naoki Manda3, Yoshio Kurihara4, Shin Aoki5, Tatsuya Atsumi1, Hideaki Miyoshi1,6
 -
Diabetes & Metabolism Journal 2020;44(4):532-541.
DOI: https://doi.org/10.4093/dmj.2019.0093
Published online: November 22, 2019
1Department of Rheumatology, Endocrinology and Nephrology, Faculty of Medicine and Graduate School of Medicine, Hokkaido University, Sapporo, Japan.
2Clinical Research and Medical Innovation Center, Hokkaido University Hospital, Sapporo, Japan.
3Manda Memorial Hospital, Sapporo, Japan.
4Kurihara Clinic, Sapporo, Japan.
5Aoki Clinic, Sapporo, Japan.
6Division of Diabetes and Obesity, Faculty of Medicine and Graduate School of Medicine, Hokkaido University, Sapporo, Japan.
- Corresponding author: Hideaki Miyoshi. Division of Diabetes and Obesity, Faculty of Medicine and Graduate School of Medicine, Hokkaido University, N15 W7, Kita-ku, Sapporo 060-8638, Japan. hmiyoshi@med.hokudai.ac.jp
Copyright © 2020 Korean Diabetes Association
This is an Open Access article distributed under the terms of the Creative Commons Attribution Non-Commercial License (http://creativecommons.org/licenses/by-nc/4.0/) which permits unrestricted non-commercial use, distribution, and reproduction in any medium, provided the original work is properly cited.
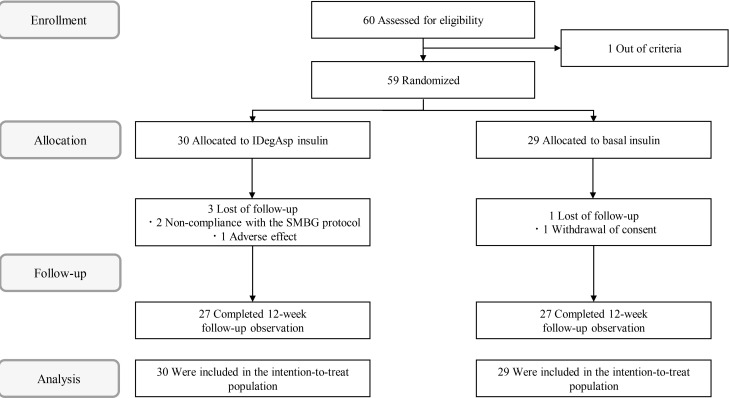
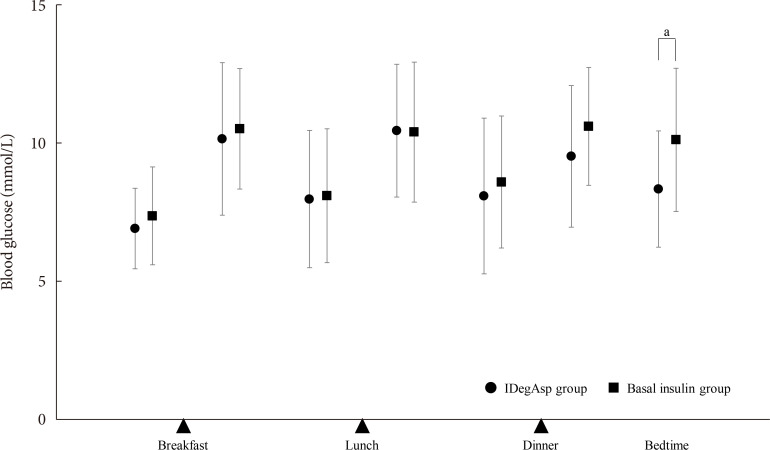
Figure & Data
References
Citations
- Glycaemic outcomes in hospital with IDegAsp versus BIAsp30 premixed insulins
Joshua R. Walt, Julie Loughran, Spiros Fourlanos, Rahul D. Barmanray, Jasmine Zhu, Suresh Varadarajan, Mervyn Kyi
Internal Medicine Journal.2024;[Epub] CrossRef - Low fasting glucose‐to‐estimated average glucose ratio was associated with superior response to insulin degludec/aspart compared with basal insulin in patients with type 2 diabetes
Han Na Jang, Ye Seul Yang, Tae Jung Oh, Bo Kyung Koo, Seong Ok Lee, Kyong Soo Park, Hak Chul Jang, Hye Seung Jung
Journal of Diabetes Investigation.2022; 13(1): 85. CrossRef - Comparing time to intensification between insulin degludec/insulin aspart and insulin glargine: A single-center experience from India
Rajiv Kovil
Journal of Diabetology.2022; 13(2): 171. CrossRef - Use of Insulin Degludec/Insulin Aspart in the Management of Diabetes Mellitus: Expert Panel Recommendations on Appropriate Practice Patterns
Tevfik Demir, Serap Turan, Kursad Unluhizarci, Oya Topaloglu, Tufan Tukek, Dilek Gogas Yavuz
Frontiers in Endocrinology.2021;[Epub] CrossRef - Pharmacoeconomic comparison of the second generation insulin analogs and insulins on their base
I. N. Dyakov, S. K. Zyryanov
Kachestvennaya Klinicheskaya Praktika = Good Clinical Practice.2021; 20(1): 4. CrossRef - Efficacy and Safety of Insulin Degludec/Insulin Aspart Compared with a Conventional Premixed Insulin or Basal Insulin: A Meta-Analysis
Shinje Moon, Hye-Soo Chung, Yoon-Jung Kim, Jae-Myung Yu, Woo-Ju Jeong, Jiwon Park, Chang-Myung Oh
Metabolites.2021; 11(9): 639. CrossRef - Insulin therapy in diabetic kidney disease
Yan Liu, Chanyue Zhao, Xiaofen Xiong, Ming Yang, Lin Sun
Diabetic Nephropathy.2021; 1(2): 67. CrossRef - Indirect comparison of efficacy and safety of insulin glargine/lixisenatide and insulin degludec/insulin aspart in type 2 diabetes patients not controlled on basal insulin
Anwar Ali Jammah
Primary Care Diabetes.2020;[Epub] CrossRef
 PubReader
 ePub Link
 Cite
Cite


