- Current
- Browse
- Collections
-
For contributors
- For Authors
- Instructions to authors
- Article processing charge
- e-submission
- For Reviewers
- Instructions for reviewers
- How to become a reviewer
- Best reviewers
- For Readers
- Readership
- Subscription
- Permission guidelines
- About
- Editorial policy
Articles
- Page Path
- HOME > Diabetes Metab J > Volume 39(6); 2015 > Article
-
Original ArticleClinical Care/Education Insulin Initiation in Insulin-Naïve Korean Type 2 Diabetic Patients Inadequately Controlled on Oral Antidiabetic Drugs in Real-World Practice: The Modality of Insulin Treatment Evaluation Study
- Sang Soo Kim1,2, In Joo Kim1,2, Yong Ki Kim3, Kun Ho Yoon4, Ho Young Son5, Sung Woo Park6, Yeon Ah Sung7, Hong Sun Baek8
-
Diabetes & Metabolism Journal 2015;39(6):481-488.
DOI: https://doi.org/10.4093/dmj.2015.39.6.481
Published online: November 25, 2015
1Department of Internal Medicine, Pusan National University Hospital, Pusan National University School of Medicine, Busan, Korea.
2Biomedical Research Institute, Pusan National University Hospital, Pusan National University School of Medicine, Busan. Korea.
3Kim Yong Ki Internal Medicine Clinic, Busan, Korea.
4Department of Internal Medicine, Seoul St. Mary's Hospital, College of Medicine, The Catholic University of Korea, Seoul, Korea.
5Department of Internal Medicine, Hallym University Kangdong Sacred Heart Hospital, Hallym University College of Medicine, Seoul, Korea.
6Department of Endocrinology and Metabolism, Kangbuk Samsung Hospital, Sungkyunkwan University School of Medicine, Seoul, Korea.
7Department of Internal Medicine, Ewha Womans University School of Medicine, Seoul, Korea.
8Department of Internal Medicine, Chonbuk National University Medical School, Jeonju, Korea.
- Corresponding author: In Joo Kim. Division of Endocrinology and Metabolism, Department of Internal Medicine, Pusan National University Hospital, Pusan National University School of Medicine, 179 Gudeok-ro, Seo-gu, Busan 49241, Korea. injkim@pusan.ac.kr
Copyright © 2015 Korean Diabetes Association
This is an Open Access article distributed under the terms of the Creative Commons Attribution Non-Commercial License (http://creativecommons.org/licenses/by-nc/3.0/) which permits unrestricted non-commercial use, distribution, and reproduction in any medium, provided the original work is properly cited.
ABSTRACT
-
Background
- The Modality of Insulin Treatment Evaluation (MOTIV) study was performed to provide real-world data concerning insulin initiation in Korean type 2 diabetes mellitus (T2DM) patients with inadequate glycemic control with oral hypoglycemic agents (OHAs).
-
Methods
- This multicenter, non-interventional, prospective, observational study enrolled T2DM patients with inadequate glycemic control (glycosylated hemoglobin [HbA1c] ≥7.0%) who had been on OHAs for ≥3 months and were already decided to introduce basal insulin by their physician prior to the start of the study. All treatment decisions were at the physician's discretion to reflect real-world practice.
-
Results
- A total of 9,196 patients were enrolled, and 8,636 patients were included in the analysis (mean duration of diabetes, 8.9 years; mean HbA1c, 9.2%). Basal insulin plus one OHA was the most frequently (51.0%) used regimen. After 6 months of basal insulin treatment, HbA1c decreased to 7.4% and 44.5% of patients reached HbA1c <7%. Body weight increased from 65.2 kg to 65.5 kg, which was not significant. Meanwhile, there was significant increase in the mean daily insulin dose from 16.9 IU at baseline to 24.5 IU at month 6 (P<0.001). Overall, 17.6% of patients experienced at least one hypoglycemic event.
-
Conclusion
- In a real-world setting, the initiation of basal insulin is an effective and well-tolerated treatment option in Korean patients with T2DM who are failing to meet targets with OHA therapy.
- In 2011, an estimated 4 million patients were diagnosed with diabetes mellitus in Korea, and the number will increase to approximately 5.9 million in 2050 [1]. Most organizations, including the Korean Diabetes Association (KDA), generally recommend a glycosylated hemoglobin (HbA1c) target of 6.5% (48 mmol/mol) to 7.0% (53 mmol/mol) for preventing microvascular and macrovascular complications in patients with type 2 diabetes mellitus (T2DM) [23]. Recent Korean data indicates that only 45.6% of Korean patients with T2DM achieved the American Diabetes Association (ADA) recommended target of HbA1c <7.0%, and only 27% attained the International Diabetes Federation and KDA recommended target of HbA1c <6.5% [4].
- A number of studies, including the United Kingdom Prospective Diabetes Study, have demonstrated that tight glycemic control can decrease the chronic complications of T2DM, leading to a decrease in the associated morbidity and mortality [56]. In T2DM, a gradual impairment of pancreatic function is consequently followed by the depletion of insulin secretion. Therefore, insulin therapy is required to achieve clinically meaningful long-term glycemic control. The fasting blood glucose (FBG) target can be achieved more easily with insulin than with oral hypoglycemic agents (OHAs) [7]. Furthermore, insulin is known to suppress basal hepatic glucose production and to protect pancreatic β-cells [278].
- Despite the demonstrated benefits of insulin therapy and existing recommendations in the guidelines for the timely initiation of insulin therapy, evidence suggests that insulin utilization and glycemic control remain suboptimal. The Korea National Health and Nutrition Examination Survey V (2010 to 2012) reported that only 11% of patients with diabetes mellitus were treated with insulin [4]. In the Hong Kong Diabetes Registry, most Chinese patients (60.3%) with T2DM had HbA1c >7.0%, although many were receiving multiple OHAs [9]. Moreover, the proportion of patients on OHAs with inadequate glycemic control (HbA1c ≥7%) increased as the duration of T2DM increased; from 23.7% of patients with T2DM for <5 years to 75.9% of patients with a disease duration ≥20 years. In another Asian registry of T2DM patients initiating insulin, the mean HbA1c level was 9.8%±1.6%, and the mean duration of diabetes was 9.3±6.5 years [10]. These studies indicate a delay in the timely initiation of insulin therapy, reflecting a large gap between treatment guidelines and real-world practice [910].
- While T2DM is a condition marked by the progressive deterioration of pancreatic function, evidence clearly shows that timely insulin initiation can help alleviate many of the subsequent chronic effects of T2DM. However, evidence indicates a tendency to delay insulin initiation leading to poor glycemic control in Asian patients with T2DM [11]. While data from historic clinical trials from Korea may demonstrate the benefits of insulin therapy [12], there is no current data available to examine insulin initiation in real-world clinical practice.
- The Modality of Insulin Treatment Evaluation (MOTIV) study was conducted to assess the effect of insulin initiation in Korean patients who were inadequately controlled on OHAs. The primary objective of this study was to explore the glucose-lowering effect of basal insulin therapy and its different regimens in T2DM patients inadequately controlled with OHAs in a real-world clinical setting. The secondary objective was to investigate the effects of different regimens containing basal insulin and concomitant anti-diabetes medications on plasma glucose levels (fasting and postprandial), body weight, insulin dose, and the occurrence of hypoglycemic event during the study.
INTRODUCTION
- Study design and population
- The MOTIV study was designed as a multicenter, non-interventional, prospective, observational study to investigate disease management practices using insulin in insulin-naïve Korean T2DM patients with inadequate glycemic control. Patients with T2DM were enrolled from 566 geographically representative centers in South Korea from May 2007 to February 2009, as previously described [13]. Of the included centers, 22.7% (129/566) were endocrinology centers, and 77.3% (437/566) were internal medicine centers. Overall, 9,196 patients were enrolled in the MOTIV study. The study was approved by the institutional ethics committees of each participating center.
- Patients were eligible for the study if they were insulin-naïve and on OHA therapy for at least 3 months, had HbA1c levels ≥7.0%, had a clinical assessment for their suitability for basal insulin initiation performed by their physicians prior to recruitment, and had provided informed consent. At baseline, the study patients were prescribed either basal insulin alone or basal insulin in combination with one or more OHA, or a short acting insulin. The clinical decisions regarding the choice, duration, and changes in the existing or prospective therapy were based solely on the judgment of the investigator. There was no specific intervention for treatment such as life style change after the initiation of basal insulin. To investigate the effects of different regimens containing basal insulin and concomitant diabetes medications, the patients were stratified into basal insulin only (group A), basal insulin plus one OHA (group B), basal insulin plus two or more OHAs (group C), and basal insulin plus short acting insulin (group D) groups.
- Data collection
- The collected data included the patients' demographics, medical histories, anthropometric data, blood analysis for glycemic control parameters (HbA1c, FBG, and 2-hour postprandial glucose [PPG2hr]), existing and new regimens targeting HbA1c levels, and hypoglycemic events. These data were collected from the patients' medical records at baseline (start of insulin prescription), and 3 and 6 months post-baseline by the investigators using a case report form. Glycemic control was determined by measuring HbA1c; and changes in the blood glucose levels (fasting and postprandial), body weight, insulin doses, and the incidence of hypoglycemic events were noted. The definition of hypoglycemia used in this study was as follows: (1) the relief of hypoglycemic symptoms after the administration of glucose or carbohydrates; (2) a blood glucose level below 56 mg/dL regardless of hypoglycemic symptoms.
- Statistical analyses
- Descriptive statistics were used to evaluate the patient data. The qualitative parameters were summarized by frequencies and percentages, and the quantitative parameters were assessed as the frequency, mean, standard deviation, median, and range. All statistical tests were performed at a significance level of 5% using two-sided tests. Differences within and between the groups were analyzed using analysis of covariance. The software used for all statistical analysis was SAS version 9.1 (SAS Institute, Cary, NC, USA).
METHODS
- Baseline demographics
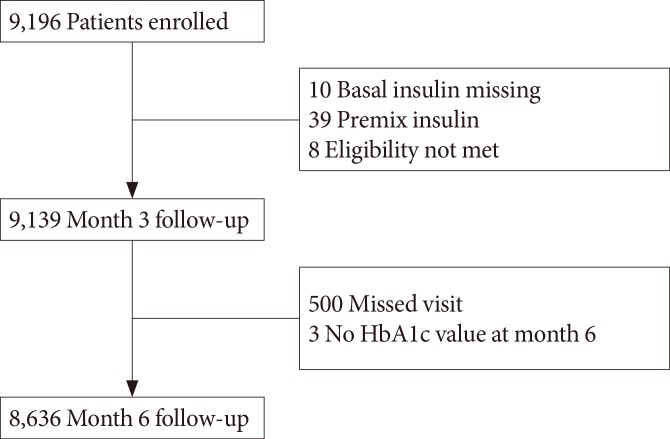
- Of the total 9,196 patients, data from 8,636 patients were analyzed. A total of 560 patients were excluded from the analysis because either they did not meet the inclusion criteria (57 patients), they were lost follow-up (500 patients), or their glycemic parameters were not recorded (three patients) (Fig. 1). In the study population, 54.4% subjects were men. The mean age of the population was 58.1 years, the mean HbA1c was 9.2%, and the mean duration of diabetes was 8.9 years. Most of the patients in this study were prescribed insulin glargine for basal insulin. Insulin detemir and Neutral Protamine Hagedorn (NPH) were prescribed for 2 (0.02%) and 10 patients (0.12%) out of the 8,636 total patients, respectively. Previous OHA therapy (prior to initiation of basal insulin) included sulphonylurea (83.6%), metformin (65.5%), α-glucosidase inhibitor (20.8%), thiazolidinedione (10.4%), and meglitinide (7.0%) (Table 1). Sulfonylurea and meglitinide were the least frequently prescribed to patients in group D before insulin was started (Table 1).
- During the baseline visit, the most commonly prescribed regimen was basal insulin with a single OHA (group B, 51.0% patients) followed by basal insulin with two or more OHAs (group C, 30.8%), basal insulin only (group A, 16.6%), and basal insulin plus short acting insulin (group D, 1.6%). There were differences in the demographic and anthropometric measures across groups receiving different treatment options. The lowest mean age at insulin initiation was seen in group D (54.2±14.0 years) and the mean duration of diabetes was longest in group C. The mean body mass index and body weight were lowest in group D (23.1±4.1 kg/m2 and 62.4±12.7 kg, respectively) and highest in group C (24.6±2.9 kg/m2 and 65.8±10.6 kg, respectively). The mean HbA1c was highest in group D (10.4%±2.0%) followed by group C (9.4%±1.5%), B (9.1%±1.4%), and A (8.9%±1.4%).
- Overall effectiveness and safety
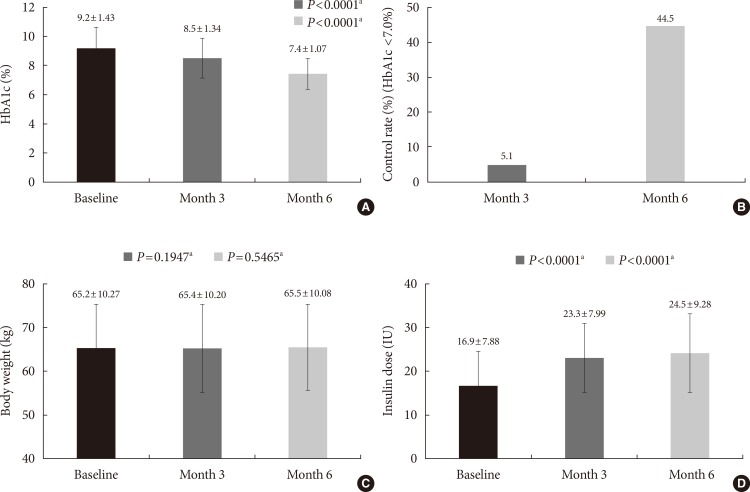
- The mean HbA1c in the study population significantly decreased from 9.2% at baseline to 8.5% at month 3 and to 7.4% at month 6. The differences in HbA1c from baseline to both time-points were significant (P<0.0001). At month 6, 44.5% of patients achieved HbA1c <7% (Fig. 2). Body weight at baseline was 65.2 kg and changed to 65.4 kg and 65.5 kg at month 3 and 6, respectively. These changes were not significant. There was significant increase in the mean daily insulin dose from 16.9 U (0.26 U/kg) at baseline to 23.3 U (0.36 U/kg) at month 3 and to 24.5 U (0.37 U/kg) at month 6 (compared to baseline at both time-points, P<0.0001). During the study period, 1,518 patients (17.6%) experienced at least one hypoglycemic event, and the total number of hypoglycemic events was 4,311, most commonly observed in group B followed by group C (Table 2).
- Subgroup analysis
- A similar trend of intergroup variation was observed in the FBG and PPG2hr levels. The largest reductions in HbA1c and FBG levels were observed in group D. The insulin dose became similar between groups at week 24 (P=0.3211) (Fig. 3). The proportion of patients who experienced at least one hypoglycemic event was highest in group D and lowest in group A (P<0.0001) (Table 2). In addition, we analyzed the results according to the type of clinic (endocrinology vs. internal medicine) (Table 3). The patients treated in endocrinology centers had higher HbA1c levels compared to those treated in internal medicine centers at baseline (9.3% vs. 9.1%, P<0.001). Although the patients from endocrinology centers had higher HbA1c levels 6 months after initiating insulin (7.6% vs. 7.2%, P<0.001), the proportion achieving HbA1c <7% was higher in patients from endocrinology centers compared to those from internal medicine centers at 6 months (59.8% vs. 51.1%, P<0.001).
RESULTS
- The results of the MOTIV study indicate that in Korean patients with T2DM uncontrolled on OHA therapy, the initiation of basal insulin provides clinically meaningful improvements in glycemic control. However, the current study also shows that the initiation of insulin therapy in Korea is delayed, despite its demonstrated clinical benefits and the recommendations of international treatment guidelines [21415].
- This study included T2DM patients with inadequate glycemic control, with a mean HbA1c level of 9.2%, and a mean duration of diabetes of 8.9 years prior to the initiation of basal insulin. This shows that insulin initiation is delayed in Korea, regardless of the evolving treatment guidelines [214]. This finding is confirmed by evidences from previous studies. In the Cardiovascular Risk Evaluation in People with Type 2 Diabetes on Insulin Therapy registry of 3,031 patients, the mean duration of diabetes was 11 years and the HbA1c level at baseline was 9.5% [16]. The First Insulinization with Basal Insulin in Patients with Type 2 Diabetes in a Real-world setting in Asia (FINEASIA) study included patients with a mean duration of diabetes of 9.3 years and a mean HbA1c level of 9.8%. Evidence from these studies indicate that insulin initiation is often delayed, exposing patients to many years of uncontrolled hyperglycemia.
- The initiation of basal insulin in the current study resulted in a statistically and clinically significant reduced HbA1c levels from 9.2% to 7.4% in 6 months. In addition, approximately 44% of patients achieved the ADA-recommended HbA1c target of <7%. The mean insulin dose of 0.37 U/kg prescribed at month 6 was relatively lower compared to other studies in Western populations. In the Treat-to-Target study of North American patients with T2DM, the mean change in HbA1c was approximately -1.6% over 6 months with insulin doses of 0.48 U/kg (47.2 IU) for insulin glargine and 0.42 U/kg (41.8 IU) for NPH insulin [8].
- There were also several notable variations in the demographic characteristics of the study population across treatment groups. Group D had the poorest glycemic control, despite having the youngest population with the lowest mean body weight. The use of sulfonylurea and metformin at baseline was also less common in this group. Considering the observational nature of this study, it can be speculated that physicians tend to initiate the most complex insulin regimens in patients with the worst glycemic profile not appropriately controlled with OHAs. There is also possibility that more latent autoimmune diabetes of adults patients might be included in this group compared to other groups, although this cannot be confirmed.
- Interestingly, varying levels of HbA1c across treatment groups, including the highest HbA1c levels seen in group D at baseline, converged around a mean value after 6 months of respective treatments. This convergence to a certain HbA1c level has been observed in other studies with a treat-to-target strategy [817]. Thus, an HbA1c level aim for of 7% seems to be an ideal target for Korean physicians to aim in patients with T2DM.
- The analysis results stratified by clinic type provide us with interesting information in this study. As the patients from endocrinology centers are considered to have longer durations of diabetes and more complicated conditions, it is reasonable that they had higher glucose levels compared to those from internal medical centers both initially and at 6 months after being insulin treatment. Although a larger proportion of patients of endocrinologists reached the glycemic target (HbA1c <7%) compared to those of general internal medicine doctors, primary physicians without specialties led more than half of their patients in achieving this target after the initiation of basal insulin.
- There are several noteworthy considerations while assessing the results of the current study. The major advantages of a registry are the potential for larger-scale trials with greater numbers of patients and the ability to monitor therapy under "real-world" conditions that may better reflect how treatment is used in clinical practice. The MOTIV study was able to recruit a large number of patients with unacceptably high HbA1c levels for assessing possible treatment modification and intensification modalities [15]. However, registry studies are not randomized, and the characteristics of patients receiving the different treatment modalities may not be consistent; there may also be differences within regimens. Thus, conclusions regarding the comparative efficacy of each regimen cannot be drawn from the present study. Furthermore, initiation of the appropriate insulin dose was determined by a physician, which may also have led to procedural variations. In addition, type 2 diabetic patients were enrolled based on clinician's judgment rather than definitive criteria such as autoantibodies and C-peptide. Although these are potential limitations to the study analysis, they are reflective of "real-world" clinical practice, which was a key aspect of the present study. This study was conducted from 2007 to 2009, when incretin therapies including dipeptidyl peptidase-4 inhibitors were not commonly used in Korea. Therefore, the results of this study might not reflect recent clinical understandings of such factors as the duration of diabetes in influencing the initiation of insulin.
- The applicability of the results can be assessed by the concurrence of the findings from the current study with those from prior registry studies that indicate insulin initiation is delayed and glycemic control is suboptimal in Asian patients with T2DM [214]. The evidence from the current study lends credence to the observation that in a real-world setting, the initiation of basal insulin is an effective and well-tolerated treatment option in Korean T2DM patients with inadequate glycemic control on OHA therapy.
DISCUSSION
- 1. Jeon JY, Ko SH, Kwon HS, Kim NH, Kim JH, Kim CS, Song KH, Won JC, Lim S, Choi SH, Jang MJ, Kim Y, Oh K, Kim DJ, Cha BY. Taskforce Team of Diabetes Fact Sheet of the Korean Diabetes Association. Prevalence of diabetes and prediabetes according to fasting plasma glucose and HbA1c. Diabetes Metab J 2013;37:349-357. ArticlePubMedPMC
- 2. Asian-Pacific Type 2 Diabetes Policy Group. Western Pacific Region of IDF: Type 2 diabetes: practical targets and treatments cited 2015 Oct 8. Available from:http://www.idf.org/webdata/docs/T2D_practical_tt.pdf.
- 3. American Diabetes Association. Standards of medical care in diabetes: 2014. Diabetes Care 2014;37(Suppl 1):S14-S80. ArticlePubMedPDF
- 4. Jeon JY, Kim DJ, Ko SH, Kwon HS, Lim S, Choi SH, Kim CS, An JH, Kim NH, Won JC, Kim JH, Cha BY, Song KH. Taskforce Team of Diabetes Fact Sheet of the Korean Diabetes Association. Current status of glycemic control of patients with diabetes in Korea: the fifth Korea National Health and Nutrition Examination Survey. Diabetes Metab J 2014;38:197-203. ArticlePubMedPMC
- 5. Turner RC, Cull CA, Frighi V, Holman RR. Glycemic control with diet, sulfonylurea, metformin, or insulin in patients with type 2 diabetes mellitus: progressive requirement for multiple therapies (UKPDS 49). UK Prospective Diabetes Study (UKPDS) Group. JAMA 1999;281:2005-2012. ArticlePubMed
- 6. UK Prospective Diabetes Study (UKPDS) Group. Intensive blood-glucose control with sulphonylureas or insulin compared with conventional treatment and risk of complications in patients with type 2 diabetes (UKPDS 33). Lancet 1998;352:837-853. ArticlePubMed
- 7. Jabbour S. Primary care physicians and insulin initiation: multiple barriers, lack of knowledge or both. Int J Clin Pract 2008;62:845-847. ArticlePubMed
- 8. Riddle MC, Rosenstock J, Gerich J. Insulin Glargine 4002 Study Investigators. The treat-to-target trial: randomized addition of glargine or human NPH insulin to oral therapy of type 2 diabetic patients. Diabetes Care 2003;26:3080-3086. PubMed
- 9. Wahlqvist ML. Nutrition and diabetes in the Asia-Pacific region with reference to cardiovascular disease. Asia Pac J Clin Nutr 2001;10:90-96. ArticlePubMed
- 10. Tong PC, Ko GT, So WY, Chiang SC, Yang X, Kong AP, Ozaki R, Ma RC, Cockram CS, Chow CC, Chan JC. Use of anti-diabetic drugs and glycaemic control in type 2 diabetes: The Hong Kong Diabetes Registry. Diabetes Res Clin Pract 2008;82:346-352. ArticlePubMed
- 11. Tsai ST, Pathan F, Ji L, Yeung VT, Chadha M, Suastika K, Son HS, Tan KE, Benjasuratwong Y, Nguyen TK, Iqbal F. First insulinization with basal insulin in patients with type 2 diabetes in a real-world setting in Asia. J Diabetes 2011;3:208-216. ArticlePubMedPMC
- 12. Pan CY, Sinnassamy P, Chung KD, Kim KW. LEAD Study Investigators Group. Insulin glargine versus NPH insulin therapy in Asian type 2 diabetes patients. Diabetes Res Clin Pract 2007;76:111-118. ArticlePubMed
- 13. Kim SS, Kim IJ, Kim YK, Yoon KH, Son HY, Park SW, Sung YA, Baek HS, Ha KS. Duration of diabetes and effectiveness of insulin in the management of insulin-naive Korean patients uncontrolled on oral antidiabetic drugs: a sub-analysis of the MOdaliTy of Insulin treatment eValuation (MOTIV) registry results. Acta Diabetol 2014;51:655-661. ArticlePubMedPDF
- 14. International Diabetes Federation: Global guideline for type 2 diabetes 2015;10 08 Available from: http://www.idf.org/sites/default/files/IDF-Guideline-for-Type-2-Diabetes.pdf.
- 15. Inzucchi SE, Bergenstal RM, Buse JB, Diamant M, Ferrannini E, Nauck M, Peters AL, Tsapas A, Wender R, Matthews DR. American Diabetes Association (ADA). European Association for the Study of Diabetes (EASD). Management of hyperglycemia in type 2 diabetes: a patient-centered approach: position statement of the American Diabetes Association (ADA) and the European Association for the Study of Diabetes (EASD). Diabetes Care 2012;35:1364-1379. ArticlePubMedPMCPDF
- 16. Marre M, Danchin N, Freemantle N, Balkau B, Admane K, Blonde L, Home P. Cardiovascular Risk evaluation in people with type 2 diabetes (T2D) on insulin therapy (CREDIT) study: patterns of initial prescription of insulin and associated changes in oral glucose-lowering drug (OGLD) therapy. Diabetes 2009;58:A126.
- 17. Fritsche A, Schweitzer MA, Haring HU, Study G. Glimepiride combined with morning insulin glargine, bedtime neutral protamine hagedorn insulin, or bedtime insulin glargine in patients with type 2 diabetes. A randomized, controlled trial. Ann Intern Med 2003;138:952-959. ArticlePubMed
REFERENCES
(A) Glycosylated hemoglobin (HbA1c), (B) control rate (HbA1c <7%), (C) body weight, and (D) insulin dose at baseline, month 3 and 6. aAll P values are compared to baseline.

(A) Glycosylated hemoglobin (HbA1c), (B) fasting blood glucose (FBG), (C) body weight, and (D) insulin dose at base, month 3 and 6 by groups. Group A: basal insulin only, group B: basal insulin+1 oral hypoglycemic agent (OHA), group C: basal insulin+≥2 OHAs, and group D: basal insulin+short acting insulin. All P values compared the difference between groups at week 24.

Patient characteristics at baseline stratified by the concomitant diabetes medications
Values are presented as number (%) or mean±standard deviation. Group A: basal insulin only, group B: basal insulin+1 OHA, group C: basal insulin+≥2 OHAs, and group D: basal insulin+short acting insulin.
BMI, body mass index; HbA1c, glycosylated hemoglobin; FBG, fasting blood glucose; PP2BG, postprandial 2-hour blood glucose.
Hypoglycemic events stratified by the concomitant diabetes medications
The subgroup analysis according to the type of clinic (endocrinology centers versus internal medicine centers)
Figure & Data
References
Citations
- Real-World Outcomes of Individualized Targeted Therapy with Insulin Glargine 300 Units/mL in Insulin-Naïve Korean People with Type 2 Diabetes: TOBE Study
Eun-Gyoung Hong, Kyung-Wan Min, Jung Soo Lim, Kyu-Jeung Ahn, Chul Woo Ahn, Jae-Myung Yu, Hye Soon Kim, Hyun Jin Kim, Won Kim, Dong Han Kim, Hak Chul Jang
Advances in Therapy.2024;[Epub] CrossRef - Clinical Evidence and Practice-Based Guidelines on the Utility of Basal
Insulin Combined Oral Therapy (Metformin and Glimepiride) in the
Current Era
Abhishek Shrivastava, Jothydev Kesavadev, Viswanathan Mohan, Banshi Saboo, Dina Shrestha, Anuj Maheshwari, Brij Mohan Makkar, Kirtikumar D. Modi, Ashok Kumar Das
Current Diabetes Reviews.2023;[Epub] CrossRef - Where to Initiate Basal Insulin Therapy: Inpatient or Outpatient Department? Real-World Observation in China
Minyuan Chen, Puhong Zhang, Yang Zhao, Nadila Duolikun, Linong Ji
Diabetes, Metabolic Syndrome and Obesity: Targets and Therapy.2022; Volume 15: 3375. CrossRef - Therapeutic Effect of Quadruple Oral Hypoglycemic Agents in Patients with Type 2 Diabetes Mellitus Who Have Insulin Limitations
Won Sang Yoo, Do Hee Kim, Hee Jin Kim, Hyun Kyung Chung
The Journal of Korean Diabetes.2019; 20(2): 117. CrossRef - Use of Insulin Glargine 100 U/mL for the Treatment of Type 2 Diabetes Mellitus in East Asians: A Review
Takahisa Hirose, Ching-Chu Chen, Kyu Jeung Ahn, Jacek Kiljański
Diabetes Therapy.2019; 10(3): 805. CrossRef - Nationwide Trends in Pancreatitis and Pancreatic Cancer Risk Among Patients With Newly Diagnosed Type 2 Diabetes Receiving Dipeptidyl Peptidase 4 Inhibitors
Minyoung Lee, Jiyu Sun, Minkyung Han, Yongin Cho, Ji-Yeon Lee, Chung Mo Nam, Eun Seok Kang
Diabetes Care.2019; 42(11): 2057. CrossRef - Insulin therapy for adult patients with type 2 diabetes mellitus: a position statement of the Korean Diabetes Association, 2017
Byung-Wan Lee, Jin Hwa Kim, Seung-Hyun Ko, Kyu Yeon Hur, Nan-Hee Kim, Sang Youl Rhee, Hyun Jin Kim, Min Kyong Moon, Seok-O Park, Kyung Mook Choi
The Korean Journal of Internal Medicine.2017; 32(6): 967. CrossRef - Insulin Therapy for Adult Patients with Type 2 Diabetes Mellitus: A Position Statement of the Korean Diabetes Association, 2017
Byung-Wan Lee, Jin Hwa Kim, Seung-Hyun Ko, Kyu-Yeon Hur, Nan-Hee Kim, Sang Youl Rhee, Hyun Jin Kim, Min Kyong Moon, Seok-O Park, Kyung Mook Choi
Diabetes & Metabolism Journal.2017; 41(5): 367. CrossRef - Effectiveness of Vildagliptin in Clinical Practice: Pooled Analysis of Three Korean Observational Studies (the VICTORY Study)
Sunghwan Suh, Sun Ok Song, Jae Hyeon Kim, Hyungjin Cho, Woo Je Lee, Byung-Wan Lee
Journal of Diabetes Research.2017; 2017: 1. CrossRef - Comparison of Antidiabetic Regimens in Patients with Type 2 Diabetes Uncontrolled by Combination Therapy of Sulfonylurea and Metformin: Results of the MOHAS Disease Registry in Korea
Sung Hee Choi, Tae Jung Oh, Hak Chul Jang
Diabetes & Metabolism Journal.2017; 41(3): 170. CrossRef - Instauration d’une insulinothérapie chez le patient diabétique de type 2 en médecine générale : Comparaison de l’étude belge InsuStar avec quelques études françaises et internationales
A.-J. Scheen
Médecine des Maladies Métaboliques.2016; 10(4): 334. CrossRef
 PubReader
 Cite
Cite