
- Current
- Browse
- Collections
-
For contributors
- For Authors
- Instructions to authors
- Article processing charge
- e-submission
- For Reviewers
- Instructions for reviewers
- How to become a reviewer
- Best reviewers
- For Readers
- Readership
- Subscription
- Permission guidelines
- About
- Editorial policy
Articles
- Page Path
- HOME > Diabetes Metab J > Ahead-of print > Article
-
Original ArticleMetabolic Risk/Epidemiology A Composite Blood Biomarker Including AKR1B10 and Cytokeratin 18 for Progressive Types of Nonalcoholic Fatty Liver Disease
-
Seung Joon Choi1*
 , Sungjin Yoon1*, Kyoung-Kon Kim2, Doojin Kim3, Hye Eun Lee4, Kwang Gi Kim5, Seung Kak Shin4, Ie Byung Park4, Seong Min Kim3, Dae Ho Lee4
 -
DOI: https://doi.org/10.4093/dmj.2023.0189
Published online: February 1, 2024
- 758 Views
- 44 Download
1Department of Radiology, Gachon University Gil Medical Center, Gachon University College of Medicine, Incheon, Korea
2Department of Family Medicine, Gachon University Gil Medical Center, Gachon University College of Medicine, Incheon, Korea
3Department of Surgery, Gachon University Gil Medical Center, Gachon University College of Medicine, Incheon, Korea
4Department of Internal Medicine, Gachon University Gil Medical Center, Gachon University College of Medicine, Incheon, Korea
5Department of Biomedical Engineering, Gachon University Gil Medical Center, Gachon University College of Medicine, Incheon, Korea
- Corresponding authors: Seong Min Kim Department of Surgery, Gachon University Gil Medical Center, Gachon University College of Medicine, 21 Namdong-daero 774beon-gil, Namdong-gu, Incheon 21565, Korea E-mail: seongmin_kim@gilhospital.com
- Dae Ho Lee Department of Internal Medicine, Gachon University Gil Medical Center, Gachon University College of Medicine, 21 Namdong-daero 774beon-gil, Namdong-gu, Incheon 21565, Korea E-mail: drhormone@naver.com
- *Seung Joon Choi and Sungjin Yoon contributed equally to this study as first authors.
Copyright © 2024 Korean Diabetes Association
This is an Open Access article distributed under the terms of the Creative Commons Attribution Non-Commercial License (http://creativecommons.org/licenses/by-nc/4.0/) which permits unrestricted non-commercial use, distribution, and reproduction in any medium, provided the original work is properly cited.
ABSTRACT
-
Background
- We aimed to evaluate whether composite blood biomarkers including aldo-keto reductase family 1 member B10 (AKR1B10) and cytokeratin 18 (CK-18; a nonalcoholic steatohepatitis [NASH] marker) have clinically applicable performance for the diagnosis of NASH, advanced liver fibrosis, and high-risk NASH (NASH+significant fibrosis).
-
Methods
- A total of 116 subjects including healthy control subjects and patients with biopsy-proven nonalcoholic fatty liver disease (NAFLD) were analyzed to assess composite blood-based and imaging-based biomarkers either singly or in combination.
-
Results
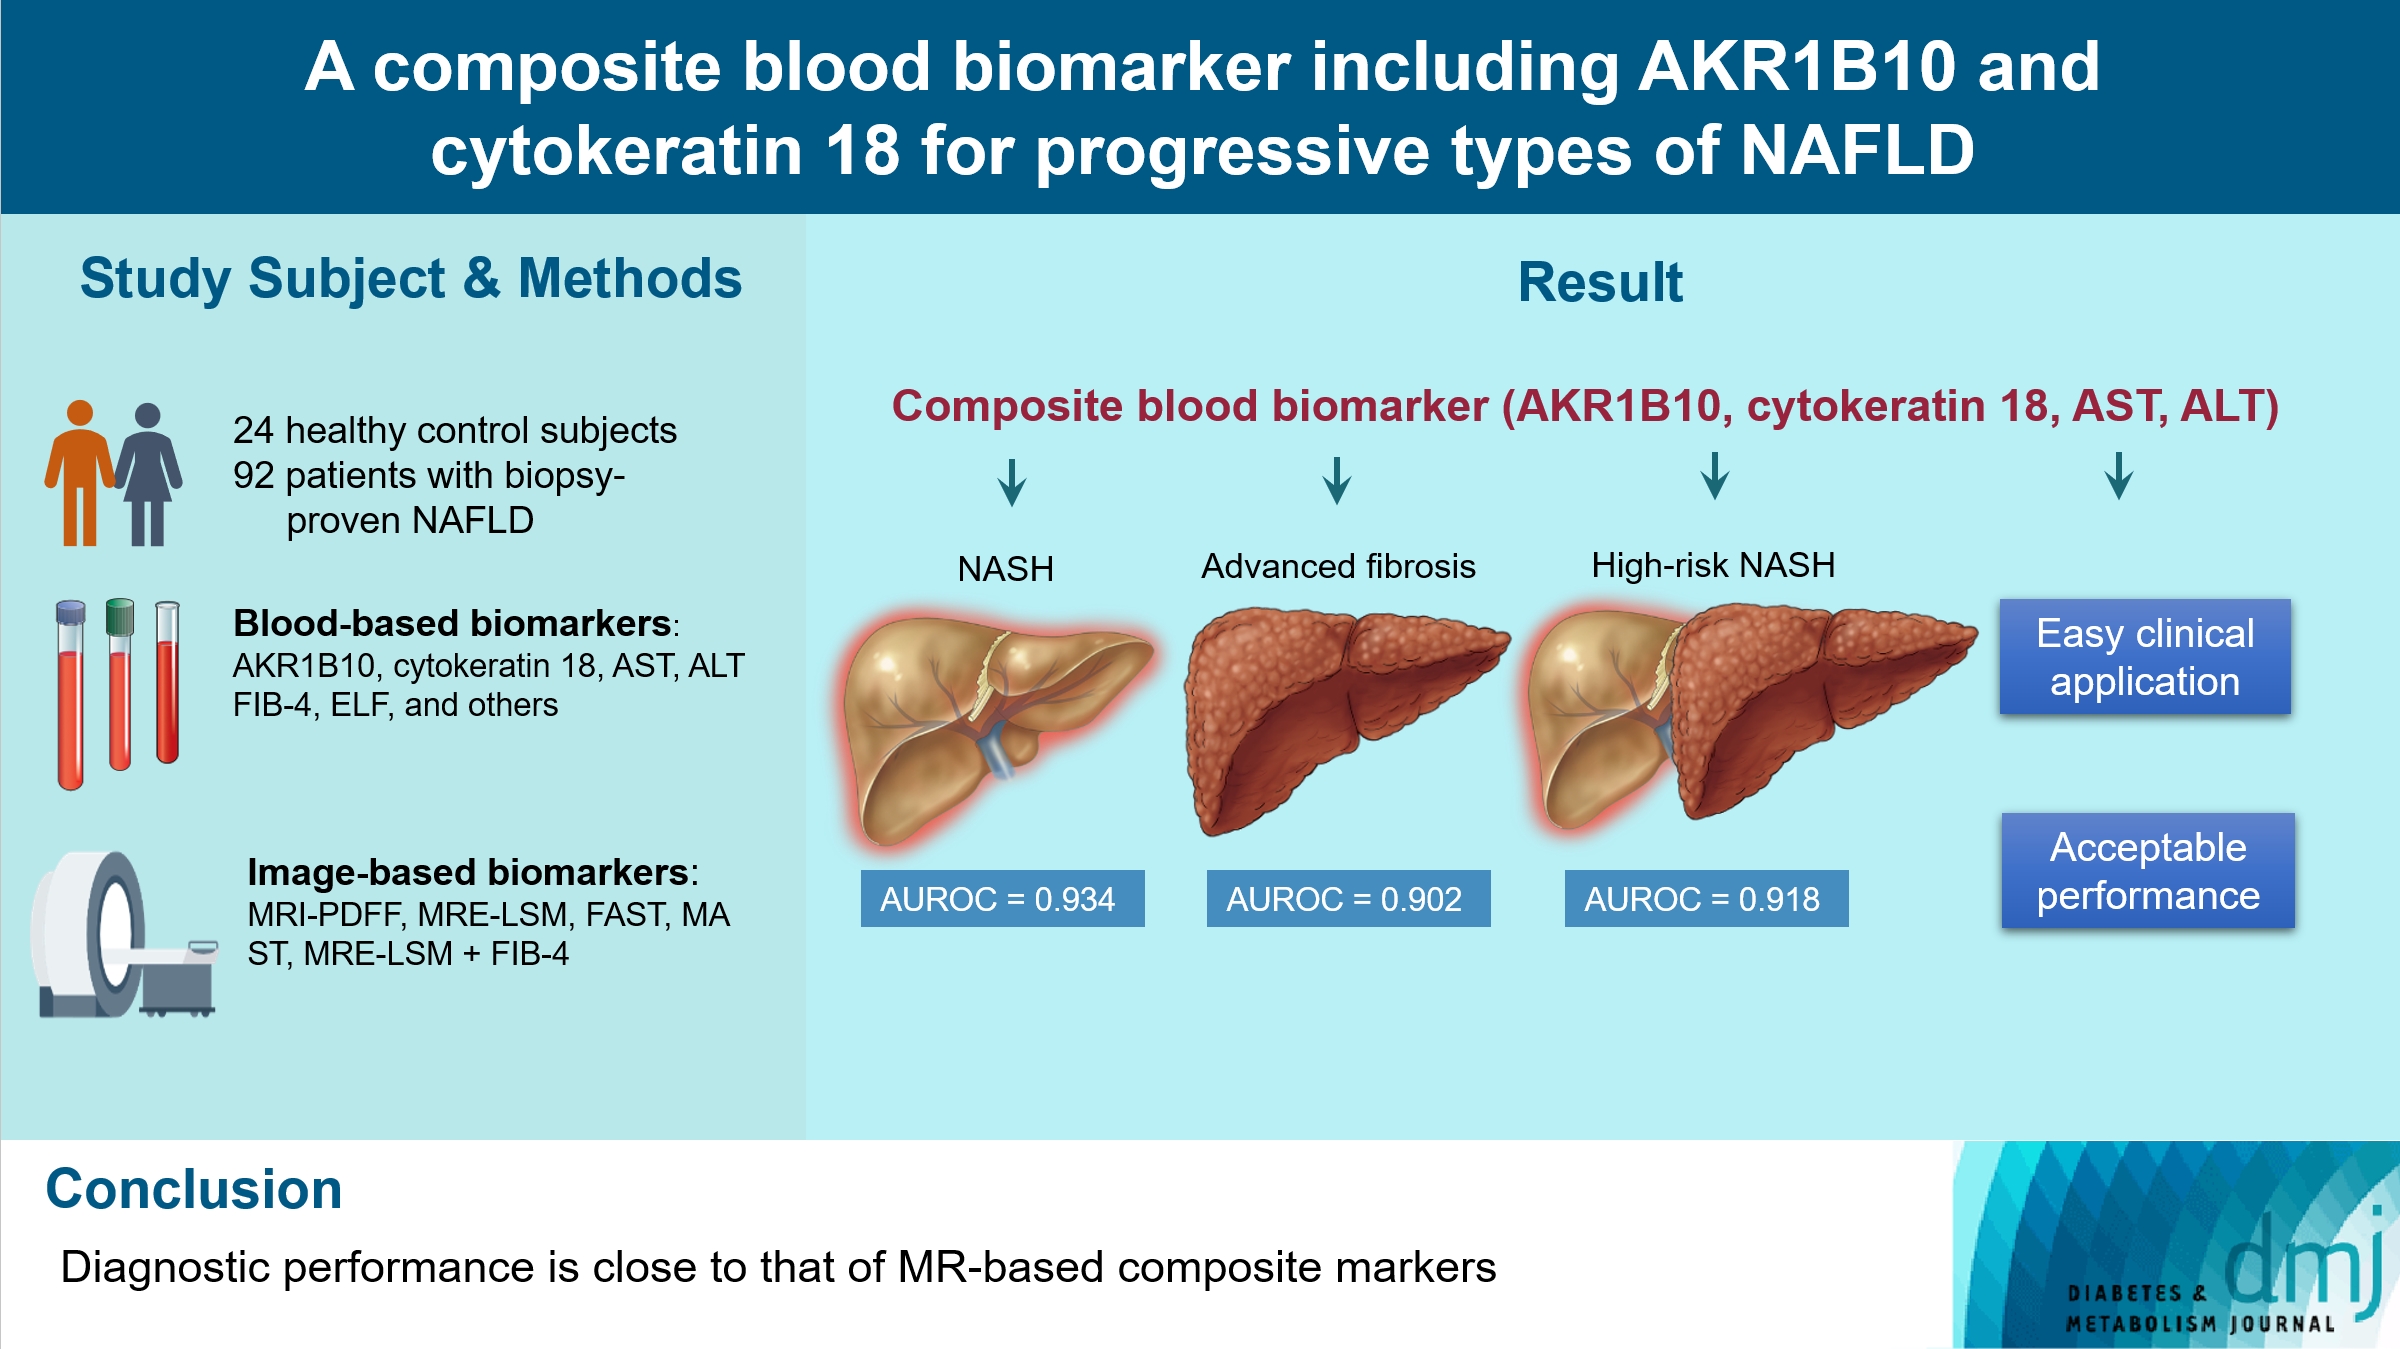
- A composite blood biomarker comprised of AKR1B10, CK-18, aspartate aminotransferase (AST), and alanine aminotransferase (ALT) showed excellent performance for the diagnosis of, NASH, advanced fibrosis, and high-risk NASH, with area under the receiver operating characteristic curve values of 0.934 (95% confidence interval [CI], 0.888 to 0.981), 0.902 (95% CI, 0.832 to 0.971), and 0.918 (95% CI, 0.862 to 0.974), respectively. However, the performance of this blood composite biomarker was inferior to that various magnetic resonance (MR)-based composite biomarkers, such as proton density fat fraction/MR elastography-liver stiffness measurement (MRE-LSM)/ALT/AST for NASH, MRE-LSM+fibrosis-4 index for advanced fibrosis, and the known MR imaging-AST (MAST) score for high-risk NASH.
-
Conclusion
- Our blood composite biomarker can be useful to distinguish progressive forms of NAFLD as an initial noninvasive test when MR-based tools are not available.
- • Noninvasive biomarker for progressive NAFLD is urgently needed.
- • A composite marker (AKR1B10/cytokeratin 18/AST/ALT) showed excellent performance.
- • Its performance closely matched that of MR-based composite markers.
- • This composite biomarker can be a useful noninvasive test for progressive subtypes of NAFLD.
Highlights
- Nonalcoholic fatty liver disease (NAFLD) is highly prevalent and is considered the most common chronic liver disease worldwide. It is estimated to affect 25% or more of the general population [1]. With the increasing prevalence of obesity and diabetes, the progression of NAFLD from nonalcoholic fatty liver (NAFL) to nonalcoholic steatohepatitis (NASH), hepatic fibrosis, liver cirrhosis and even hepatocellular carcinoma (HCC) is becoming a global health burden [2]. NASH is currently the second most frequent indication for liver transplantation after alcohol-related liver disease and is the leading indication in women [3,4]. Additionally, increases in the grade of fibrosis are associated with adverse clinical outcomes and allcause mortality [5]. Thus, the exact diagnosis of NASH, advanced fibrosis, and high-risk NASH (defined as NASH with an NAFLD activity score [NAS] ≥4 and clinically significant fibrosis [F≥2]) is important because patients with these progressive forms of NAFLD are potential treatment candidates, and clinical trials have included these progressive traits to evaluate the resolution of NASH and the improvement of fibrosis [6]. However, it is not practical to perform liver biopsy in most patients with NASH and/or hepatic fibrosis [7]. Furthermore, in many NASH clinical trials, screening failure rates for the enrollment of high-risk NASH have been very high [8,9].
- Many blood biomarkers have been studied for their ability to identify NASH/fibrosis [10,11]. Cytokeratin 18 (CK-18) is the major intermediate filament protein in the liver and has been widely evaluated as a marker of NASH [12]. In particular, caspase-generated CK-18 cleavage fragments were shown to be a caspase-cleaved apoptosis marker. Blood CK-18 fragment levels have been shown to be correlated with hepatic expression of CK-18, serum transaminase levels, NAS and its components, and even fibrosis [13,14]. However, variability in their threshold levels and relatively low performance in diagnosing NASH precluded it from becoming a single biomarker for the diagnosis of NASH. Previously, we reported that plasma aldo-keto reductase family 1 member B10 (AKR1B10) performed relatively well in the diagnosis of NASH and advanced fibrosis (F≥3) [15]. Other studies have also shown that blood and tissue AKR1B10 levels are associated with the progression of liver diseases including NASH/fibrosis and HCC [16-20]. AKR1B10 is a multifunctional NADPH-dependent reductase that reduces endogenous carbonyl compounds, retinals, and isoprenyl aldehydes [17,18]. The extra-enzymatic actions of AKR1B10 include the enhancement of lipogenesis through the stabilization of acetyl-coenzyme A carboxylase-α and the suppression of autophagy through the inhibition of nuclear import of glyceraldehyde3-phosphate dehydrogenase [18]. We believe that many of these pathways have pathophysiologic implications in the progression of NAFLD and fibrosis/cirrhosis and even the development of HCC. To be secreted, intracellular AKR1B10 associates with a chaperone protein, heat shock protein 90α (HSP90α), and is then secreted through a lysosome-mediated nonclassical protein secretion pathway [21]. Interestingly, HSP90α and CK-18 are Mallory body-related proteins and their serum levels are increased in patients with NASH [22].
- In addition, imaging techniques including vibration controlled transient elastography (VCTE) and several magnetic resonance (MR)-based methods have been introduced for the noninvasive assessment of NAFLD [10,23-26]. Proton density fat fraction measured by magnetic resonance imaging (MRIPDFF) and liver stiffness measurement (LSM) by magnetic resonance elastography (MRE) have excellent performance in the assessment of steatosis and advanced fibrosis, respectively [23,26].
- To increase the diagnostic accuracy and clinical applicability in the assessment of NASH and fibrosis, respectively, blood and imaging biomarkers with a relatively good performance could be combined with clinical parameters to develop composite biomarkers. Recently, several composite biomarkers for the discrimination of high-risk NASH or significant fibrosis have been introduced. These include (1) the FibroScan-AST (FAST) score that combines LSM by VCTE and controlled attenuation parameter measured by the FibroScan device with serum aspartate aminotransferase (AST) levels [27]; (2) MRE combined with fibrosis-4 index (FIB-4) (MEFIB) [28]; and (3) the MRI-AST (MAST) score which combines MRE, MRI-PDFF, and AST [29]. However, blood tests may be more easily applicable in routine clinical practice.
- In the present study, we aimed to evaluate whether composite blood biomarkers, including AKR1B10 and CK-18, have acceptable performance compared to other noninvasive composite markers for the diagnosis of NASH, advanced liver fibrosis, and high-risk NASH.
INTRODUCTION
- Study subjects and design
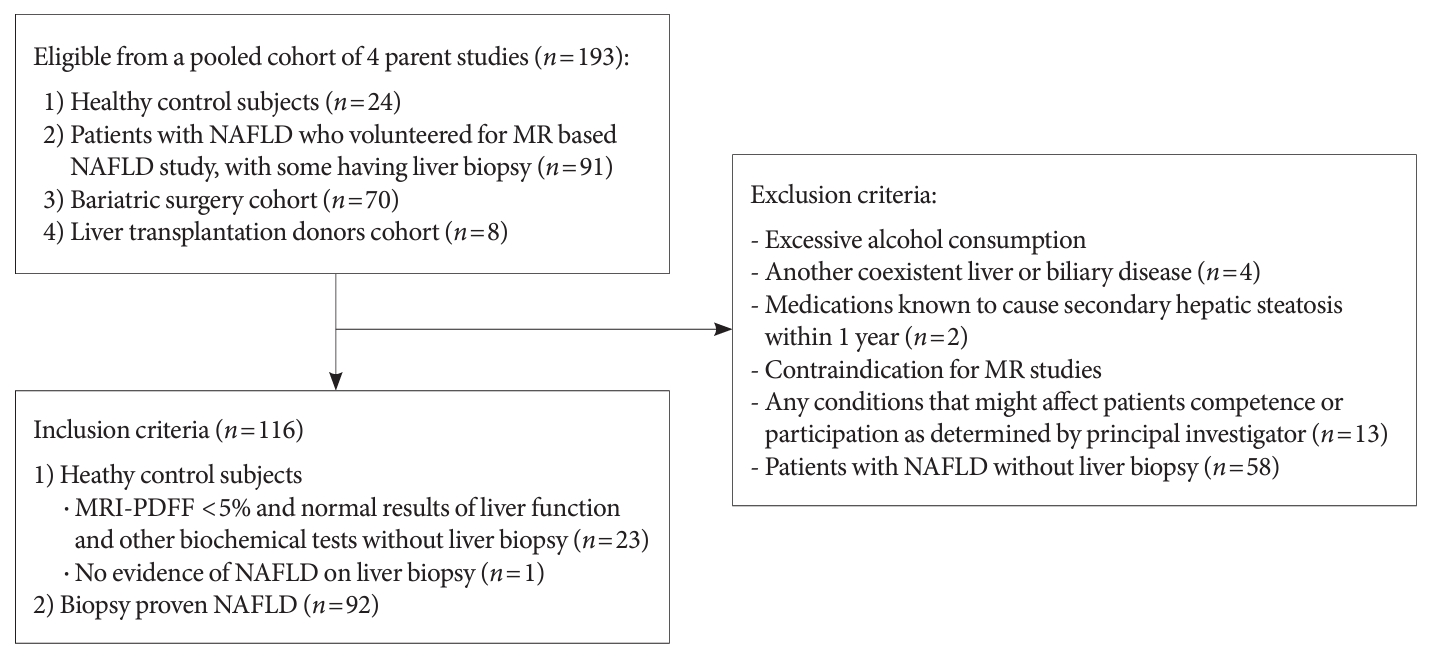
- As summarized in the flow chart (Fig. 1), a total of 116 patients from four parent cohorts (n=193) were selected and included in the present study. Subsets of corresponding data have been used in our two previous reports on the performance of MR-based techniques in capturing the features of NAFLD and the discovery of AKR1B10 as a marker of NAFLD progression [15,26]. Participants were enrolled at their outpatient visits (for health check-up, suspected liver disease, obesity management or bariatric surgery, or as a donor for liver transplantation) in the hospital.
- Study subjects were required to be between 19 and 70 years of age. The healthy control subjects were required to have no evidence of NAFLD on liver biopsy or an MRI-PDFF less than 5% and normal results of liver function and other biochemical tests even without liver biopsy. In males, the normal results included AST <40 U/L, and alanine aminotransferase (ALT) <35 U/L; in females, these included AST <40 U/L, and ALT <25 U/L. Exclusion criteria were excessive alcohol consumption (alcohol intake >20 g/day for women and >30 g/day for men), evidence of another coexistent liver or biliary disease except for NAFLD, use of medications known to cause secondary hepatic steatosis within 1 year, contraindications for MR studies, or any conditions that might affect patient competence or participation as determined by the opinion of the principal investigator [15,26].
- Each study protocol was approved by the Institutional Review Board (GAIRB 2017-200, GAIRB 2017-310, GAIRB-2017-001, and GAIRB-2020-228) of the Gil Medical Center and was performed in accordance with the Declaration of Helsinki. All participants provided written informed consent, and all parental studies were registered at https://cris.nih.go.kr (last accessed on 12 February 2023) in accordance with the International Clinical Trials Registry Platform. All authors had access to the study data and reviewed and approved the final manuscript.
- Clinical and laboratory evaluation
- An array of clinical and laboratory data was collected, as detailed previously [15,26]. After an overnight fast, blood samples were collected on the same day or within days of the imaging studies or several days before liver biopsy for various blood markers. The clinical biochemistry tests include liver function tests, a complete blood count with a platelet count, the levels of albumin, hemoglobin A1c, AKR1B10, CK-18, and complement factors C3 and C4, and the enhanced liver fibrosis (ELF) test. Sample processing and measurement details are available in the Supplementary Methods.
- Enrolled participants underwent MRI-PDFF and MRE studies were mostly performed 1 to 2 weeks before liver biopsy, as described previously [26]. Briefly, the MR studies, which were performed with a 3-T scanner (MAGNETOM Skyra, Siemens Healthineers, Erlangen, Germany) using an 18-channel body matrix coil and table-mounted 32-channel spine matrix coil. To quantify the fat content (PDFF), we used a multiecho three-dimensional gradient-echo sequence from a single breath-hold acquisition. The two-dimensional spin-echo planar imaging MRE sequence (Work-In-Progress package, Siemens Healthineers) was also performed in the same session to obtain LSM values for the liver parenchyma, as previously described [26].
- To compare the performance of various composite biomarkers in evaluating advanced fibrosis and high-risk NASH, we also calculated the NAFLD fibrosis score (NFS) and FIB-4, MAST, and FAST scores [27,29,30]. Details on the FibroScan study and score calculation are available in the Supplementary Methods and were also previously reported [10,15,26].
- Liver tissue sampling and analyses
- Liver biopsy and histological analysis were performed as detailed in the Supplementary Methods. NASH was defined as NAS ≥4 with at least grade 1 in all three of categories of lobular inflammation, ballooning, and steatosis. NAS and the grade of fibrosis were assessed by using the Nonalcoholic Steatohepatitis Clinical Research Network histologic scoring system [31].
- Statistical analyses
- Categorical variables were compared as counts and percentages and associations were tested using the chi-squared or Fisher’s exact test. Continuous variables are reported as the mean±standard deviation, and differences between groups were analyzed using Student’s t-test (two-tailed), or the Mann-Whitney U test, or one-way analysis of variance (ANOVA) followed by Tukey-Kramer’s multiple comparisons post hoc test as appropriate. Univariate and multiple logistic regression analyses were performed to assess the potential predictive factors of NASH, advanced liver fibrosis, and high-risk NASH. Correlations were evaluated using Pearson’s correlation coefficients.
- We evaluated the diagnostic accuracy of each of the tentative blood and imaging parameters to appropriately distinguish NASH, advanced fibrosis, and high-risk NASH. The performance of diagnostic markers was assessed by the standard area under the receiver operating characteristic curve (AUROC), sensitivity, specificity, positive predictive value (PPV), and negative predictive value (NPV). In addition, to identify clinically applicable optimal composite markers for each outcome, we combined blood or imaging markers with ALT or AST, because AST and ALT data are always available in the initial assessment of NAFLD. For each AUROC, 95% confidence intervals (CIs) were measured using its standard error. The AUROC and the optimal thresholds were obtained by the multipleROC package in R. All reported P values are two-sided and considered statistically significant at <0.05. Statistical analyses were performed using R software/environment (R version 2.9.1, R Foundation for Statistical Computing, Vienna, Austria).
- Data availability
- The data generated during and/or analyzed during the current study and analytic methods, but not study materials, are available from the corresponding author upon reasonable request.
METHODS
- A total of 116 study subjects were analyzed from four parent cohorts that screened 193 subjects, as shown in the flow chart in Fig. 1. The characteristics of the study subjects according to the status of NAFLD are presented in Table 1. The mean plasma level of AKR1B10 was higher in patients with NASH (8,058.3±6,574.5 pg/mL) than in patients with NAFL (1,771.7±4,006.9 pg/mL, P<0.001) and healthy control subjects (549.8±235.2 pg/mL, P<0.001). The mean serum level of CK-18 was higher in patients with NASH (637.0±467.8 U/L) than in patients with NAFL (218.7±252.9 U/L, P<0.001) and healthy control subjects (72.2±37.3 U/L, P<0.001). The AUROC curve values of plasma AKR1B10, serum CK-18, and other parameters and clinical scores for the identification of patients with NASH, advanced fibrosis, and high-risk NASH are presented in Tables 2-4, respectively. To determine whether blood biomarkers are independent of obesity, insulin resistance, and other parameters, we performed multiple logistic regression analysis against the three specified traits, with age, sex, body mass index, homeostasis model assessment of insulin resistance, AST, ALT, white blood cell and platelet counts, high-sensitivity C-reactive protein, CK-18, ELF score or its components, AKR1B10 (log-transformed) as covariates, as appropriate. The results showed that only plasma AKR1B10 was an independent predictor of NASH and high-risk NASH after adjustment for several factors (Supplementary Tables 1-6). However, independent associations between AKR1B and any of the three types of diseases were lost when we added MRI-PDFF and MRE-LSM to the covariates. In contrast, MRE-LSM was an independent predictor of the three progressive types of NAFLD after adjustments for multiple factors (Supplementary Tables 1-3). The AUROC curve values of plasma AKR1B10 and serum CK-18 for the identification of patients with NASH were 0.834 and 0.903, respectively, with optimal cutoff values of 1,078.2 pg/mL and 160.9 U/L, respectively (Table 2).
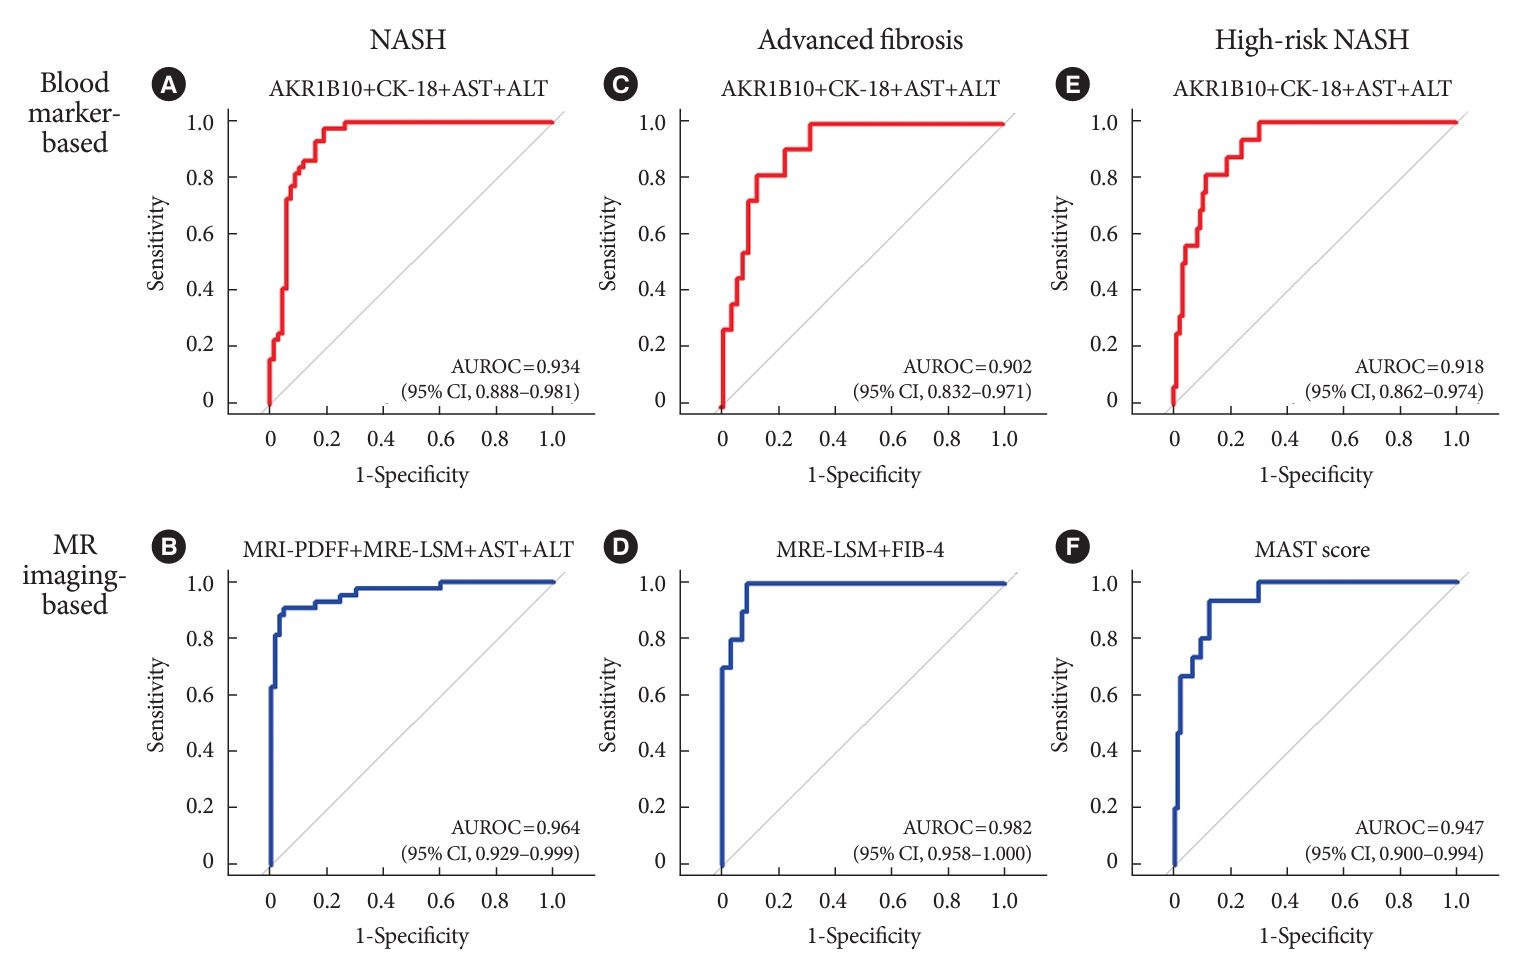
- Then, we evaluated whether these two blood biomarkers perform optimally when combined together and with routine clinical liver tests (i.e., ALT and/or AST) in the diagnosis of NASH and compared blood composite biomarkers to other image-based composite biomarkers. The combination of AKR1B10, CK-18, ALT, and AST showed excellent performance as a composite blood biomarker for NASH (AUROC=0.934), although it was inferior to the combination of MRI-PDFF, MRE-LSM, ALT, and AST (AUROC=0.964) (Table 2, Fig. 2). Other image-based composite biomarkers, such as FAST, MAST, and MEFIB, were also inferior to the combination of MRI-PDFF, MRE-LSM, ALT, and AST in the diagnosis of NASH.
- For the diagnosis of advanced fibrosis (F≥3), plasma AKR1B10 showed good performance (AUROC=0.902 at a cutoff level of 3,935.5 pg/mL) (Table 3). As a composite biomarker, the combination of AKR1B10, CK-18, AST, and ALT showed excellent performance with an AUROC value of 0.902 (95% CI, 0.832 to 0.971) and diagnostic threshold values of 8,529.2 pg/mL, 359.5 U/L, 98 U/L, and 95 U/L, respectively. This blood composite biomarker outperformed the ELF score as well as two well-known clinical scores, NFS and FIB-4, for the diagnosis of advanced fibrosis. However, MRE-LSM in combination with other blood tests, especially FIB-4 or ALT, showed a better performance than the blood composite biomarker for the diagnosis of advanced fibrosis (Table 3, Fig. 2).
- We also evaluated the blood composite biomarker for the discrimination of high-risk NASH, for which the AUROC curve value was 0.918 (95% CI, 0.862 to 0.974). Among MR-based composite markers, the MAST score yielded an excellent diagnostic performance of 0.947 (95% CI, 0.900 to 0.994) (Table 4, Fig. 2). However, only MRE-LSM was an independent predictor of high-risk NASH after adjusting for multiple parameters (Supplementary Table 3).
- Collectively, for the diagnosis of NASH, advanced fibrosis, and high-risk NASH, our composite blood biomarker composed of AKR1B10, CK-18, AST, and ALT performed excellently. Although its performance was slightly inferior, it was close to that of the MR-imaging-based composite markers. In Fig. 2, we summarize the performances of our blood composite biomarkers and MR-based composite biomarkers of choice for NASH, advanced fibrosis, and high-risk NASH in the present study.
RESULTS
- In the present study, we evaluated the utility of composite biomarkers for the diagnosis of NASH, advanced fibrosis, and high-risk NASH. The construction of blood composite markers was intended to have both easy clinical applicability and acceptable diagnostic performance as a noninvasive test that can be easily used in clinical practice and clinical trials, considering the risks and limitations of liver biopsy and a high screening failure rate in precirrhotic NASH clinical trials [8,9,32,33]. Although new composite markers composed of MR imaging parameters and liver function tests, such as MAST and MEFIB [8,28,29], seemed promising, the accessibility and high cost of these MR-based examinations are major limitations. Thus, in the present study, we combined blood levels of AKR1B10 and CK-18 with common liver blood tests (AST and ALT). We also focused on MR-based composite markers as comparators because these markers better capture the pathophysiology and progression of NAFLD than other imaging parameters or clinical scores [8,26].
- Our results show that our composite blood biomarker, comprised of AKR1B10, CK-18, AST, and ALT, showed excellent diagnostic performance for identifying patients with NASH, advanced fibrosis, and high-risk NASH, although it was inferior to MR-based composite markers. Additionally, our results and recent studies suggest that the use of MR-based composite markers could be a reliable noninvasive approach after initial blood tests for the diagnosis and follow-up of progressive NAFLD [8,29]. In the present study, the AUROC curve values of our composite blood biomarkers for these traits were in the range of 0.904 to 0.934, while those values of MR-based composite biomarkers incorporating serum transaminase(s) or FIB-4 were in the range of 0.940 to 0.985. In multivariate analyses, plasma AKR1B10 was an independent predictor for the diagnosis of NASH and high-risk NASH among blood biomarkers, while MRE-LSM was an independent predictor for the diagnosis of the three progressive diseases even after full adjustments for covariates. The ELF score alone and in combination with other blood or imaging markers was suboptimal in predicting advanced fibrosis of the liver. FIB-4 and NFS, which have been used and recommended as initial blood-based scoring methods for risk stratification in patents with NAFLD [34,35], did not outperform our blood composite biomarker. The FAST score is easily accessible and cost-efficient [27]. However, the FAST score had a performance that was comparable to our blood composite marker but inferior to the MAST score in the diagnosis of high-risk NASH in the present study. The overall diagnostic performance of MRE-LSM+FIB-4 (or MEFIB index) showed excellent performance for identifying advanced fibrosis, as previously reported by Kim et al. [8]. Many studies have shown that adding hepatic fat content, using MRI-PDFF or additional blood-based markers (AST and ALT) can increase the diagnostic accuracy of MRE for detecting NASH with fibrosis, as was the case for the MAST score [29]. In the present study, the MAST score performed better than MRE-LSM+FIB-4 in the discrimination of high-risk NASH.
- Our study has some strengths. First, our study encompasses many previously validated biomarkers. Thus, parallel analyses on the spectrum of biomarkers further support the validity of our composite blood biomarker. Second, although the performance of the composite blood marker was inferior to that of the MR-based composite markers, their performances were close. Thus, this blood composite biomarker can be easily applicable to clinical practice and used as a measure of stepwise screening processes in NASH clinical trials. Recently, similar to our study, a promising blood-based composite marker incorporating N-terminal propeptide of type III collagen (PRO-C3) was introduced [11]. The PRO-C3 test has been reported to be an acceptable biomarker for the assessment of active fibrosis in NAFLD, which measures the formation of type III collagen neoepitopes by a disintegrin and metalloproteinase metallopeptidase with thrombospondin type 1 motif 2 during the formation of type III collagen. However, currently, PRO-C3 measurement is not widely available. Although we did not measured the PRO-C3 level, the AUROC curve values of our composite marker are higher than the AUROC curve values (0.81 to 0.88 for advanced fibrosis) of PRO-C3-based composite markers in the literature [11]. Our study has some limitations. First, our study is a single-center study and AUROCs can be affected by the disease spectrum of the study population. Second, for general application in clinical practice, more standardization and verification studies are needed for plasma/serum measurement of AKR1B10 and fragmented CK-18 [13, 15]. Third, although we developed a composite blood biomarker incorporating plasma AKR1B10, the performance of our composite marker did not show a large improvement in the AUROC curve value for the diagnosis of advanced fibrosis compared to that of AKR1B10 alone. However, we also considered other performance parameters in our composite marker including sensitivity, specificity, PPV, and NPV. We believe that a single biomarker would not reflect the progression of complex disease across various study designs and study populations well. Furthermore, this composite marker had excellent performance for the diagnosis of NASH and high-risk NASH, in which advanced fibrosis is commonly combined [36]. Fourth, there have been reports on other MR-based techniques to discriminate NASH/fibrosis that were not included in the present study [24,25,37]. Fifth, a validation cohort study was not performed because of the limited availability of patients with biopsy-proven NAFLD.
- In conclusion, for the diagnosis of NASH, advanced fibrosis, and high-risk NASH, our composite blood biomarker composed of AKR1B10, CK-18, AST, and ALT showed excellent performances that, although slightly inferior, were close to those of the MR-based composite markers. This blood composite biomarker can be useful to distinguish progressive forms of NAFLD as an initial test method when imaging methods are limited or as a substitute test method for imaging studies.
DISCUSSION
SUPPLEMENTARY MATERIALS
Supplementary Table 1.
Supplementary Table 2.
Supplementary Table 3.
Supplementary Table 4.
Supplementary Table 5.
Supplementary Table 6.
-
CONFLICTS OF INTEREST
Dae Ho Lee has been international editorial board Members of the Diabetes & Metabolism Journal since 2023. He was not involved in the review process of this article. Otherwise, there was no conflict of interest.
-
AUTHOR CONTRIBUTIONS
Conception or design: D.H.L.
Acquisition, analysis, or interpretation of data: S.J.C., S.Y., K. K.K., D.K., H.E.L., K.G.K., S.K.S., I.B.P., S.M.K., D.H.L.
Drafting the work or revising: S.J.C., S.Y., D.H.L.
Final approval of the manuscript: S.J.C., S.Y., K.K.K., D.K., H.E.L., K.G.K., S.K.S., I.B.P., S.M.K., D.H.L.
-
FUNDING
This study was supported by grants from the Korea Health Technology R&D Project through the Korea Health Industry Development Institute (KHIDI), which is funded by the Ministry of Health & Welfare, Korea (HI14C1135); the Basic Science Research Program through the National Research Foundation of Korea (NRF) funded by the Ministry of Education (NFR-2019 R1I1A2A02062305), the National Research Foundation of Korea (NRF) grant funded by the Korean government (MSIT) (No. NRF-2021R1A5A2030333), and the Gachon University Gil Medical Center (FRD2021-03). The funders had no role in the study design, data collection and analysis, decision to publish, or preparation of the manuscript.
NOTES
-
Acknowledgements
- None
| Characteristic | Control (n=24) | NAFL (n=48) | NASH/cirrhosis (n=44) | P value |
|---|---|---|---|---|
| Age, yr | 36.0±15.7 | 34.2±9.0 | 35.4±12.4 | 0.813 |
| Sex, male/female | 17/7 | 10/38b | 11/33d | <0.001 |
| Weight, kg | 66.7±11.4 | 93.3±19.8b | 101.9±20.7d,e | <0.001 |
| BMI, kg/m2 | 23.0±3.1 | 34.8±6.7b | 37.3±6.7d | <0.001 |
| SBP, mm Hg | 130.2±16.9 | 121.2±14.9a | 127.5±12.7e | 0.026 |
| DBP, mm Hg | 83.4±11.9 | 82.9±10.3 | 86.8±10.1 | 0.177 |
| AST, U/L | 20.8±5.6 | 36.5±43.2a | 76.8±45.7d,f | <0.001 |
| ALT, U/L | 18.4±7.1 | 49.7±73.2a | 108.5±76.1d,f | <0.001 |
| FIB-4 | 0.82±0.45 | 0.59±0.37a | 1.35±2.27c | 0.039 |
| NFS | –2.727±1.035 | –2.899±1.265 | –2.141±2.154e | 0.079 |
| WBC, ×109/L | 5.2±1.7 | 7.5±2.1b | 8.1±1.9d | <0.001 |
| Platelets, ×109/L | 229.0±52.4 | 317.2±72.8b | 308.7±104.2d | <0.001 |
| hs-CRP, mg/dL | 0.13±0.21 | 0.62±0.73 | 0.70±0.52 | 0.093 |
| Hemoglobin A1c, % | 5.4±0.4 | 6.1±1.8a | 6.6±1.6d | 0.008 |
| Glucose, mg/dL | 89.3±6.9 | 114.2±54.3a | 120.1±49.3d | 0.032 |
| Insulin, μU/mL | 6.7±3.9 | 23.9±34.3a | 28.0±23.5d | 0.002 |
| HOMA-IR | 1.5±1.0 | 7.1±12.0a | 9.1±8.2d | 0.006 |
| C3, mg/dL | 104.7±16.3 | 149.8±30.4b | 170.3±34.5d,e | <0.001 |
| C4, mg/dL | 26.5±5.6 | 34.9±10.5a | 38.2±13.1d | 0.009 |
| AKR1B10, pg/mL | 549.8±235.2 | 1,771.7±4,006.9a | 8,058.3±6,574.5d,f | <0.001 |
| CK-18, U/L | 72.2±37.3 | 218.7±252.9b | 637.0±467.8d,f | <0.001 |
| ELF | 8.2±0.8 | 8.4±0.8 | 8.8±1.1c | 0.039 |
| MRI-PDFF, % | 3.4±0.8 | 13.2±6.9b | 23.4±9.4d,f | <0.001 |
| MRE-LSM, kPa | 3.1±0.5 | 2.8±0.5 | 3.9±1.5c,f | <0.001 |
| TE-CAP, dB/m | 216.5±37.9 | 314.1±51.2b | 344.7±45.6d,e | <0.001 |
| TE-LSM, kPa | 3.8±0.9 | 7.1±6.6a | 12.6±9.4d,e | <0.001 |
| FAST score | 0.05±0.05 | 0.27±0.23b | 0.65±0.24d,f | <0.001 |
| MAST score | 0.02±0.01 | 0.05±0.09a | 0.36±0.27d,f | <0.001 |
Values are presented as mean±standard deviation
NAFL, nonalcoholic fatty liver; NASH, nonalcoholic steatohepatitis; BMI, body mass index; SBP, systolic blood pressure; DBP, diastolic blood pressure; AST, aspartate aminotransferase; ALT, alanine aminotransferase; FIB-4, fibrosis-4 index; NFS, nonalcoholic fatty liver disease (NAFLD) fibrosis score; WBC, white blood cell; hs-CRP, high-sensitivity C-reactive protein; HOMA-IR, homeostasis model assessment of insulin resistance; AKR1B10, aldo-keto reductase family 1 member B10; CK-18, cytokeratin 18; ELF, enhanced liver fibrosis; MRI, magnetic resonance imaging; PDFF, proton density fat fraction; MRE, magnetic resonance elastography; LSM, liver stiffness measurement; TE, transient elastography; CAP, controlled attenuation parameter; FAST, FibroScan-AST; MAST, MRI-AST.
a P<0.05,
b P<0.01 vs. healthy control subjects,
c P<0.05,
d P<0.01 vs. healthy control subjects,
e P<0.05,
f P<0.01 vs. NAFL.
NASH, nonalcoholic steatohepatitis; AUROC, area under the receiver operating characteristic curve; CI, confidence interval; PPV, positive predictive value; NPV, negative predictive value; AKR1B10, aldo-keto reductase family 1 member B10; CK-18, cytokeratin 18; FIB-4, fibrosis-4 index; NFS, nonalcoholic fatty liver disease (NAFLD) fibrosis score; ELF, enhanced liver fibrosis; AST, aspartate aminotransferase; ALT, alanine aminotransferase; MRI, magnetic resonance imaging; PDFF, proton density fat fraction; MRE, magnetic resonance elastography; LSM, liver stiffness measurement; FAST, FibroScan-AST; MAST, MRI-AST.
a In a total of 116 subjects in the pooled cohort, 44 patients had NAFLD activity score ≥4, and 11 patients had advanced hepatic fibrosis (F≥3).
AUROC, area under the receiver operating characteristic curve; CI, confidence interval; PPV, positive predictive value; NPV, negative predictive value; AKR1B10, aldo-keto reductase family 1 member B10; CK-18, cytokeratin 18; FIB-4, fibrosis-4 index; NFS, nonalcoholic fatty liver disease (NAFLD) fibrosis score; ELF, enhanced liver fibrosis; AST, aspartate aminotransferase; ALT, alanine aminotransferase; MRE, magnetic resonance elastography; LSM, liver stiffness measurement; FAST, FibroScan-AST; MAST, magnetic resonance imaging-AST.
a In a total of 116 subjects in the pooled cohort, 44 patients had NAFLD activity score ≥4, and 11 patients had advanced hepatic fibrosis (F≥3).
NASH, nonalcoholic steatohepatitis; NAS, nonalcoholic fatty liver disease (NAFLD) activity score; AUROC, area under the receiver operating characteristic curve; CI, confidence interval; PPV, positive predictive value; NPV, negative predictive value; AKR1B10, aldo-keto reductase family 1 member B10; CK-18, cytokeratin 18; FIB-4, fibrosis-4 index; NFS, NAFLD fibrosis score; ELF, enhanced liver fibrosis; AST, aspartate aminotransferase; ALT, alanine aminotransferase; MRI, magnetic resonance imaging; PDFF, proton density fat fraction; MRE, magnetic resonance elastography; LSM, liver stiffness measurement; FAST, FibroScan-AST; MAST, MRI-AST.
a In the pooled cohort (n=116), 16 patients had NAS ≥4 and F ≥2, and 19 patients had significant hepatic fibrosis (F≥2).
- 1. Younossi ZM, Koenig AB, Abdelatif D, Fazel Y, Henry L, Wymer M. Global epidemiology of nonalcoholic fatty liver disease: meta-analytic assessment of prevalence, incidence, and outcomes. Hepatology 2016;64:73-84.ArticlePubMed
- 2. Chalasani N, Younossi Z, Lavine JE, Charlton M, Cusi K, Rinella M, et al. The diagnosis and management of nonalcoholic fatty liver disease: practice guidance from the American Association for the Study of Liver Diseases. Hepatology 2018;67:328-57.ArticlePubMedPDF
- 3. Cotter TG, Rinella M. Nonalcoholic fatty liver disease 2020: the state of the disease. Gastroenterology 2020;158:1851-64.ArticlePubMed
- 4. Noureddin M, Vipani A, Bresee C, Todo T, Kim IK, Alkhouri N, et al. NASH leading cause of liver transplant in women: updated analysis of indications for liver transplant and ethnic and gender variances. Am J Gastroenterol 2018;113:1649-59.ArticlePubMedPMCPDF
- 5. Sanyal AJ, Van Natta ML, Clark J, Neuschwander-Tetri BA, Diehl A, Dasarathy S, et al. Prospective study of outcomes in adults with nonalcoholic fatty liver disease. N Engl J Med 2021;385:1559-69.ArticlePubMedPMC
- 6. Rinella ME, Tacke F, Sanyal AJ, Anstee QM; participants of the AASLD/EASL Workshop. Report on the AASLD/EASL joint workshop on clinical trial endpoints in NAFLD. J Hepatol 2019;71:823-33.ArticlePubMed
- 7. Allen AM, Therneau TM, Ahmed OT, Gidener T, Mara KC, Larson JJ, et al. Clinical course of non-alcoholic fatty liver disease and the implications for clinical trial design. J Hepatol 2022;77:1237-45.ArticlePubMedPMC
- 8. Kim BK, Tamaki N, Imajo K, Yoneda M, Sutter N, Jung J, et al. Head-to-head comparison between MEFIB, MAST, and FAST for detecting stage 2 fibrosis or higher among patients with NAFLD. J Hepatol 2022;77:1482-90.ArticlePubMed
- 9. Friedman SL, Ratziu V, Harrison SA, Abdelmalek MF, Aithal GP, Caballeria J, et al. A randomized, placebo-controlled trial of cenicriviroc for treatment of nonalcoholic steatohepatitis with fibrosis. Hepatology 2018;67:1754-67.ArticlePubMedPDF
- 10. Lee DH. Noninvasive evaluation of nonalcoholic fatty liver disease. Endocrinol Metab (Seoul) 2020;35:243-59.ArticlePubMedPMCPDF
- 11. Boyle M, Tiniakos D, Schattenberg JM, Ratziu V, Bugianessi E, Petta S, et al. Performance of the PRO-C3 collagen neo-epitope biomarker in non-alcoholic fatty liver disease. JHEP Rep 2019;1:188-98.ArticlePubMedPMC
- 12. Wieckowska A, Zein NN, Yerian LM, Lopez AR, McCullough AJ, Feldstein AE. In vivo assessment of liver cell apoptosis as a novel biomarker of disease severity in nonalcoholic fatty liver disease. Hepatology 2006;44:27-33.ArticlePubMed
- 13. Eguchi A, Iwasa M, Yamada M, Tamai Y, Shigefuku R, Hasegawa H, et al. A new detection system for serum fragmented cytokeratin 18 as a biomarker reflecting histologic activities of human nonalcoholic steatohepatitis. Hepatol Commun 2022;6:1987-99.ArticlePubMedPMCPDF
- 14. Feldstein AE, Wieckowska A, Lopez AR, Liu YC, Zein NN, McCullough AJ. Cytokeratin-18 fragment levels as noninvasive biomarkers for nonalcoholic steatohepatitis: a multicenter validation study. Hepatology 2009;50:1072-8.ArticlePubMed
- 15. Park A, Choi SJ, Park S, Kim SM, Lee HE, Joo M, et al. Plasma aldo-keto reductase family 1 member B10 as a biomarker performs well in the diagnosis of nonalcoholic steatohepatitis and fibrosis. Int J Mol Sci 2022;23:5035.ArticlePubMedPMC
- 16. Govaere O, Cockell S, Tiniakos D, Queen R, Younes R, Vacca M, et al. Transcriptomic profiling across the nonalcoholic fatty liver disease spectrum reveals gene signatures for steatohepatitis and fibrosis. Sci Transl Med 2020;12:eaba4448.ArticlePubMed
- 17. Martin HJ, Breyer-Pfaff U, Wsol V, Venz S, Block S, Maser E. Purification and characterization of akr1b10 from human liver: role in carbonyl reduction of xenobiotics. Drug Metab Dispos 2006;34:464-70.ArticlePubMed
- 18. Endo S, Matsunaga T, Nishinaka T. The role of AKR1B10 in physiology and pathophysiology. Metabolites 2021;11:332.ArticlePubMedPMC
- 19. Kanno M, Kawaguchi K, Honda M, Horii R, Takatori H, Shimakami T, et al. Serum aldo-keto reductase family 1 member B10 predicts advanced liver fibrosis and fatal complications of nonalcoholic steatohepatitis. J Gastroenterol 2019;54:549-57.ArticlePubMedPDF
- 20. DiStefano JK, Davis B. Diagnostic and prognostic potential of AKR1B10 in human hepatocellular carcinoma. Cancers (Basel) 2019;11:486.ArticlePubMedPMC
- 21. Luo D, Bu Y, Ma J, Rajput S, He Y, Cai G, et al. Heat shock protein 90-α mediates aldo-keto reductase 1B10 (AKR1B10) protein secretion through secretory lysosomes. J Biol Chem 2013;288:36733-40.ArticlePubMedPMC
- 22. Abdelmegeed MA, Banerjee A, Yoo SH, Jang S, Gonzalez FJ, Song BJ. Critical role of cytochrome P450 2E1 (CYP2E1) in the development of high fat-induced non-alcoholic steatohepatitis. J Hepatol 2012;57:860-6.ArticlePubMedPMC
- 23. Dulai PS, Sirlin CB, Loomba R. MRI and MRE for non-invasive quantitative assessment of hepatic steatosis and fibrosis in NAFLD and NASH: clinical trials to clinical practice. J Hepatol 2016;65:1006-16.ArticlePubMedPMC
- 24. Andersson A, Kelly M, Imajo K, Nakajima A, Fallowfield JA, Hirschfield G, et al. Clinical utility of magnetic resonance imaging biomarkers for identifying nonalcoholic steatohepatitis patients at high risk of progression: a multicenter pooled data and meta-analysis. Clin Gastroenterol Hepatol 2022;20:2451-61.ArticlePubMed
- 25. Dennis A, Mouchti S, Kelly M, Fallowfield JA, Hirschfield G, Pavlides M, et al. A composite biomarker using multiparametric magnetic resonance imaging and blood analytes accurately identifies patients with non-alcoholic steatohepatitis and significant fibrosis. Sci Rep 2020;10:15308.ArticlePubMedPMCPDF
- 26. Choi SJ, Kim SM, Kim YS, Kwon OS, Shin SK, Kim KK, et al. Magnetic resonance-based assessments better capture pathophysiologic profiles and progression in nonalcoholic fatty liver disease. Diabetes Metab J 2021;45:739-52.ArticlePubMedPDF
- 27. Newsome PN, Sasso M, Deeks JJ, Paredes A, Boursier J, Chan WK, et al. FibroScan-AST (FAST) score for the non-invasive identification of patients with non-alcoholic steatohepatitis with significant activity and fibrosis: a prospective derivation and global validation study. Lancet Gastroenterol Hepatol 2020;5:362-73.ArticlePubMedPMC
- 28. Jung J, Loomba RR, Imajo K, Madamba E, Gandhi S, Bettencourt R, et al. MRE combined with FIB-4 (MEFIB) index in detection of candidates for pharmacological treatment of NASH-related fibrosis. Gut 2021;70:1946-53.ArticlePubMed
- 29. Noureddin M, Truong E, Gornbein JA, Saouaf R, Guindi M, Todo T, et al. MRI-based (MAST) score accurately identifies patients with NASH and significant fibrosis. J Hepatol 2022;76:781-7.ArticlePubMed
- 30. Vallet-Pichard A, Mallet V, Nalpas B, Verkarre V, Nalpas A, Dhalluin-Venier V, et al. FIB-4: an inexpensive and accurate marker of fibrosis in HCV infection. Comparison with liver biopsy and fibrotest. Hepatology 2007;46:32-6.ArticlePubMed
- 31. Kleiner DE, Brunt EM, Van Natta M, Behling C, Contos MJ, Cummings OW, et al. Design and validation of a histological scoring system for nonalcoholic fatty liver disease. Hepatology 2005;41:1313-21.ArticlePubMed
- 32. Bravo AA, Sheth SG, Chopra S. Liver biopsy. N Engl J Med 2001;344:495-500.ArticlePubMed
- 33. Davison BA, Harrison SA, Cotter G, Alkhouri N, Sanyal A, Edwards C, et al. Suboptimal reliability of liver biopsy evaluation has implications for randomized clinical trials. J Hepatol 2020;73:1322-32.ArticlePubMed
- 34. Lee BW, Lee YH, Park CY, Rhee EJ, Lee WY, Kim NH, et al. Non-alcoholic fatty liver disease in patients with type 2 diabetes mellitus: a position statement of the Fatty Liver Research Group of the Korean Diabetes Association. Diabetes Metab J 2020;44:382-401.ArticlePubMedPMCPDF
- 35. Cusi K, Isaacs S, Barb D, Basu R, Caprio S, Garvey WT, et al. American Association of Clinical Endocrinology clinical practice guideline for the diagnosis and management of nonalcoholic fatty liver disease in primary care and endocrinology clinical settings: co-sponsored by the American Association for the Study of Liver Diseases (AASLD). Endocr Pract 2022;28:528-62.PubMed
- 36. Harrison SA, Wong VW, Okanoue T, Bzowej N, Vuppalanchi R, Younes Z, et al. Selonsertib for patients with bridging fibrosis or compensated cirrhosis due to NASH: results from randomized phase III STELLAR trials. J Hepatol 2020;73:26-39.ArticlePubMed
- 37. Banerjee R, Pavlides M, Tunnicliffe EM, Piechnik SK, Sarania N, Philips R, et al. Multiparametric magnetic resonance for the non-invasive diagnosis of liver disease. J Hepatol 2014;60:69-77.ArticlePubMedPMC
 PubReader
 ePub Link
 Cite
Cite


