
- Current
- Browse
- Collections
-
For contributors
- For Authors
- Instructions to authors
- Article processing charge
- e-submission
- For Reviewers
- Instructions for reviewers
- How to become a reviewer
- Best reviewers
- For Readers
- Readership
- Subscription
- Permission guidelines
- About
- Editorial policy
Articles
- Page Path
- HOME > Diabetes Metab J > Volume 36(6); 2012 > Article
-
Original ArticleObesity and Metabolic Syndrome Relation of Absolute or Relative Adiposity to Insulin Resistance, Retinol Binding Protein-4, Leptin, and Adiponectin in Type 2 Diabetes
- You Lim Kim1, Tae Kyun Kim1, Eun Sun Cheong1, Dong Geum Shin1, Gyu Sik Choi1, Jihye Jung1, Kyung-Ah Han1,2, Kyung Wan Min1,2
-
Diabetes & Metabolism Journal 2012;36(6):415-421.
DOI: https://doi.org/10.4093/dmj.2012.36.6.415
Published online: December 12, 2012
1Department of Internal Medicine, Eulji General Hospital, Eulji University School of Medicine, Seoul, Korea.
2Diabetes Center, Eulji General Hospital, Eulji University School of Medicine, Seoul, Korea.
- Corresponding author: Kyung Wan Min. Diabetes Center, Eulji General Hospital, 14 Hangeulbiseong-ro, Nowon-gu, Seoul 139-872, Korea. minyungwa@gmail.com
• Received: May 3, 2012 • Accepted: July 6, 2012
Copyright © 2012 Korean Diabetes Association
This is an Open Access article distributed under the terms of the Creative Commons Attribution Non-Commercial License (http://creativecommons.org/licenses/by-nc/3.0/) which permits unrestricted non-commercial use, distribution, and reproduction in any medium, provided the original work is properly cited.
ABSTRACT
-
Background
- Central fat mass (CFM) correlates with insulin resistance and increases the risk of type 2 diabetes and cardiovascular complications; however, peripheral fat mass (PFM) is associated with insulin sensitivity. The aim of this study was to investigate the relation of absolute and relative regional adiposity to insulin resistance index and adipokines in type 2 diabetes.
-
Methods
- Total of 83 overweighted-Korean women with type 2 diabetes were enrolled, and rate constants for plasma glucose disappearance (KITT) and serum adipokines, such as retinol binding protein-4 (RBP4), leptin, and adiponectin, were measured. Using dual X-ray absorptiometry, trunk fat mass (in kilograms) was defined as CFM, sum of fat mass on the lower extremities (in kilograms) as PFM, and sum of CFM and PFM as total fat mass (TFM). PFM/TFM ratio, CFM/TFM ratio, and PFM/CFM ratio were defined as relative adiposity.
-
Results
- Median age was 55.9 years, mean body mass index 27.2 kg/m2, and mean HbA1c level 7.12±0.84%. KITT was positively associated with PMF/TFM ratio, PMF/CFM ratio, and negatively with CFM/TFM ratio, but was not associated with TFM, PFM, or CFM. RBP4 levels also had a significant relationship with PMF/TFM ratio and PMF/CFM ratio. Adiponectin, leptin, and apolipoprotein A levels were related to absolute adiposity, while only adiponectin to relative adiposity. In correlation analysis, KITT in type 2 diabetes was positively related with HbA1c, fasting glucose, RBP4, and free fatty acid.
-
Conclusion
- These results suggest that increased relative amount of peripheral fat mass may aggravate insulin resistance in type 2 diabetes.
- Fat accumulation in the human body releases several adipokines from adipocytes, some of which are known to lead to elevate insulin resistance and to cause metabolic syndrome [1] as well as type 2 diabetes [2]. Ford et al. [3] have reported that for 1 kilogram of weight gain, the risk of diabetes increases by 4.5% to 9%. Obesity due to a proliferation of fat tissue not only increases insulin resistance, but is also closely related to abnormal glucose metabolism [4]. Previous studies have reported that a higher body mass index (BMI) results in a higher risk of type 2 diabetes [4]; however, the general pattern of obesity in diabetic subjects involves fat accumulation in the abdomen regardless of sex [5], and such central fat accumulation leads to peripheral insulin resistance and increases the risk of cardiovascular complications. Free fatty acids released from abdominal fat are known to play a major role in the development of such insulin resistance [6].
- Several studies have analyzed the association among insulin resistance, body fat distribution, and race. In a study by Boutcher et al. [7], a greater amount of trunk fat was associated with severity of insulin resistance in Austrian women, while in Chinese women, insulin resistance was associated with a smaller amount of fat in the lower extremities. Trunk fat and fat located in the lower extremities cause separate effects on the metabolism of the body. Generally, the former causes metabolic diseases, such as cardiovascular diseases and diabetes, while according to previous studies, the latter may exert a preventive effect on such metabolic diseases [8,9].
- Studies on fat distribution and their effects on the body have been performed in obese subjects; however, few researches have existed about obese subjects with diabetes. Studies by Kelley et al. [10] and Kotronen et al. [11] have reported more hepatic, intestinal, and intramuscular fat and less subcutaneous fat in diabetic subjects compared to obese, non-diabetic subjects. In other words, fat distribution in diabetic subjects is different from that of subjects without diabetes [12].
- Therefore, we have attempted to investigate the specific type of body fat distribution related to insulin resistance and compute relative adiposity for comparison with body fat distribution. We have also investigated the association between body fat distribution and adipokines, such as adiponectin, leptin, and retinol binding protein-4 (RBP4).
INTRODUCTION
- Subjects
- A total of 83 female subjects with type 2 diabetes who were visiting the Diabetes Mellitus Center of Eulji General Hospital in Seoul, Korea were recruited for this study. The diagnosis of type 2 diabetes was made in accordance with the diagnostic criteria set by the World Health Organization (WHO), and among the diabetic subjects, overweight subjects with BMIs greater than 23 kg/m2 and glycosylated hemoglobin (HbA1c) between 5.5% and 10.0% were included. Exclusion criteria included type 1 diabetes and heart diseases, including congestive heart failure, uncontrolled arrhythmia, and uncontrolled valvular diseases. Subjects with diseases contraindicating mild exercise necessary for glycemic control were also excluded.
- Methods
- The height, weight, waist circumference, and hip circumference of the subjects were measured at the start of the study. Height and weight were measured in light clothing, and BMI was calculated by dividing weight (in kilograms) by the square of height (in meters).
- For biochemical measurements, venous blood was sampled after a minimum of 10 hours of fasting, and the serum was separated by centrifuging at 3,000 rpm for 15 minutes. The serum was stored at -70℃ until the time of analysis. Fasting glucose was measured with the glucose oxidase method, and glycated albumin was measured using high-performance liquid chromatography (HPLC). The maximum value of serum adipokines was measured with an enzyme-linked immunosorption assay (ELISA) (R&D Systems Inc., Minneapolis, MN, USA): the intra- and inter-assay coefficients of variability (CV) values were 8.3% and 8.3%, respectively. Serum leptin (intraand inter-assay values of 5.8% and 12.8%, respectively) [13] and apolipoprotein A (ApoA) levels were also measured with ELISA (American Laboratory Products Company, Windham, NH, USA).
- RBP4, a biochemical index used in conjunction with insulin resistance, was measured by amplifying the subjects' serum samples, which were stored at -70℃, with a radioimmunoassay (RIA) (Phoenix, Belmont, CA, USA): the intra-assay CV value was 8% [14].
- The rate constant for plasma glucose disappearance (KITT) was employed to assess insulin resistance. An insulin tolerance test was performed on the subjects after 10 hours of fasting. A 20-gauge catheter was inserted into a vein in each hand: one to sample blood and the other to infuse glucose. The subjects rested for 20 to 30 minutes after catheter insertion, and a heating pad was used to maintain the temperature of the sampling site between 60℃ to 70℃. The sample was used to obtain arterialized venous blood. Insulin (Humulin, RI 100 U/mL), diluted by a factor of 100, was administered to the subjects via the antebrachial vein, with 1 kg of body weight calculated as 0.1 U at rest. Arterialized venous blood was sampled at baseline, 3, 6, 12, and 15 minutes after insulin administration. To prevent hypoglycemic events, 100 mL of 20% glucose solution was infused intravenously immediately after venous sampling at 15 minutes, and the sampled blood was immediately centrifuged to measure plasma glucose. The plasma glucose level measured during the insulin tolerance test was input to a computer program converting the values into natural log form, and the slope of the regression curve constructed from the values measured at 3 and 15 minutes of the insulin tolerance test was obtained using SPSS software for Windows version 17.0 (SPSS Inc., Chicago, IL, USA). The half-life of plasma glucose, or the time required for reducing baseline plasma glucose by half (t1/2) was calculated from the slope of the regression curve, and KITT was obtained by the following equation:
- Body fat mass and muscle mass were measured with dual-energy X-ray absorptiometry (DXA) (GE Lunar Prodigy; General Electric Medical Systems, Milwaukee, WI, USA) to assess the obesity type of the subjects. The subjects were lightly clothed and were scanned from head to toe while comfortably lying on the examination bed-the test required approximately 10 to 20 minutes to complete. Body composition was divided into body fat and body muscle mass, and the values of the whole body, arms, legs, and trunk were evaluated.
- The fat mass of the whole body as evaluated by DXA was defined as total fat mass (TFM), and the fat distributed at the trunk was defined as central fat mass (CFM). In addition, the fat mass of the arms and the legs were combined and defined as peripheral fat mass (PFM). The indices representing relative adipose distribution were derived by obtaining the ratios of PFM to TFM, CFM to TFM, and PFM to CFM.
- Data were analyzed using SPSS software for Windows version 17.0 (SPSS Inc.). Data are presented as mean and standard deviation, and log-transformation was employed for variables with non-normal distribution. The association between absolute and relative adiposity, adipokine levels, such as adiponectin and leptin, BMI, and insulin resistance was assessed with Pearson's correlation analysis. Statistical significance was defined as a P value less than 0.05.
METHODS
Anthropometric and biochemical measurements
Insulin resistance
Fat distribution measurement and calculation of total fat mass and relative adiposity
Data and statistical analysis
- Clinical characteristics of study subjects
- A total of 83 subjects were enrolled in this study. The mean age of the subjects was 55.93±6.85 years, and their mean duration of diabetes was 4.6±4.63 years. The mean height and weight was 156.89±4.48 cm and 66.93±7.23 kg, respectively, with the mean BMI being 27.20±2.88 kg/m2. Mean fasting plasma glucose and HbA1c levels were 132.11±23.41 mg/dL and 7.12±0.84%, respectively. The mean and standard deviation values for adiponectin, leptin, and ApoA were 5.68±2.62 µg/mL, 11.57±6.37 ng/dL, 122.39±21.7 mg/dL, respectively. Also, the mean high sensitivity C-reactive protein (hsCRP) level was 0.24±0.59 mg/L, and the mean RBP4 value was found to be 74.24±28.41 µg/mL (Table 1).
- Association between insulin sensitivity and absolute adiposity
- The statistical significance of the association between indices of insulin resistance (KITT , RBP4) and absolute adiposity indices (TFM, CFM, PFM) measured with DXA was examined. As shown in Table 2, neither RBP4 levels nor KITT were significantly associated with TFM, PFM, or CFM (P>0.05).
- Association between insulin sensitivity and relative adiposity
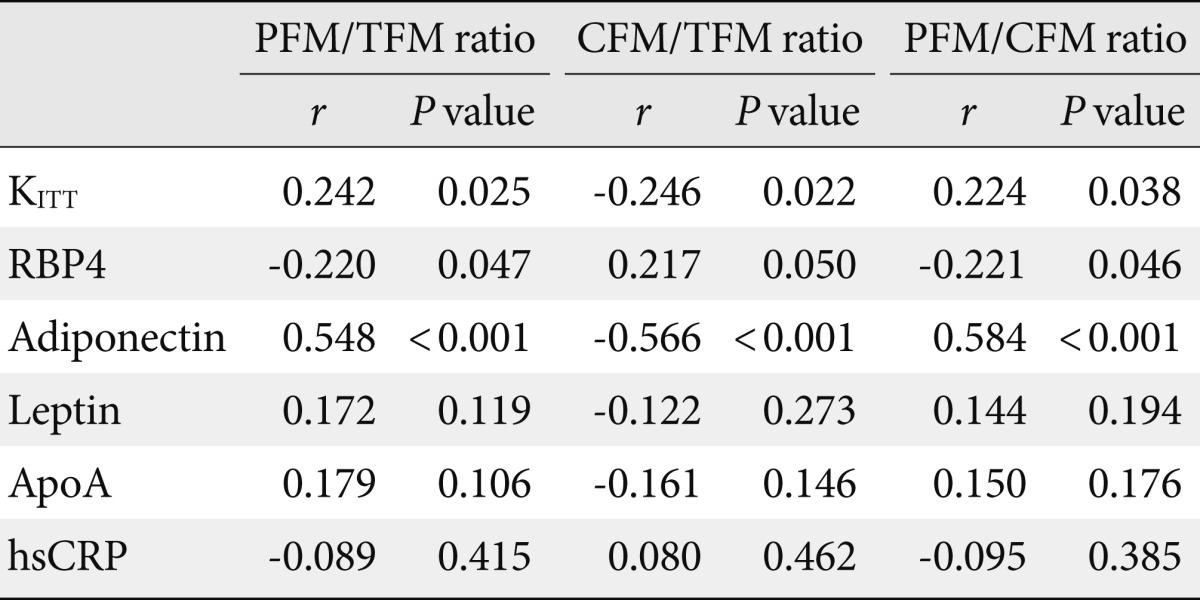
- The association between indices of insulin sensitivity and relative adiposity (PFM/TFM ratio, CFM/TFM ratio, PFM/CFM ratio) as measured and presented by DXA was also examined. RBP4 levels were positively associated with CFM/TFM ratio and negatively associated with PFM/TFM ratio and PMF/CFM ratio. However, an opposite finding was made with KITT, where we found a positive association with PFM/TFM ratio and PMF/CFM ratio, and a negative association with CFM/TFM ratio (P<0.05) (Table 3, Fig. 1).
- Association among adipokines, body fat distribution, and insulin sensitivity
- The association between adipocytokines and absolute and relative adiposity indices was investigated. As shown in Table 2, adiponectin, leptin, and ApoA levels demonstrated significant association with TFM, CFM, and PFM (P<0.05), but only adiponectin was significantly associated with indices of relative adiposity-PFM/TFM ratio, CFM/TFM ratio, and PFM/CFM ratio (P<0.05) (Table 3).
- Factors associated with insulin sensitivity in type 2 diabetes
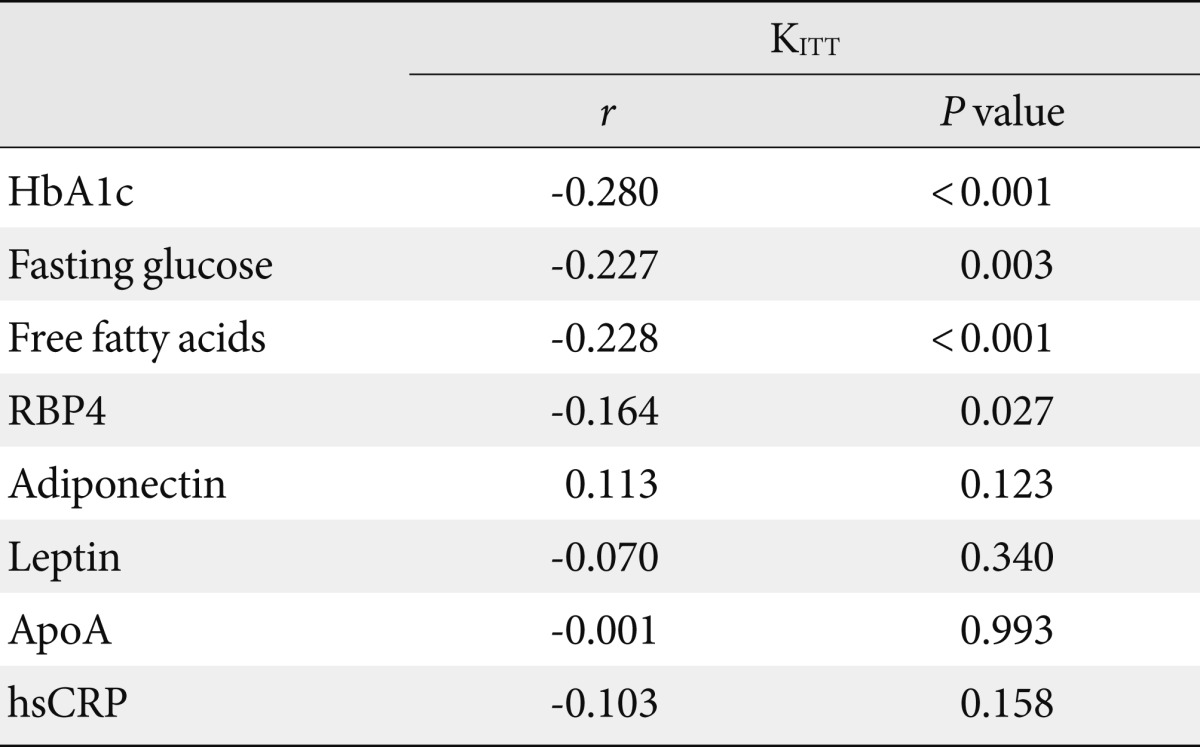
- Table 4 presents an analysis of variables associated with insulin resistance in type 2 diabetes, in which KITT, a marker of insulin resistance, is significantly associated with fasting plasma glucose and HbA1c levels-both indices related to glycemia-as well as with free fatty acid and RBP4 levels (P<0.05) (Fig. 1). On the other hand, levels of other adipokines, such as adiponectin, leptin, and ApoA, were not significantly associated with KITT (P>0.05). Levels of hsCRP also were not associated with KITT (P=0.158) (Table 4).
RESULTS
- This study measured the absolute fat mass of various parts of the body with the aid of DXA in subjects with type 2 diabetes mellitus and calculated relative adiposity, which was defined as the ratio of fat mass between body regions. Furthermore, the association between these indices and insulin resistance and various adipokines was investigated. It was found that RBP4 and KITT values, which are related to insulin resistance, show statistically significant associations with PFM/TFM ratio, CFM/TFM ratio, and PFM/CFM ratio, which were calculated to demonstrate the relative adiposity of the subjects. In addition, levels of adipokines, such as adiponectin, leptin, and ApoA, were found to be associated with the absolute fat mass of the body regions.
- Previous studies have focused on total fat mass, and have argued that obesity resulting from an excessive accumulation of fat within the adipose tissue causes functional impairment of the adipose tissue, and that adipokines released from adipose tissue cause insulin resistance, leading to metabolic diseases, such as type 2 diabetes [15]. However, Yoon et al. [16] have compared the prevalence of chronic diseases related to insulin resistance, such as metabolic syndrome and type 2 diabetes mellitus, between Asians and Europeans with similar BMIs and have found that subjects with BMIs less than 25 kg/m2 need to be considered as high-risk for type 2 diabetes or heart diseases. This study suggests that understanding metabolic syndrome, which causes insulin resistance, not only requires knowledge of absolute fat mass in an individual, but also insight into the relative distribution of fat within the body. In Asian countries, including South Korea, a high prevalence of metabolic diseases, such as diabetes and hyperlipidemia, has been noted in subjects with normal BMI, which strengthens the suggestion. Numerous researchers have devised and studied various indices to explain this phenomenon, and this study incorporated PFM/TFM ratio, CFM/TFM ratio, and PFM/CFM ratio to present relative adiposity.
- In a study by Aasen et al. [17], total fat mass, trunk fat mass, and leg fat mass were obtained with DXA, from which leg/trunk fat mass ratio was calculated and an association between fat mass ratio and homeostasis model assessment of insulin resistance (HOMA-IR) was ultimately drawn. While this study is significant in that it used leg/trunk fat mass ratio to investigate relative adiposity and link it to insulin resistance, it included both pre- and post-menopausal women, overlooking the possibility that menopause-related hormonal changes may influence insulin resistance.
- This study also analyzed the association between adipokines secreted from adipose tissue and absolute and relative adiposity. First, it was found that while adiponectin, leptin, and ApoA are associated with TFM, CFM, and PFM, they are not related to ratios of absolute fat mass, with the exception of adiponectin, which showed an association with both absolute fat mass and fat mass ratios. Leptin and adiponectin, which are generally released from adipose tissue, tend to show an increasing or decreasing pattern depending on total body fat mass: the former is more strongly related to behavior of appetite, while adiponectin is more involved with insulin resistance or glucose metabolism [18]. These findings may explain the significant association between adiponectin and both total (TFM, CFM, PFM) and relative adiposity (fat mass ratios).
- While previous studies [19,20] have found an association between adiponectin and insulin resistance, adiponectin was found to be unrelated to insulin sensitivity in this study, as were other adipokines. The results of preceding studies were based on subject groups with simple obesity or metabolic syndrome. Such studies generally define obesity on the basis of total fat mass, as does WHO, which may be inadequate in perfectly explaining type 2 diabetes as a metabolic complication of obesity. Adiponectin alone does not sufficiently explain the problems resulting from diabetes, and new concepts are currently being created to overcome the incompleteness; for example, the incorporation of leptin/adiponectin ratio [1].
- While RBP4 released from adipocytes is an adipokine released from adipocytes [21], it is more strongly associated with intestinal fat mass than with total fat mass, and is known to increase in an elevated insulin resistance setting [22]. Graham et al. [23] investigated the relationship between serum RBP4 concentration and insulin resistance in obese and diabetic subjects and found that RBP4 concentrations are strongly associated with insulin resistance in both type 2 diabetic and non-diabetic subjects, while also influencing metabolic syndrome and cardiovascular heart disease. Additionally, a study on a Chinese population by Jia et al. [14] reported that intestinal fat, especially in a subject group with abdominal obesity, is significantly associated with HOMA-IR regardless of diabetic state. In the same study, RBP4 levels were related to the distribution of fat and contributed to insulin resistance, causing it to become a risk factor for type 2 diabetes mellitus, as well as for cardiovascular diseases.
- The aforementioned studies analyzed the relationship between RBP4 levels and KITT or HOMA-IR values, and were performed based on the hypothesis that fat accumulation at a specific site-especially at the abdomen-leads to insulin resistance due to secretion of RBP4 from the accumulated fat, ultimately resulting in metabolic syndrome and diabetes mellitus. This study also examined the association between RBP4 or KITT values and absolute adiposity (TFM, CFM, PFM) or relative adiposity (PFM/TFM ratio, CFM/TFM ratio, PFM/CFM ratio), and found that significant associations are found more frequently in relative fat distribution than in absolute fat mass. This result may become the basis for explaining the high prevalence of chronic disease in Asian subjects, who usually have normal BMIs. This study further developed the idea of site-specific fat accumulation leading to metabolic disorders and measured PFM/TFM ratio, CFM/TFM ratio, and PFM/CFM ratio in an attempt to determine and assess relative adiposity. These ratios combine central fat, which is associated with insulin resistance, and peripheral fat, which is related to insulin sensitivity [24], in a single index, providing an understanding on the relative distribution of fat within the body. A study by Kang et al. [25] reported that fat accumulation around the pelvis, rather than abdominal or intestinal fat, is associated with metabolic diseases in older subjects. However, the indices suggested in this study are expected to be a useful in understanding a subject's relative adiposity regardless of his or her age.
- Overall, this study examined whether fat accumulation at a certain site in the body is associated with insulin resistance, and incorporated the concept of a relative adiposity index to confirm the association. As in previous studies, the association between total fat mass and adipokines-especially adiponectin and leptin-has been reconfirmed. Furthermore, this study employed ratios of fat mass between different regions of the body, and demonstrated statistically significant relationships between those ratios and RBP4 or KITT values, providing evidence for predicting insulin resistance. Also, the results of this study found that when approaching metabolic diseases, such as type 2 diabetes, in Asian populations, which has received social and economic attention due to the recently increasing prevalence, focus needs to be made not on simple fat accumulation, but on the distribution of fat within the body, and as a result, relative adiposity indices should be taken into consideration. Therefore, when managing chronic patients-for example, patients with metabolic syndrome or type 2 diabetes-attention may also need to be paid to subjects with normal BMIs who demonstrate elevated relative adiposity, and indices such as PFM/TFM ratio, CFM/TFM ratio, and PFM/CFM ratio are expected to act as a reference for classification of these subject groups.
DISCUSSION
- 1. Oda N, Imamura S, Fujita T, Uchida Y, Inagaki K, Kakizawa H, Hayakawa N, Suzuki A, Takeda J, Horikawa Y, Itoh M. The ratio of leptin to adiponectin can be used as an index of insulin resistance. Metabolism 2008;57:268-273. ArticlePubMed
- 2. Rush EC, Freitas I, Plank LD. Body size, body composition and fat distribution: comparative analysis of European, Maori, Pacific Island and Asian Indian adults. Br J Nutr 2009;102:632-641. ArticlePubMed
- 3. Ford ES, Williamson DF, Liu S. Weight change and diabetes incidence: findings from a national cohort of US adults. Am J Epidemiol 1997;146:214-222. ArticlePubMed
- 4. Colditz GA, Willett WC, Stampfer MJ, Manson JE, Hennekens CH, Arky RA, Speizer FE. Weight as a risk factor for clinical diabetes in women. Am J Epidemiol 1990;132:501-513. ArticlePubMed
- 5. Resnick HE, Howard BV. Diabetes and cardiovascular disease. Annu Rev Med 2002;53:245-267. ArticlePubMed
- 6. Marceau P, Biron S, Hould FS, Marceau S, Simard S, Thung SN, Kral JG. Liver pathology and the metabolic syndrome X in severe obesity. J Clin Endocrinol Metab 1999;84:1513-1517. ArticlePubMed
- 7. Boutcher SH, Dunn SL, Gail Trapp E, Freund J. Regional adiposity distribution and insulin resistance in young Chinese and European Australian women. Scand J Clin Lab Invest 2011;71:653-657. ArticlePubMed
- 8. Seidell JC, Perusse L, Despres JP, Bouchard C. Waist and hip circumferences have independent and opposite effects on cardiovascular disease risk factors: the Quebec Family Study. Am J Clin Nutr 2001;74:315-321. ArticlePubMed
- 9. Snijder MB, Dekker JM, Visser M, Bouter LM, Stehouwer CD, Yudkin JS, Heine RJ, Nijpels G, Seidell JC. Trunk fat and leg fat have independent and opposite associations with fasting and postload glucose levels: the Hoorn study. Diabetes Care 2004;27:372-377. PubMed
- 10. Kelley DE, McKolanis TM, Hegazi RA, Kuller LH, Kalhan SC. Fatty liver in type 2 diabetes mellitus: relation to regional adiposity, fatty acids, and insulin resistance. Am J Physiol Endocrinol Metab 2003;285:E906-E916. ArticlePubMed
- 11. Kotronen A, Juurinen L, Hakkarainen A, Westerbacka J, Corner A, Bergholm R, Yki-Jarvinen H. Liver fat is increased in type 2 diabetic patients and underestimated by serum alanine aminotransferase compared with equally obese nondiabetic subjects. Diabetes Care 2008;31:165-169. ArticlePubMedPDF
- 12. Gallagher D, Kelley DE, Yim JE, Spence N, Albu J, Boxt L, Pi-Sunyer FX, Heshka S. MRI Ancillary Study Group of the Look AHEAD Research Group. Adipose tissue distribution is different in type 2 diabetes. Am J Clin Nutr 2009;89:807-814. ArticlePubMedPMC
- 13. Marques-Vidal P, Bochud M, Paccaud F, Mooser V, Waeber G, Vollenweider P. Distribution of plasma levels of adiponectin and leptin in an adult Caucasian population. Clin Endocrinol (Oxf) 2010;72:38-46. ArticlePubMed
- 14. Jia W, Wu H, Bao Y, Wang C, Lu J, Zhu J, Xiang K. Association of serum retinol-binding protein 4 and visceral adiposity in Chinese subjects with and without type 2 diabetes. J Clin Endocrinol Metab 2007;92:3224-3229. ArticlePubMedPDF
- 15. Yu Y, Venners SA, Wang B, Brickman WJ, Zimmerman D, Li Z, Wang L, Liu X, Tang G, Xing H, Xu X, Wang X. Association of central adiposity with prediabetes and decreased insulin sensitivity in rural Chinese normal-weight and overweight women. Metabolism 2010;59:1047-1053. ArticlePubMedPMC
- 16. Yoon KH, Lee JH, Kim JW, Cho JH, Choi YH, Ko SH, Zimmet P, Son HY. Epidemic obesity and type 2 diabetes in Asia. Lancet 2006;368:1681-1688. ArticlePubMed
- 17. Aasen G, Fagertun H, Halse J. Regional fat mass by DXA: high leg fat mass attenuates the relative risk of insulin resistance and dyslipidaemia in obese but not in overweight postmenopausal women. Scand J Clin Lab Invest 2008;68:204-211. ArticlePubMed
- 18. Hajer GR, van Haeften TW, Visseren FL. Adipose tissue dysfunction in obesity, diabetes, and vascular diseases. Eur Heart J 2008;29:2959-2971. ArticlePubMed
- 19. Yamauchi T, Kamon J, Waki H, Terauchi Y, Kubota N, Hara K, Mori Y, Ide T, Murakami K, Tsuboyama-Kasaoka N, Ezaki O, Akanuma Y, Gavrilova O, Vinson C, Reitman ML, Kagechika H, Shudo K, Yoda M, Nakano Y, Tobe K, Nagai R, Kimura S, Tomita M, Froguel P, Kadowaki T. The fat-derived hormone adiponectin reverses insulin resistance associated with both lipoatrophy and obesity. Nat Med 2001;7:941-946. ArticlePubMedPDF
- 20. Cnop M, Havel PJ, Utzschneider KM, Carr DB, Sinha MK, Boyko EJ, Retzlaff BM, Knopp RH, Brunzell JD, Kahn SE. Relationship of adiponectin to body fat distribution, insulin sensitivity and plasma lipoproteins: evidence for independent roles of age and sex. Diabetologia 2003;46:459-469. ArticlePubMedPDF
- 21. Wu Y, Li H, Loos RJ, Qi Q, Hu FB, Liu Y, Lin X. RBP4 variants are significantly associated with plasma RBP4 levels and hypertriglyceridemia risk in Chinese Hans. J Lipid Res 2009;50:1479-1486. ArticlePubMedPMC
- 22. Shaker O, El-Shehaby A, Zakaria A, Mostafa N, Talaat S, Katsiki N, Mikhailidis DP. Plasma visfatin and retinol binding protein-4 levels in patients with type 2 diabetes mellitus and their relationship to adiposity and fatty liver. Clin Biochem 2011;44:1457-1463. ArticlePubMed
- 23. Graham TE, Yang Q, Bluher M, Hammarstedt A, Ciaraldi TP, Henry RR, Wason CJ, Oberbach A, Jansson PA, Smith U, Kahn BB. Retinol-binding protein 4 and insulin resistance in lean, obese, and diabetic subjects. N Engl J Med 2006;354:2552-2563. ArticlePubMed
- 24. Wu H, Qi Q, Yu Z, Sun Q, Wang J, Franco OH, Sun L, Li H, Liu Y, Hu FB, Lin X. Independent and opposite associations of trunk and leg fat depots with adipokines, inflammatory markers, and metabolic syndrome in middle-aged and older Chinese men and women. J Clin Endocrinol Metab 2010;95:4389-4398. ArticlePubMed
- 25. Kang SM, Yoon JW, Ahn HY, Kim SY, Lee KH, Shin H, Choi SH, Park KS, Jang HC, Lim S. Android fat depot is more closely associated with metabolic syndrome than abdominal visceral fat in elderly people. PLoS One 2011;6:e27694ArticlePubMedPMC
REFERENCES
Fig. 1The relation of insulin resistance to relative adiposity and adiponectin. KITT, rate constant for plasma glucose disappearance.
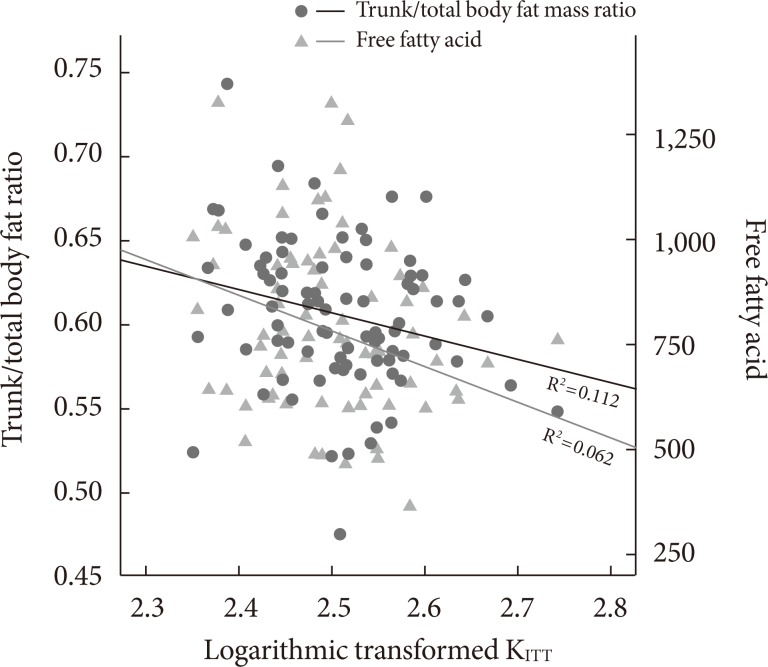

Table 2Correlation between absolute regional adiposity, insulin sensitivity, and adipokines in type 2 diabetes (absolute regional and total fat mass)
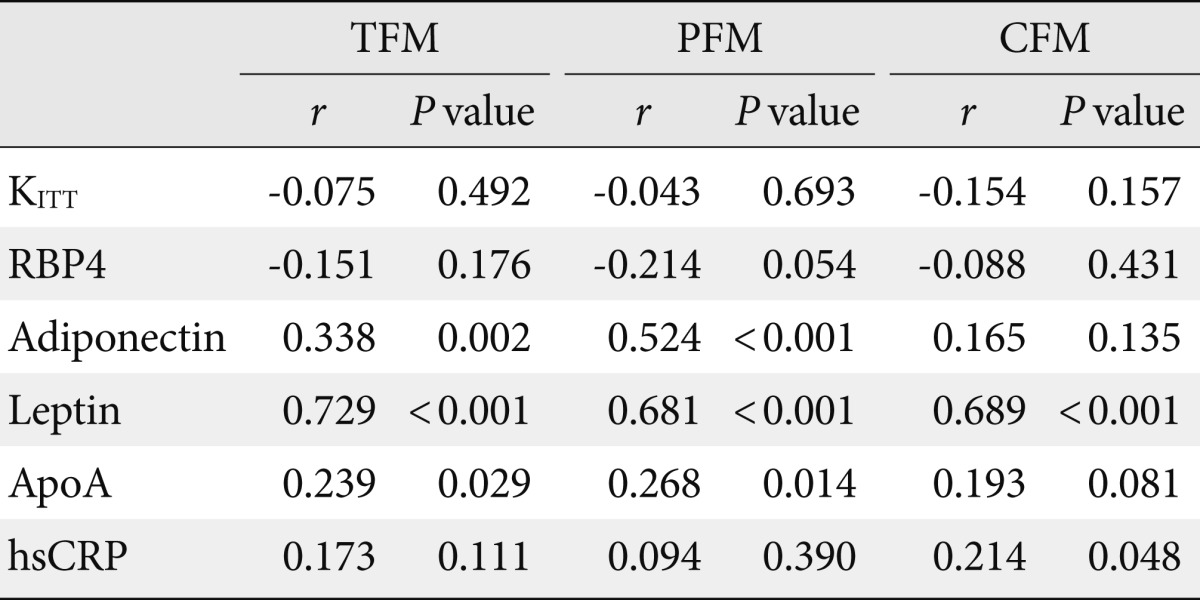

Figure & Data
References
Citations
Citations to this article as recorded by 

- Retinol-binding protein-4 and nonalcoholic fatty liver disease
Hangkai Huang, Chengfu Xu
Chinese Medical Journal.2022; 135(10): 1182. CrossRef - MANF in POMC Neurons Promotes Brown Adipose Tissue Thermogenesis and Protects Against Diet-Induced Obesity
Qin Tang, Qinhui Liu, Jiahui Li, Jiamin Yan, Xiandan Jing, Jinhang Zhang, Yan Xia, Ying Xu, Yanping Li, Jinhan He
Diabetes.2022; 71(11): 2344. CrossRef - The relation between body fat distribution, plasma concentrations of adipokines and the metabolic syndrome in patients with clinically manifest vascular disease
Ilse M Schrover, Yolanda van der Graaf, Wilko Spiering, Frank LJ Visseren
European Journal of Preventive Cardiology.2018; 25(14): 1548. CrossRef - Visceral Fat Mass Has Stronger Associations with Diabetes and Prediabetes than Other Anthropometric Obesity Indicators among Korean Adults
Suk Hwa Jung, Kyoung Hwa Ha, Dae Jung Kim
Yonsei Medical Journal.2016; 57(3): 674. CrossRef - Adipokines, cytokines and body fat stores in hepatitis C virus liver steatosis
Emilio González-Reimers
World Journal of Hepatology.2016; 8(1): 74. CrossRef - The effect of resveratrol on the expression of AdipoR1 in kidneys of diabetic nephropathy
Hongfei Ji, Lina Wu, Xiaokun Ma, Xiaojun Ma, Guijun Qin
Molecular Biology Reports.2014; 41(4): 2151. CrossRef - Retinol-binding protein 4 and insulin resistance are related to body fat in primary and secondary schoolchildren: the Ouro Preto study
Ana Paula Pereira Castro, Ana Paula Carlos Cândido, Roney Luiz de Carvalho Nicolato, Ivo Santana Caldas, George Luiz Lins Machado-Coelho
European Journal of Nutrition.2014; 53(2): 433. CrossRef - The Effects of Marathon Running on Retinol Binding Protein 4 and C-reactive Protein Levels in Healthy Middle-aged Korean Men
Jisuk Chae, Sungmin Kim, Junga Lee, Justin Y. Jeon
The Korean Journal of Obesity.2014; 23(3): 203. CrossRef - Modeling metabolic homeostasis and nutrient sensing in Drosophila: implications for aging and metabolic diseases
Edward Owusu-Ansah, Norbert Perrimon
Disease Models & Mechanisms.2014; 7(3): 343. CrossRef - Beneficial Effects of Fresh and Fermented Kimchi in Prediabetic Individuals
So-Yeon An, Min Suk Lee, Ja Young Jeon, Eun Suk Ha, Tae Ho Kim, Ja Young Yoon, Chang-Ok Ok, Hye-Kyoung Lee, Won-Sun Hwang, Sun Jung Choe, Seung Jin Han, Hae Jin Kim, Dae Jung Kim, Kwan-Woo Lee
Annals of Nutrition and Metabolism.2013; 63(1-2): 111. CrossRef - Regional Adiposity, Adipokines, and Insulin Resistance in Type 2 Diabetes
Jee-Young Oh
Diabetes & Metabolism Journal.2012; 36(6): 412. CrossRef

 KDA
KDA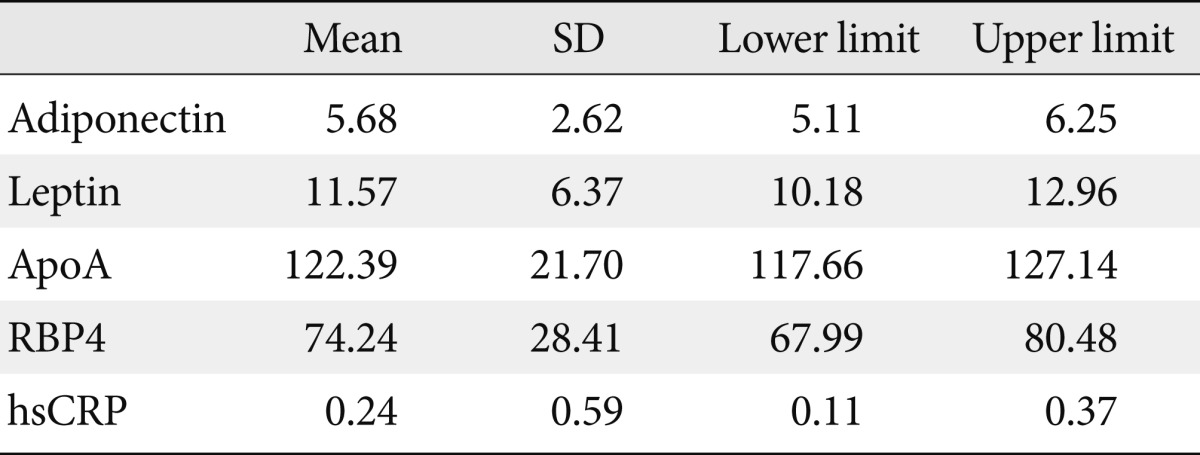
 PubReader
 Cite
Cite


