- Current
- Browse
- Collections
-
For contributors
- For Authors
- Instructions to authors
- Article processing charge
- e-submission
- For Reviewers
- Instructions for reviewers
- How to become a reviewer
- Best reviewers
- For Readers
- Readership
- Subscription
- Permission guidelines
- About
- Editorial policy
Articles
- Page Path
- HOME > Diabetes Metab J > Volume 41(3); 2017 > Article
-
Original ArticleOthers Satisfaction Survey on Information Technology-Based Glucose Monitoring System Targeting Diabetes Mellitus in Private Local Clinics in Korea
-
Hun-Sung Kim1,2, So Jung Yang1, Yoo Jin Jeong1, Young-Eun Kim3,4, Seok-Won Hong3, Jae Hyoung Cho2

-
Diabetes & Metabolism Journal 2017;41(3):213-222.
DOI: https://doi.org/10.4093/dmj.2017.41.3.213
Published online: June 21, 2017
1Department of Medical Informatics, College of Medicine, The Catholic University of Korea, Seoul, Korea.
2Department of Endocrinology and Metabolism, College of Medicine, The Catholic University of Korea, Seoul, Korea.
3National Evidence-based healthcare Collaborating Agency (NECA), Seoul, Korea.
4Department of Preventive Medicine, Korea University College of Medicine, Seoul, Korea.
- Corresponding author: Jae Hyoung Cho. Department of Endocrinology and Metabolism, College of Medicine, The Catholic University of Korea, 222 Banpo-daero, Seocho-gu, Seoul 06591, Korea. drhopper@catholic.ac.kr
Copyright © 2017 Korean Diabetes Association
This is an Open Access article distributed under the terms of the Creative Commons Attribution Non-Commercial License (http://creativecommons.org/licenses/by-nc/4.0/) which permits unrestricted non-commercial use, distribution, and reproduction in any medium, provided the original work is properly cited.
ABSTRACT
-
Background
- Private local clinics in Korea have little experience with information technology (IT)-based glucose monitoring (ITGM). Our aim is to examine user satisfaction and the possibility of using ITGM service practically.
-
Methods
- Patients sent their blood glucose levels to physicians in local clinics. The physicians reviewed the blood glucose values online and provided personal consultations through text messaging or phone calls. Thereafter, a satisfaction survey on the ITGM service, the modified Morisky scale, and patient assessment of chronic illness care were administered.
-
Results
- One hundred and seventy patients from seven private local clinics used the ITGM. Overall satisfaction, including that about the ITGM service, the device, and its usefulness, was rated higher than “mostly satisfied” (score 4.2±0.8 out of 5.0) and even higher among the elderly. Satisfaction was positively associated with age, especially in those older than 60 years. The main reason for intent for future use of the service was the time/place flexibility. Highly motivated patients tended to answer positively regarding information satisfaction (P=0.0377).
-
Conclusion
- Our study is the first to investigate ITGM satisfaction in private local clinics. The feasibility of users utilizing ITGM should be clarified, and future clinical research on the service's clinical effects and cost-benefit analysis is needed.
- The global population of diabetes mellitus (DM) is increasing [12]. With the development of medical science, many new oral hypoglycemic agents (OHAs) have been developed. However, the population of DM patients unable to reach the target achievement of glycosylated hemoglobin (HbA1c) is high [3]. The use of information technology (IT) to regulate blood glucose levels and facilitate care programs for diabetes is increasing. Mobile phones, in particular, have had a positive impact as healthcare tools by connecting physicians and patients, and many studies on the topic have reported positive results [45678910].
- Most of the blood glucose monitoring systems that use the existing IT systems, however, concentrated on large tertiary teaching hospitals for clinical research [5]. The IT-based glucose monitoring (ITGM) service, which is mostly studied and applied at tertiary teaching hospitals, has been demonstrated in diverse aspects, including feasibility [5] and clinical effect [4511]. However, the management of patients' lifestyles is usually conducted by private local clinics instead of tertiary teaching hospitals. Thus, studies on the feasibility and clinical effects of ITGM service should be conducted at private local clinics.
- However, because private local clinics have no experience with an ITGM service, it would be difficult for them to operate the ITGM service by themselves. Thus, the present study aimed to apply ITGM service in the private local clinics with no experience with ITGM while they receive support and assistance from tertiary teaching hospitals. Before investigating the clinical effects and cost benefits of an ITGM service in the private local clinic, users' feasibility has to be clarified. A survey on an ITGM service was conducted on private local clinics to investigate the satisfaction of the patients. The purpose of the survey was to check the possibility and practicality of using the ITGM service in private local clinics to improve remote healthcare monitoring and make the milestone of future clinical research about the clinical effects or cost benefit.
INTRODUCTION
- Study population
- The subjects were volunteers from nine private local clinics located around the capital. The inclusion criteria were for participants aged 20 to 80 years who have had type 1 or 2 DM for more than 1 year, can operate smartphone applications, and are able to provide their voluntary informed consent. We excluded participants who had an insulin pump, had a serious medical disease, had not taken their medication regularly in the 3 months before enrollment, or those who were engaged in other clinical studies. The physicians could reject the participation of inappropriate patients such as those with internet addiction. Participants were also excluded if they deleted the application during the survey and did not respond.
- Study design
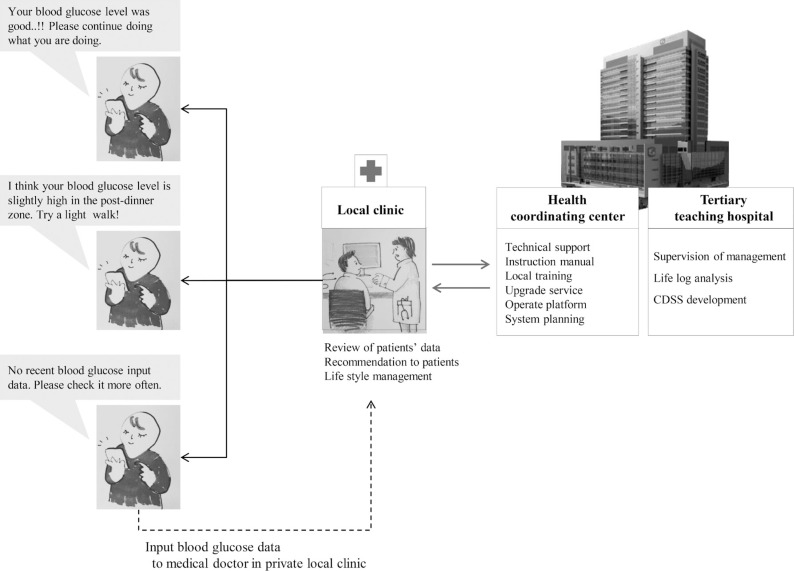
- The physicians fully informed the participants about the smartphone application “Hicare Smart K, version 1.0.4” (Insung Information, Seoul, Korea). The patients sent their blood glucose values to physicians at the private local clinic. The physicians then checked and monitored the blood glucose values online (Fig. 1) and gave personal consultations once a week through text message or phone call. The number of recommended blood glucose inputs were twice a week if the user was not taking any OHA and showed lower than 7% of HbA1c, once a day if the user was taking OHA and showed lower than 7% HbA1c, and more than once a day if the user was taking OHA and had 7% to 8% HbA1c, or if the user's HbA1c was higher than 8% regardless of taking medicine. In addition, the number of recommended inputs was twice a day if the user was on insulin therapy with HbA1c <7% and three times a day if the HbA1c was >7% [1213]. Prior to the beginning of the research, a target number of blood glucose measurements for patients who chose to volunteer for this research was set. We also consulted for the blood glucose measurement to be carried out through our medical staff if 50% of the measured blood glucoses were less than the target number. Direct consultation was conducted on the phone if patients did not input their glucose values or if their status needed physician intervention (e.g., consistently low or high blood glucose). Consultation of physicians was entirely left to the authority of the practicing physicians at the private clinic. After using this ITGM system for at least 1 month, a satisfaction survey was conducted. The answer was categorized into five levels: highly satisfied (score 5), mostly satisfied (score 4), average (score 3), mostly unsatisfied (score 2), and fully unsatisfied (score 1).
- Role of tertiary teaching hospitals
- Monitoring in a private clinic with no real operating experience is almost impossible. As such, a system that can support the monitoring of private clinics is needed. This role was filled by the tertiary teaching hospitals as health coordinating centers. In this study, the tertiary teaching hospitals served as centers for practical service guidelines, service protocols, and system training for doctors at private clinics. Medical staff of tertiary teaching hospitals personally visited the private clinics to educate them onsite and to provide operational instructions.
- Assessment of satisfaction
- Patients' satisfaction with the service was assessed using a questionnaire about the ITGM service, the modified Morisky scale (MMS), and the patient assessment of chronic illness care 1 to 2 months after the last use of the system.
- Satisfaction on IT-based glucose monitoring application service
- This questionnaire contained 22 questions in total (Table 1): seven questions about the intentions to use the service in the future, six questions regarding the equipment to be used for the service and the program satisfaction and convenience, two questions about difficulty in using the equipment or application, and seven questions on the efficacy/usability (in terms of healthcare and improving the relationship between doctors and patients) of the ITGM service.
- Modified Morisky scale
- The MMS assesses the motivation and knowledge of the patient regarding compliance with medication [1415], which is an important factor in the long-term management of a chronic disease. The scale consists of six questions on the motivation of the patient to comply with medication and his/her knowledge regarding compliance with medication. Evaluation would be done using yes or no responses. Scores from 0 to 1 are classified as lower scores in the MMS medication compliance standard and indicate a low motivation/knowledge level. Likewise, scores of 2 or 3 are classified as high and indicate a high motivation/knowledge level.
- Patient assessment of chronic illness care
- This scale is based on the chronic care model [16] and was used to assess whether the ITGM service is an efficient intervention in chronic-disease management. Its areas include patient activation, support in decisions making, goal setting, problem solving and consultation, traceability, and integration. It contains 20 questions scored from 1 to 5. The mean scores of each area were calculated, along with a grand total.
- Safeguards and privacy of the research targets
- This study is a questionnaire study and does not contain information that might pose a risk for participant safety. Furthermore, as additional tests or therapeutic interventions were not conducted, there was no risk or inconvenience due to participation in the research. Moreover, we did not collect sensitive or personally identifiable data from participants, and at the end of the research all the data were encrypted and saved in the server that passed the security guideline of the National Intelligence Service, with no possibility of the information being leaked. In addition, the encrypted data would not be used for purposes other than future research, and the data of excluded patients were deleted within 5 days. This study was jointly conducted with Seoul St. Mary's Hospital (tertiary teaching hospitals) in Korea. All patients provided their written informed consent to participate, and the study was approved by the National Bioethics Committee.
- Statistical analysis
- Descriptive results are presented as percent of the total for categorical variables and mean±standard deviation (SD) for continuous variables. To compare the number of inputs of the blood glucose data according to the baseline characteristics of the participants, we performed Student t-test or one-way analysis of variance and multivariate regression analysis (adjusting for clinic, sex, categorized age, categorized body mass index [BMI], systolic blood pressure [SBP], and glucose level as covariates). To compare participant satisfaction of the ITGM services according to age groups, we performed a general linear model (adjusting for clinic, sex, categorized age, categorized BMI, SBP, and glucose level as covariates). Finally, to compare participant satisfaction level of the ITGM services according to participant drug-compliance groups, we performed a chi-square test. A P<0.05 was considered statistically significant. The statistical software used was the SAS system release version 9.13 (SAS Institute Inc., Cary, NC, USA).
METHODS
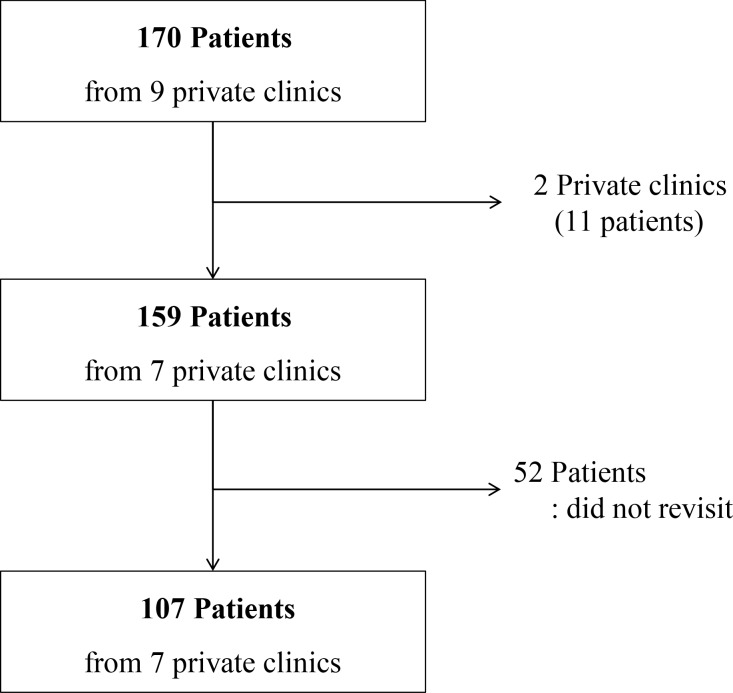
- One hundred and seventy patients from nine private local clinics used the blood glucose monitoring service (Fig. 2). Two private local clinics did not continue with the study due to the physicians' circumstances (both clinics together had 11 patients using the service). After at least 1 month of using the service, the survey was administered to the remaining 159 patients. Fifty-two of them did not respond because they did not revisit the clinic on time. The final sample size was 107 (survey response rate 67.3%, 107/159). The characteristics of the included subjects are shown in Table 2. There were more men than women (70 men [65.4%] and 37 women [34.6%]). The patients' average age was 56.4±9.9 years, and the average BMI was 25.6±3.2 kg/m2. Ninety-nine of the patients (92.5%) managed their blood glucose levels with only OHA. Patients who used lifestyle management or insulin to regulate blood glucose constituted 3.7% (4/107). The average duration from the start of using the application to finish the survey was 54±13 days.
RESULTS
- A comparison of the number of inputs of the blood glucose data according to the baseline characteristics of the participants revealed no significant difference according to age group (P=0.1070). However, as age increased, the number of inputs of blood glucose data tended to increase (Table 3). Patients above 60 years old gave on average 48±38 inputs, compared to 32±28 inputs from patients below 50 years old. There was no significant difference between patients who received SMS or telephone counseling and those who did not in terms of gender, age, or BMI.
Number of input of the blood glucose data
- General satisfaction score and intent for future usage
- This survey was composed of four questions on satisfaction and intent for future use regarding the ITGM service: overall satisfaction, information satisfaction, intent for future use, and intention of recommending the ITGM service to others.
- The overall satisfaction of the ITGM service was 4.2±0.8, indicating that many of the patients were more than “mostly satisfied.” Reasons for choosing “mostly unsatisfied” or “fully unsatisfied” included its uncomfortable interface (malfunctions in sending data) and repetitive usage, disruptive (periodical estimation and sending), technological problem with the device, acceleration of battery consumption, concerns regarding privacy, and preference for face-to-face visits with physicians. Information satisfaction through the ITGM service (4.3±0.8), intent for future use (4.2±0.8), and intention of recommendation to others (4.3±0.7) all scored above “mostly satisfied” (Table 4). Though there were no significant statistical differences, we found that the ITGM satisfaction level tended to increase with age (especially in the group with an age higher than 60). The tendency of scores to increase with age (especially in the group who are older than 60) was reported, although it was not statistically significant. The main reasons for intent for future usage were time/place flexibility and expectation of overall disease management and healthcare.
- Satisfaction score of equipment or program
- This questionnaire consisted of six questions regarding ITGM service equipment/program satisfaction and comfort. It also included items on the quality of communication with the physicians (understanding, accuracy), comfort of usage, accuracy of data transmission, speed and stability of the network, service sustainability of the glucometer, and service quality. The average score was 4.2±0.7; all factors were thus also above “mostly satisfied.” A nonsignificant positive association (P= 0.1059) between age and satisfaction was also observed.
- Questions on usability
- This section consisted of seven questions (check health conditions, patients' interest, intent of patients to comply with physicians' order, etc.) on the usability of the ITGM service. The mean score was 4.5±0.5, again indicating that patients were generally more than “mostly satisfied.” Similar to the results of previous surveys, satisfaction did not differ according to age, although users 60 years and older were generally more satisfied.
Satisfaction of IT-based glucose monitoring service
- As observed in the previous surveys, users older than 60 years were generally more satisfied, although the difference was not significant.
Patient assessment of chronic illness care
- Patients' drug compliance evaluation was divided into two sections: motivation (patients' intent to take the medication) and knowledge. The average MMS score on drug compliance was 4.7±1.3. Knowledge tended to decrease as a user's age increased (2.7±0.5 vs. 2.5±0.7 vs. 2.4±0.6, P=0.1141); motivation showed a similar trend (2.0±1.0 vs. 2.1±1.0 vs. 2.4±1.0, P=0.4682). However, neither association was significant (Table 5).
- We analyzed the frequencies of the higher- (score ≥2) and lower-scoring groups (score ≤1), which were divided by the prescribed cut-off. To clarify the impact of this classification to patients' drug compliance, we examined data from the two sections. Those who answered “highly satisfied” and “mostly satisfied” were sorted into the positive response group, and those who answered “mostly unsatisfied” and “fully unsatisfied” were placed into the negative response group. Those who answered “average” were placed in the neutral group. Those in the positive-response group formed the majority (83.2% to 90.1%). There were no significant differences among the positive, neutral, and negative response groups in average MMS score except for “information satisfaction” in the high motivation group. However, the positive response group tended to have a higher average MMS score compared with the neutral and negative response groups, especially in the highly motivated group (score ≥2), and the differences among the positive, neutral, and negative response groups on information satisfaction were significant (79.4% vs. 50.0%, P<0.05). That is, highly motivated patients tended to rate the service more positively (Table 6).
Drug compliance
- Because of the popularization of smartphones, the number of smartphone applications that can manage blood glucose level has been increasing. Consequently, physicians' remote feedback about patients' blood glucose status through smartphone applications is no longer unrealistic [456917]. As patients' lifestyle self-management is as important as hospital prescriptions, continuous self-monitoring, including that of blood glucose levels, is crucial. Thus, the physician's role in encouraging and motivating patients may be important for the successful management of DM. Yet, it is not enough for medical feedback to be transmitted unidirectionally to the patients; customized healthcare information should be provided for continuous self-care. A previous study reported that having more personal touches in feedback, including compliments and encouragement, were associated with decreasing blood glucose levels [18].
- Many previous studies on this topic focused on tertiary teaching hospitals, which indicated the possibility of using the IT technique to encourage patients' blood glucose measurement and its feedback to physicians in Korea [5192021]. The present research focused on private local clinics instead of tertiary teaching hospitals and showed similar results to those from studies on tertiary hospitals; the average satisfaction of the ITGM was 4.2±0.8, which was above “mostly satisfied.” The main reasons for the high satisfaction score included “ease of caring for health in daily life,” followed by “comfort of usage regardless of time or place,” and “sufficient medical feedback from the physicians.” Thus, these results mean that physician-patient communication through IT devices can help manage blood glucose and minimize patients' hospital visits, and that patients can manage their health status regardless of time or place. Since the time each patient receives in private local clinics in Korea is limited, having sufficient medical feedback from physicians without going to the clinic would be a great advantage. The major weakness of the service was “the annoyingness, discomfort, and inconvenience caused by ITGMS's way of usage.” The device satisfaction score was 4.2±0.7, and all factors were rated above “mostly satisfied”; however, 44.5% of the users faced problems with the device. One study reported that dissatisfaction with a system can be worse than not using it [5]; with respect to this study, users' dissatisfaction with the system could have led to poor control, which means decreased motive and compliance to manage blood glucose. Therefore, further changes are needed to solve these problems and improve the service.
- It was hypothesized that older patients, whose ability to learn new technology is lower, might have more trouble using the smartphone application than younger patients [19222324]. However, our results indicated the opposite. Although there was no significant difference between the age groups in participation rate in the present study, the participation rate was higher among older patients; consequently, physician-patient communication was more active for this age group. Overall satisfaction including the system, device, and usefulness was also higher among older patients (aged over 60) than in other groups (aged below 50). This indicates that older patients are more motivated to manage their health. There was no statistical difference, but satisfaction level for information tends to increase with age. It is perhaps due to their lack of other sources of information, especially compared with relatively young people. A large issue presently is how to efficiently transmit diverse information and medical feedback for the elderly [2526]. To accomplish this, the secondary features, including comfort, price reduction, amusement, and design, can be important to draw users' active participation [272829].
- However, the ITGM service is not prevalent in private local clinics. This might be because most private local clinics lack practical experience in using IT techniques to manage patients' health. Implementing the IT technique could increase physicians' load, as they would have to check patients' conditions and provide feedback out of the hospital. In addition, private local clinics would have to manage the application, device, database, and information security using limited resources. Thus, private local clinics are practically unable to use the system routinely, meaning that support from professional systems, such as health coordinating centers is crucial [412253031]. Health coordinating centers could provide private local clinics detailed service solutions and perform duties such as managing the system operation and teaching the instructions.
- Our study has some limitations. First, the present study did not use a comparative clinical method. The survey was mostly about satisfaction with the system, which could be answered only after using the ITGM. Second, the survey was intended to check patients' needs and demands before generalization; therefore, the practical impact was not verified. In addition, our study aimed to evaluate system satisfaction rather than clinical effect; its clinical efficacy was not clarified; hence, future analysis of clinical and economic impact is needed. Finally, physicians' satisfaction with the system was not investigated.
- Despite the limitations of the present study, it is nevertheless meaningful. This is the first ITGM service satisfaction study focusing on private local clinics. As this form of medical service is expected to grow, the results of this study could be used to refine remote patient care. Feasibility is confirmed in our study; another clinical practice study about the effectiveness of an ITGM service was processed with before, after, and control group laboratory findings added. This will be announced soon. We should try to build an effective system that can be used in reality.
DISCUSSION
-
Acknowledgements
- This work was supported by the ICT R&D Program of MSIP (R0236-15-1007, telemedicine activation model development and substantiation) and the Creative Vitamin Project.
ACKNOWLEDGMENTS
-
CONFLICTS OF INTEREST: No potential conflict of interest relevant to this article was reported.
NOTES
- 1. Yoon KH, Lee JH, Kim JW, Cho JH, Choi YH, Ko SH, Zimmet P, Son HY. Epidemic obesity and type 2 diabetes in Asia. Lancet 2006;368:1681-1688. ArticlePubMed
- 2. Chan JC, Malik V, Jia W, Kadowaki T, Yajnik CS, Yoon KH, Hu FB. Diabetes in Asia: epidemiology, risk factors, and pathophysiology. JAMA 2009;301:2129-2140. ArticlePubMed
- 3. Resnick HE, Foster GL, Bardsley J, Ratner RE. Achievement of American Diabetes Association clinical practice recommendations among U.S. adults with diabetes, 1999-2002: the National Health and Nutrition Examination Survey. Diabetes Care 2006;29:531-537. PubMed
- 4. Kim HS, Hwang Y, Lee JH, Oh HY, Kim YJ, Kwon HY, Kang H, Kim H, Park RW, Kim JH. Future prospects of health management systems using cellular phones. Telemed J E Health 2014;20:544-551. ArticlePubMedPMC
- 5. Kim HS, Choi W, Baek EK, Kim YA, Yang SJ, Choi IY, Yoon KH, Cho JH. Efficacy of the smartphone-based glucose management application stratified by user satisfaction. Diabetes Metab J 2014;38:204-210. ArticlePubMedPMC
- 6. Carroll AE, DiMeglio LA, Stein S, Marrero DG. Contracting and monitoring relationships for adolescents with type 1 diabetes: a pilot study. Diabetes Technol Ther 2011;13:543-549. ArticlePubMedPMC
- 7. Zolfaghari M, Mousavifar SA, Pedram S, Haghani H. The impact of nurse short message services and telephone follow-ups on diabetic adherence: which one is more effective? J Clin Nurs 2012;21:1922-1931. PubMed
- 8. Shetty AS, Chamukuttan S, Nanditha A, Raj RK, Ramachandran A. Reinforcement of adherence to prescription recommendations in Asian Indian diabetes patients using short message service (SMS): a pilot study. J Assoc Physicians India 2011;59:711-714. PubMed
- 9. Schiel R, Thomas A, Kaps A, Bieber G. An innovative telemedical support system to measure physical activity in children and adolescents with type 1 diabetes mellitus. Exp Clin Endocrinol Diabetes 2011;119:565-568. ArticlePubMed
- 10. Kim HS, Kim H, Lee S, Lee KH, Kim JH. Current clinical status of telehealth in Korea: categories, scientific basis, and obstacles. Healthc Inform Res 2015;21:244-250. ArticlePubMedPMC
- 11. Kim SI, Kim HS. Effectiveness of mobile and internet intervention in patients with obese type 2 diabetes. Int J Med Inform 2008;77:399-404. ArticlePubMed
- 12. Kim HS, Sun C, Yang SJ, Sun L, Li F, Choi IY, Cho JH, Wang G, Yoon KH. Randomized, open-label, parallel group study to evaluate the effect of internet-based glucose management system on subjects with diabetes in China. Telemed J E Health 2016;22:666-674. ArticlePubMed
- 13. Cho JH, Choi YH, Kim HS, Lee JH, Yoon KH. Effectiveness and safety of a glucose data-filtering system with automatic response software to reduce the physician workload in managing type 2 diabetes. J Telemed Telecare 2011;17:257-262. ArticlePubMedPDF
- 14. Case Management Society of America: Case Management Adherence Guidelines version 1.0. updated 2004 Jun 1. Available from: http://www.cmsa.org/portals/0/pdf/CMAG.pdf.
- 15. Kim SO. Medication adherence of elderly with hypertension and/or diabetes-mellitus and its' influencing factors. Korean J Clin Pharm 2011;21:81-89.
- 16. Bonomi AE, Wagner EH, Glasgow RE, VonKorff M. Assessment of chronic illness care (ACIC): a practical tool to measure quality improvement. Health Serv Res 2002;37:791-820. ArticlePubMedPMC
- 17. Istepanian RS, Zitouni K, Harry D, Moutosammy N, Sungoor A, Tang B, Earle KA. Evaluation of a mobile phone telemonitoring system for glycaemic control in patients with diabetes. J Telemed Telecare 2009;15:125-128. ArticlePubMedPDF
- 18. Cho JH, Chang SA, Kwon HS, Choi YH, Ko SH, Moon SD, Yoo SJ, Song KH, Son HS, Kim HS, Lee WC, Cha BY, Son HY, Yoon KH. Long-term effect of the Internet-based glucose monitoring system on HbA1c reduction and glucose stability: a 30-month follow-up study for diabetes management with a ubiquitous medical care system. Diabetes Care 2006;29:2625-2631. PubMed
- 19. Lim S, Kim SY, Kim JI, Kwon MK, Min SJ, Yoo SY, Kang SM, Kim HI, Jung HS, Park KS, Ryu JO, Shin H, Jang HC. A survey on ubiquitous healthcare service demand among diabetic patients. Diabetes Metab J 2011;35:50-57. ArticlePubMedPMC
- 20. Cho JH, Lee HC, Lim DJ, Kwon HS, Yoon KH. Mobile communication using a mobile phone with a glucometer for glucose control in type 2 patients with diabetes: as effective as an Internet-based glucose monitoring system. J Telemed Telecare 2009;15:77-82. ArticlePubMedPDF
- 21. Kwon HS, Cho JH, Kim HS, Lee JH, Song BR, Oh JA, Han JH, Kim HS, Cha BY, Lee KW, Son HY, Kang SK, Lee WC, Yoon KH. Development of web-based diabetic patient management system using short message service (SMS). Diabetes Res Clin Pract 2004;66(Suppl 1):S133-S137. ArticlePubMed
- 22. Salthouse TA. The aging of working memory. Neuropsychology 1994;8:535-543.Article
- 23. Dal Bello-Haas VP, O'Connell ME, Morgan DG, Crossley M. Lessons learned: feasibility and acceptability of a telehealth-delivered exercise intervention for rural-dwelling individuals with dementia and their caregivers. Rural Remote Health 2014;14:2715PubMed
- 24. Docampo Rama M, de Ridder H, Bouma H. Technology generation and age in using layered user interfaces. Gerontechnology 2001;1:25-40.
- 25. Kim HS, Lee KH, Kim H, Kim JH. Using mobile phones in healthcare management for the elderly. Maturitas 2014;79:381-388. ArticlePubMed
- 26. Kim KS, Kim SK, Sung KM, Cho YW, Park SW. Management of type 2 diabetes mellitus in older adults. Diabetes Metab J 2012;36:336-344. ArticlePubMedPMC
- 27. Park G, Lee JH, Kim KS. Study on effective improvement of mobile phone sound quality in a noise environment for the hearing-impaired. Korean J Audiol 2013;17:78-82. ArticlePubMedPMC
- 28. Czaja SJ, Charness N, Fisk AD, Hertzog C, Nair SN, Rogers WA, Sharit J. Factors predicting the use of technology: findings from the Center for Research and Education on Aging and Technology Enhancement (CREATE). Psychol Aging 2006;21:333-352. ArticlePubMedPMC
- 29. Pattison M, Stedmon A. Inclusive design and human factors: designing mobile phones for older users. Psychnol J 2006;4:267-284.
- 30. Kim HS, Cho JH, Yoon KH. New directions in chronic disease management. Endocrinol Metab (Seoul) 2015;30:159-166. ArticlePubMedPMC
- 31. Kim HS, Shin JA, Chang JS, Cho JH, Son HY, Yoon KH. Continuous glucose monitoring: current clinical use. Diabetes Metab Res Rev 2012;28(Suppl 2):73-78. ArticlePubMed
REFERENCES
Service process of information technology-based glucose monitoring service. CDSS, clinical decision support system.


Survey of satisfaction with ITGM application service
Baseline characteristics of survey participants (n=107)
Number of input data of blood glucose from patients and messages from physicians
Satisfaction score according to age group
Characteristics of respondents by MMS score
Results of respondents by MMS score
Figure & Data
References
Citations
- Exploring Quantitative Methodologies for Assessing the Environmental, Social, and Economic Impacts of Telemedicine: A Literature Review
Anna Savoldelli, Daniele Landi, Caterina Rizzi
Sustainability.2024; 16(6): 2438. CrossRef - Telemedicine for Diabetes Mellitus Management in Older Adults: A Systematic
Review
Luca Schiliró Tristão, Guilherme Tavares, Francisco Tustumi, Wanderley Marques Bernardo, Márcio Luis Duarte, Maria Stella Peccin, Lucas Ribeiro dos Santos
Current Diabetes Reviews.2023;[Epub] CrossRef - The effectiveness of mobile application for monitoring diabetes mellitus and hypertension in the adult and elderly population: systematic review and meta-analysis
Emily de Souza Ferreira, Fernanda de Aguiar Franco, Marina Marilac dos Santos Lara, André Amaral Levcovitz, Mateus Araújo Dias, Tiago Ricardo Moreira, Ary Henrique Morais de Oliveira, Rosângela Minardi Mitre Cotta
BMC Health Services Research.2023;[Epub] CrossRef - Effects of the Physician–Primary-Healthcare Nurse Telemedicine Model (P-NTM) on Medication Adherence and Health-Related Quality of Life (HRQoL) of Patients with Chronic Disease at Remote Rural Areas
Mi Young Kwak, Eun Jeong Hwang, Tae Ho Lee
International Journal of Environmental Research and Public Health.2021; 18(5): 2502. CrossRef - Lessons from Use of Continuous Glucose Monitoring Systems in Digital Healthcare
Hun-Sung Kim, Kun-Ho Yoon
Endocrinology and Metabolism.2020; 35(3): 541. CrossRef - Apprehensions about Excessive Belief in Digital Therapeutics: Points of Concern Excluding Merits
Hun-Sung Kim
Journal of Korean Medical Science.2020;[Epub] CrossRef - Peripartum Management of Gestational Diabetes Using a Digital Health Care Service: A Pilot, Randomized Controlled Study
Ji-Hee Sung, Da Young Lee, Kyoung Pil Min, Cheol-Young Park
Clinical Therapeutics.2019; 41(11): 2426. CrossRef - Mobile Phone–Based Telemedicine Practice in Older Chinese Patients with Type 2 Diabetes Mellitus: Randomized Controlled Trial
Chenglin Sun, Lin Sun, Shugang Xi, Hong Zhang, Huan Wang, Yakun Feng, Yufeng Deng, Haimin Wang, Xianchao Xiao, Gang Wang, Yuan Gao, Guixia Wang
JMIR mHealth and uHealth.2019; 7(1): e10664. CrossRef
 PubReader
 Cite
Cite