Novel Asian-Specific Visceral Adiposity Indices Are Associated with Chronic Kidney Disease in Korean Adults
Article information
Abstract
Background
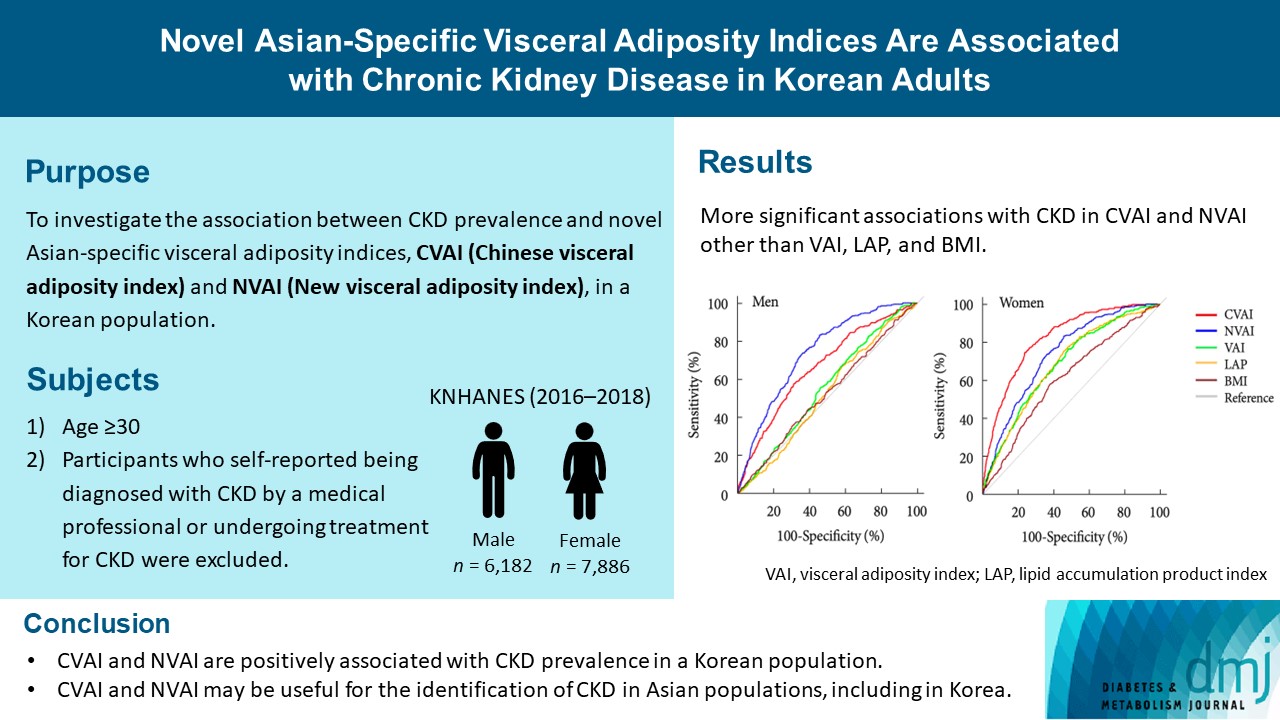
The Chinese visceral adiposity index (CVAI) and new visceral adiposity index (NVAI) are novel indices of visceral adiposity used to predict metabolic and cardiovascular diseases in Asian populations. However, the relationships of CVAI and NVAI with chronic kidney disease (CKD) have not been investigated. We aimed to characterize the relationships of CVAI and NVAI with the prevalence of CKD in Korean adults.
Methods
A total of 14,068 participants in the 7th Korea National Health and Nutrition Examination Survey (6,182 men and 7,886 women) were included. Receiver operating characteristic (ROC) analyses were employed to compare the associations between indices of adiposity and CKD, and a logistic regression model was used to characterize the relationships of CVAI and NVAI with CKD prevalence.
Results
The areas under the ROC curves for CVAI and NVAI were significantly larger than for the other indices, including the visceral adiposity index and lipid accumulation product, in both men and women (all P<0.001). In addition, high CVAI or NVAI was significantly associated with a high CKD prevalence in both men (odds ratio [OR], 2.14; 95% confidence interval [CI], 1.31 to 3.48 in CVAI and OR, 6.47; 95% CI, 2.91 to 14.38 in NVAI, P<0.05) and women (OR, 4.87; 95% CI, 1.85 to 12.79 in CVAI and OR, 3.03; 95% CI, 1.35 to 6.82 in NVAI, P<0.05); this association remained significant after adjustment for multiple confounding factors in men and women.
Conclusion
CVAI and NVAI are positively associated with CKD prevalence in a Korean population. CVAI and NVAI may be useful for the identification of CKD in Asian populations, including in Korea.
INTRODUCTION
Chronic kidney disease (CKD) has major impacts on patients and society by increasing the risks of cardiovascular disease (CVD), hospitalization, and all-cause mortality [1–3]. Early recognition and intervention are required for the effective management of CKD, and the control of well-established risk factors, including diabetes, hypertension, dyslipidemia, smoking, and alcohol use, is essential [1]. In addition, recently, there has been an alarming rise in the prevalence of obesity that has paralleled the increase in the prevalence of CKD [4]. Obesity has emerged as an independent risk factor for CKD, and modest weight loss has been proven to be an effective means of reducing renal damage [5–7]. Therefore, several anthropometric indices that reflect the level of obesity have been developed for the prediction of metabolic syndrome and CVD, as well as CKD [8–10].
Body mass index (BMI) has been the most widely used means of evaluating obesity in clinical practice, and epidemiologic studies have shown an association between high BMI and the incidence of CKD [11,12]. However, because BMI is affected by sex, age, ethnicity, and muscle mass, it does not always reflect excess body fat [13]. Indeed, previous studies have demonstrated that BMI is a relatively poor predictor of CKD [10,14,15]. Recently, visceral adipose tissue (VAT) and its dysfunction have emerged as risk factors for metabolic syndrome, CVD, and CKD [16]. For this reason, the visceral adiposity index (VAI) and lipid accumulation product (LAP), which are calculated using waist circumference (WC), BMI, serum triglyceride (TG), and serum high-density lipoprotein cholesterol (HDL-C), have been developed and shown to be more representative of VAT mass and to show closer associations with metabolic syndrome, CVD, and CKD than BMI, WC, or waist-to-height ratio (WHtR) [9,11,15].
VAI and LAP were developed and validated using data principally from white populations; therefore, they do not reflect the differences between white and Asian individuals, who can accumulate more visceral fat while having a relatively low BMI [17]. Because of this, the Chinese visceral adiposity index (CVAI) and new visceral adiposity index (NVAI) were developed using data from Chinese and Korean individuals, respectively [8,10]. Previous studies using computed tomography (CT) have shown that age is associated with the accumulation of visceral fat area (VFA) [18,19]. Nonetheless, age is not included in VAI or LAP. CVAI is composed of age, anthropometric (BMI and WC), and biochemical parameters (TG and HDL-C), which are significantly associated with visceral dysfunction and VFA measured by CT in Chinese individuals [18,20]. CVAI shows better association with metabolic diseases, CVD, and diabetic complications than VAI in Chinese people [18,19]. NVAI combines age, WC, TG, HDL-C, and additionally the mean blood pressure (MBP), which are also significantly associated with VFA measured by CT in Korean individuals [21]. NVAI is more significantly associated with CVD in Korean people than other obesity indices [8,21]. However, the relationships of CVAI and NVAI with CKD have yet to be fully characterized.
Therefore, in the present study, we aimed to characterize the relationships of several indices of abdominal obesity, including CVAI and NVAI, with the prevalence of CKD, using data from the Korea National Health and Nutrition Examination Survey (KNHANES), a nationwide cross-sectional cohort that represents a nationally representative sample of the Korean population.
METHODS
Study participants
We used data from KNHANES VII, which was conducted during 2016 to 2018 by the Korea Centers for Disease Control and Prevention (KCDCP). The KNHANES is a cross-sectional survey that includes physical examinations, clinical and laboratory tests, and health and nutrition interviews [22]. In the survey, 23 households in every 192 primary sample units comprised the final sample, and a total of 24,269 persons were sampled (8,150, 8,127, and 7,992 in 2016, 2017, and 2018, respectively). We excluded 7,233 participants below 30 years-of-age and 2,862 participants who did not undergo laboratory tests or answer survey questions. Furthermore, we excluded participants with advanced CKD, defined as an estimated glomerular filtration rate (eGFR) below 30 mL/min/1.73 m2, and those with pre-existing CKD, defined as self-reportedly diagnosed with CKD by a medical professional or on treatment at the time of the survey (106 participants). Finally, a total 14,068 subjects were included in the analysis (Supplementary Fig. 1).
The Institutional Review Board (IRB) of the KCDCP approved the third cycle of the KNHANES VII (2018-01-03-P-A), and the first and second cycles of the KNHANES VII were exempted from the necessity for approval by this IRB. The study participants provided their written informed consent before participating in the survey, and all the procedures were conducted according to the principles of the Declaration of Helsinki.
Demographic and clinical characteristics
The demographic and clinical characteristics of the participants were obtained from health questionnaires [22]. The participants were categorized as current or ex-/never smokers, and as alcohol drinkers (who drank alcohol ≥1 a month) or non-drinkers. They were also categorized as those who performed high- or moderate-intensity physical activity ≥3 times a week or those who performed such activity <3 times a week. They were also placed into a lower level of education group (if they had less than a middle-school diploma) or a higher level group, and into a low-income group (if they had an income in the lowest 25% of the income distribution) or a high-income group. Diabetes was defined using a self-reported diagnosis of diabetes by a physician, the administration of oral anti-hyperglycemia medication or insulin, a fasting glucose concentration of ≥126 mg/dL, or a glycosylated hemoglobin (HbA1c) of ≥6.5%. Dyslipidemia was defined using the administration of anti-hypercholesterolemia medication, a fasting total cholesterol ≥240 mg/dL, or a fasting TG ≥200 mg/dL. Hypertension was defined using the administration of anti-hypertensive medication, a systolic blood pressure (SBP) ≥140 mm Hg, or a diastolic blood pressure (DBP) ≥90 mm Hg. MBP was calculated as DBP+1/3 (SBP−DBP). Anemia was defined using hemoglobin concentrations <13 and <12 mg/dL for men and women, respectively. The presence of CVD was recorded if the participant reported a history of myocardial infarction, angina, or stroke.
Anthropometric and laboratory data
The height, body mass, WC, and other anthropometric measurements were performed by trained medical staff and interviewers [22]. SBP and DBP were measured three times at 30 seconds intervals in each participant, and the mean of the second and third values was used for the analyses [22]. BMI was calculated as body mass in kilograms divided by height in meters, squared.
Blood samples obtained from the participants after fasting were transported to a central laboratory and analyzed within 24 hours [22]. Fasting serum glucose (hexokinase ultraviolet method), total cholesterol (enzymatic method), TG (enzymatic method), HDL-C (homogeneous enzymatic colorimetric method), blood urea nitrogen (urease/glutamate dehydrogenase method), and creatinine (SCr, Jaffe’s kinetic method) concentrations, and alkaline phosphatase (ALT) and aspartate aminotransferase (AST, International Federation of Clinical Chemistry and Laboratory Medicine ultraviolet method) activities, were measured using a Hitachi Automatic Analyzer 7600-210 (Hitachi, Tokyo, Japan). HbA1c (high-performance liquid chromatography method) was measured using a Tosoh G8 (Tosoh, Tokyo, Japan). Hemoglobin (sodium lauryl sulfate hemoglobin detection method) and hematocrit (red blood cell cumulative pulse height detection method) were measured using an XN-9000 (Sysmex Corporation, Kobe, Japan). Serum high-sensitivity C-reactive protein (hs-CRP, immunoturbidimetry method) concentration was measured using a Cobas system (Roche, Penzberg, Germany). Low-density lipoprotein cholesterol concentration was calculated as total cholesterol–HDL–(TG/5). Because the distributions of TG, AST, and ALT were skewed, these data were log-transformed prior to analyses.
Definition of CVAI, NVAI, VAI, and LAP
CVAI was calculated for men as:
and for women as:
NVAI was calculated for men as:
and for women as:
VAI was calculated for men as:
and for women as:
LAP was calculated for men as (WC−65)×TG and for women as (WC−58)×TG [15]
Definition of CKD
We calculated eGFR using the Chronic Kidney Disease Epidemiology Collaboration (CKD-EPI) equation. For men: 141×min (SCr/0.9, 1)−0.411×max (SCr/0.9, 1)−1.209×0.993Age and for women: 141×min (SCr/0.7, 1)−0.329×max (SCr/0.7, 1)− 1.209×0.993Age× 1.018. We defined CKD using an eGFR of <60 mL/min/1.73 m2.
Statistical analysis
Because participants in the KNHANES were sampled using a stratified, multistage probability cluster sampling design to represent the whole Korean population [22,23], complex sample analysis was necessary for the present data. Data for men and women were separately analyzed because of sex differences in the formulae for the visceral adiposity indices. Their clinical characteristics are presented as unweighted frequencies with weighted percentages for the categorical data and means with standard errors for the continuous data. The clinical characteristics of individuals with or without CKD were compared using the Rao-Scott chi-square test for categorical data and the complex sample independent t-test for continuous data. Pearson’s correlation coefficient was used to evaluate the relationships of eGFR with age, BMI, LAP, VAI, CVAI, and NVAI.
To validate the association models for CKD, receiver operating characteristic (ROC) curve analysis was used, and the area under the ROC curves (AUCs) were compared using Delong’s method. The optimal cut-off values for each VAI were calculated using the Youden index. Men and women were also categorized according to tertile of VAI (men: T1 <1.20, 1.20≤ T2 <2.22, and T3 ≥2.22; women: T1 <1.13, 1.13≤ T2 <2.11, and T3 ≥2.11), CVAI (men: T1 <99.49, 99.49≤ T2 <125.88, and T3 ≥125.88; women: T1 <61.41, 61.41≤ T2 <105.74, and T3 ≥105.74), and NVAI (men: T1 <0.43, 0.43≤ T2 <0.87, and T3 ≥0.87; women: T1 <0.04, 0.04≤ T2 <0.36, and T3 ≥0.36). Multivariate logistic regression analysis was then used to characterize the relationships of CKD with tertiles of VAI, CVAI, and NVAI. Statistical analysis was conducted using SPSS version 26 (IBM Corp., Armonk, NY, USA) and R version 4.1.2. (R Foundation for Statistical Computing, Vienna, Austria). Statistical significance was set at P<0.05.
RESULTS
Clinical characteristics of the participants
The clinical characteristics of the participants are shown in Table 1. Of the male and female participants, 272 (2.8%) and 250 (2.7%) had CKD, respectively. Those with CKD were older than those without. As expected, those with CKD had higher SBP and higher glucose, HbA1c, and hs-CRP concentrations than those without (all P<0.001). The proportions of the participants with a low education level, diabetes, hypertension, dyslipidemia, anemia, and CVD were significantly higher among those with CKD than among those without (all P<0.001), current smokers in men, alcohol drinkers, and those who undertook regular physical activity were lower in the CKD group (all P<0.001). Notably, the mean CVAI and NVAI values were higher in the CKD group than in the no CKD group (all P<0.001). There were higher VAI and LAP values in female participants with CKD (all P<0.001), but not in men (VAI, P=0.548; LAP, P=0.139).
Relationships of eGFR with age, BMI, LAP, VAI, CVAI, and NVAI
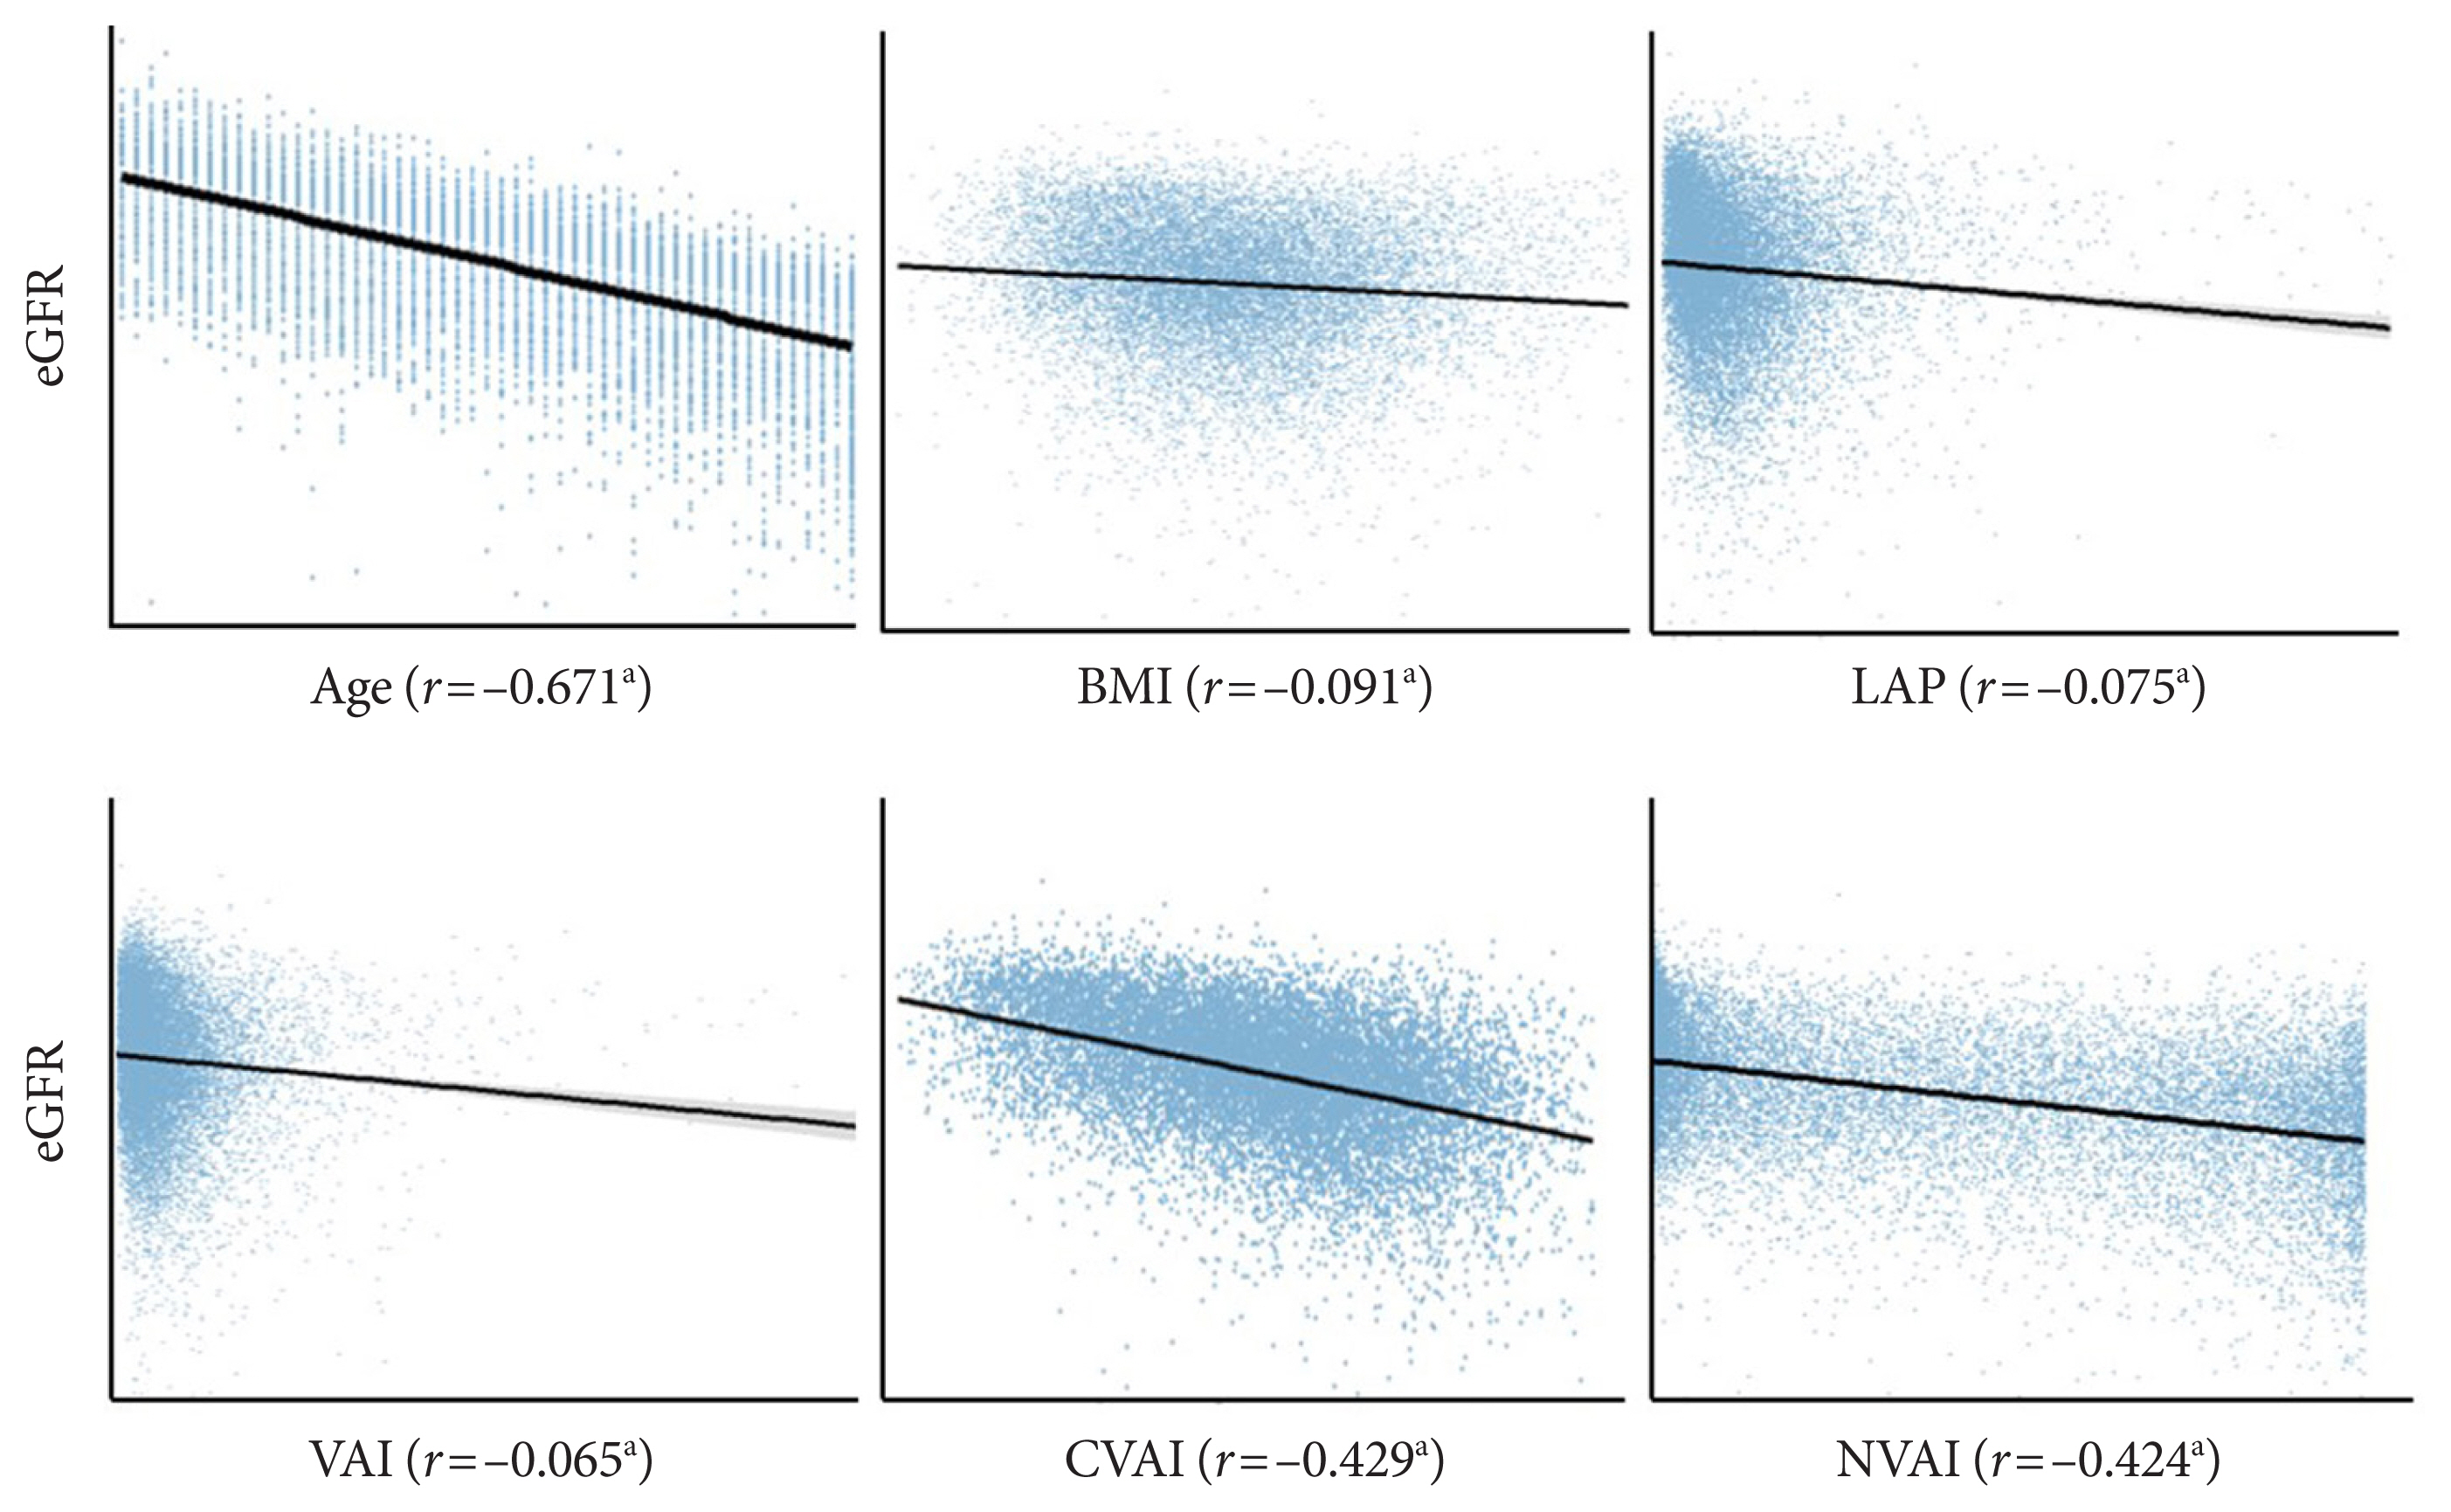
The relationships of eGFR with age, BMI, LAP, VAI, CVAI, and NVAI are presented in Fig. 1. Consistent with the findings of previous studies [9,14], eGFR decreased steadily with age (r= −0.671, P<0.01). eGFR showed weak but significant negative correlations with BMI (r=−0.091, P<0.01), LAP (r=−0.075, P<0.01), and VAI (r=−0.065, P<0.01), but stronger negative correlations with CVAI (r=−0.429, P<0.01) and NVAI (r= −0.424, P<0.01). To investigate a possible effect of estrogen, we analyzed the impact of menopausal status and cause of menopause, natural or artificial, on the relationships of eGFR with CVAI, NVAI, and VAI (Supplementary Fig. 2). Regardless of the cause of menopause in postmenopausal women, CVAI and NVAI showed significant negative correlations with eGFR (all P<0.01), whereas the correlation was not significant in premenopausal women. VAI revealed a weak but significant correlation only in naturally menopausal women (P<0.01). These results suggested that eGFR is negatively associated with CVAI and NVAI; however, this association could be weakened by estrogen.
ROC curve analysis for obesity indices as discriminators of CKD
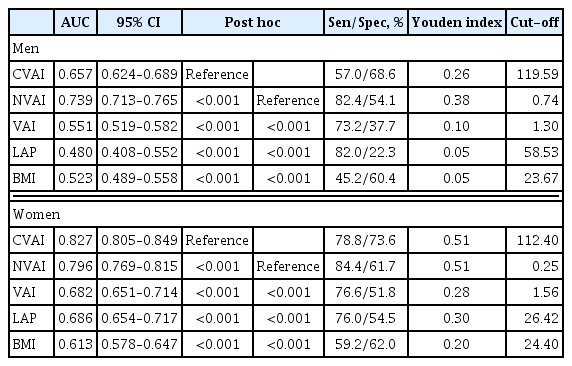
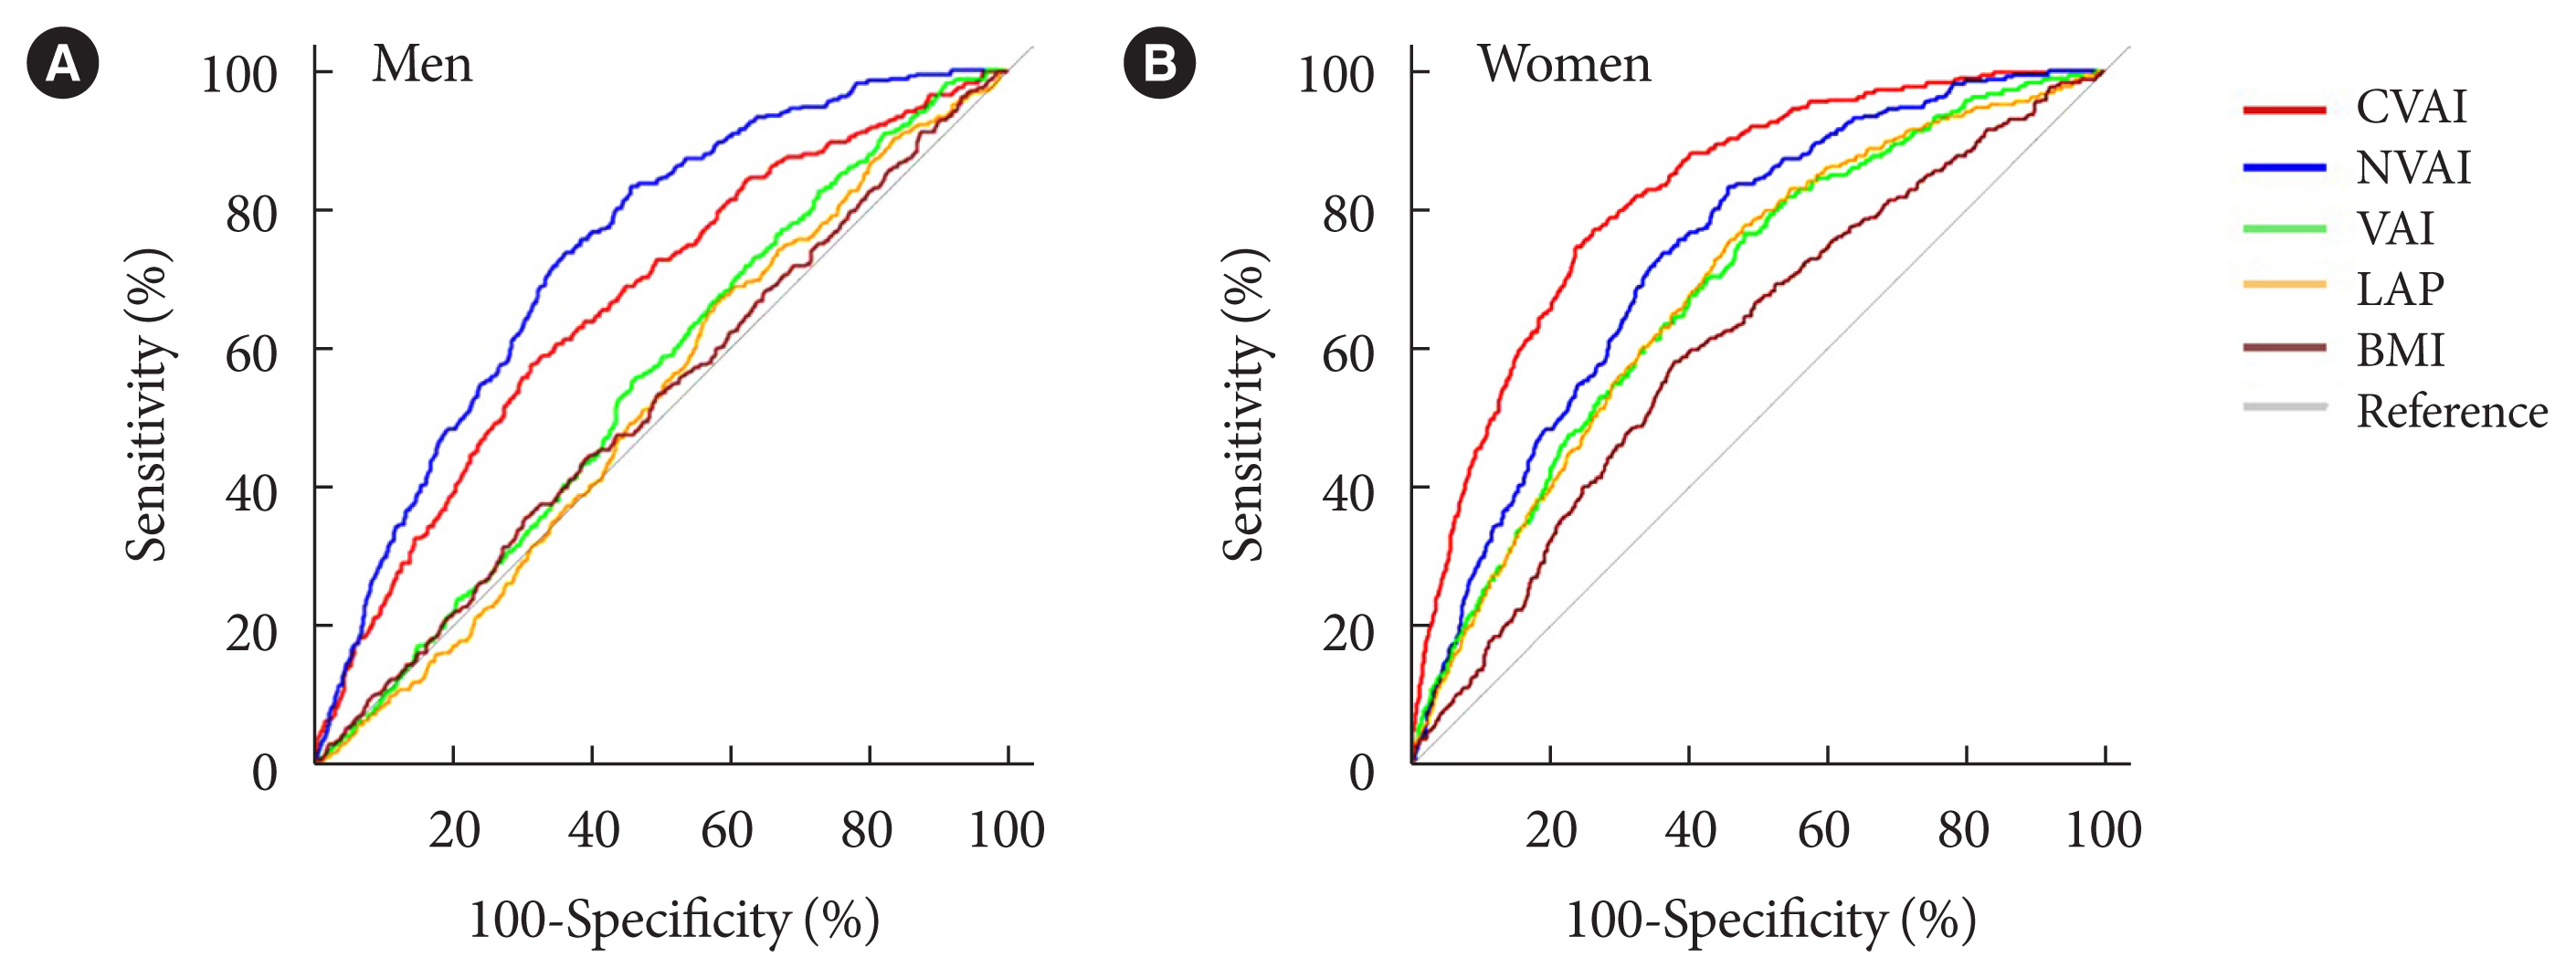
The associations of VAI, LAP, BMI, CVAI, and NVAI with CKD were compared using ROC analysis and the optimal cut-off value for each index was calculated for men and women. In men, the AUCs for the associations of VAI, LAP, and BMI with CKD were 0.551 (95% confidence interval [CI], 0.519 to 0.582), 0.480 (95% CI, 0.408 to 0.552), and 0.523 (95% CI, 0.489 to 0.558), respectively. However, CVAI (AUC, 0.657; 95% CI, 0.624 to 0.689), and NVAI (AUC, 0.739; 95% CI, 0.713 to 0.765) were more significantly associated with CKD than the other indices (Table 2, Fig. 2). The same trends were observed in women. The AUCs for the associations of VAI, LAP, and BMI with CKD were 0.682 (95% CI, 0.651 to 0.714), 0.686 (95% CI, 0.654 to 0.717), and 0.613 (95% CI, 0.578 to 0.647), respectively. However, the AUCs of CVAI (AUC, 0.827; 95% CI, 0.805 to 0.849) and NVAI (AUC, 0.796; 95% CI, 0.769 to 0.815) for their association with CKD were significantly higher (Table 2, Fig. 2). Thus, the AUCs for CVAI and NVAI were higher than those for VAI, LAP, and BMI in both men and women. The optimal CVAI cut-off values were calculated to be 119.59 (sensitivity 57.0% and specificity 68.6%) for men and 112.40 (sensitivity 78.8% and specificity 73.6%) for women; and those for NVAI were calculated to be 0.74 (sensitivity 82.4% and specificity 54.1%) for men and 0.25 (sensitivity 84.4% and specificity 61.7%) for women (Table 2).

The AUC, sensitivity, specificity, Youden index, and cut-off values for the associations between visceral adiposity indices and chronic kidney disease

Receiver operating characteristic curves in men (A) and women (B) for the associations Chinese visceral adiposity index (CVAI), and new visceral adiposity index (NVAI), visceral adiposity index (VAI), lipid accumulation product (LAP), and body mass index (BMI) with chronic kidney disease (CKD). CKD was defined using an estimated glomerular filtration rate of <60 mL/min/1.73 m2.
Relationships of the prevalence of CKD with tertiles of CVAI, NVAI, and VAI
Next, we assessed the relationships of the prevalence of CKD with the tertiles of each of CVAI, NVAI, and VAI (Table 3). There were significant relationships of the tertile of CVAI with the prevalence of CKD in men (model 1: odds ratio [OR], 4.027; 95% CI, 2.622 to 6.185) and women (OR, 31.147; 95% CI, 13.085 to 74.141), and these remained significant after adjustment for the presence of diabetes and hypertension (model 2: OR, 1.790; 95% CI, 1.128 to 2.840 in men; OR, 11.747; 95% CI, 4.765 to 28.960 in women). In addition, when we further adjusted for other variables (model 2 variables plus alcohol status, smoking status, educational status, anemia status, history of CVD, physical activity status, hs-CRP, glucose concentration, and SBP; model 3), the tertile of CVAI remained significantly associated with the prevalence of CKD in men (OR, 2.139; 95% CI, 1.314 to 3.483), and women (OR, 4.870; 95% CI, 1.854 to 12.790). The same trend was identified for NVAI. The significant associations between high NVAI and the prevalence of CKD in men (OR, 15.795; 95% CI, 8.265 to 30.188 for model 1) and women (OR, 19.584; 95% CI, 9.961 to 38.501 for model 1) also remained significant after adjustment for potential confounders in men (OR, 6.393; 95% CI, 2.983 to 13.705 for model 2; OR, 6.473; 95% CI, 2.913 to 14.383 for model 3) and women (OR, 6.468; 95% CI, 3.073 to 13.614 for model 2; OR, 3.030; 95% CI, 1.346 to 6.820 for model 3).
By contrast, we found that a high VAI was associated with a high prevalence of CKD in women (OR, 2.565; 95% CI, 1.593 to 4.130 for model 2; OR, 1.774; 95% CI, 1.081 to 2.913 for model 3), but not in men (OR, 0.808; 95% CI, 0.547 to 1.195 for model 2; OR, 1.242; 95% CI, 0.802 to 1.924 for model 3). Collectively, these data suggest that CVAI and NVAI are more closely associated with the prevalence of CKD than VAI in both men and women.
DISCUSSION
The present study of data from KNHANES VII showed that the Asian-specific visceral adipose indices CVAI and NVAI are closely associated with the prevalence of CKD in the Korean population compared with other indices of visceral adiposity.
Previous large population-based studies have shown that obesity is closely associated with the development and progression of CKD [24]. Adiponectin, leptin, and resistin are thought to play essential roles in kidney damage, and therefore VAT mass is thought to be related to the pathogenesis of CKD [25–28]. In addition, pro-inflammatory cytokines, such as tumor necrosis factor-α and interleukin-6, oxidative stress, and the dysregulation of the renin-angiotensin-aldosterone-system, also contribute to the development of CKD in individuals with obesity [24,29,30]. Dual-energy X-ray absorptiometry, CT, and magnetic resonance imaging are reliable methods of estimating VAT mass [31]. However, these modalities are expensive and impractical for use in standard clinical practice, and the exposure to ionizing radiation during CT limits the frequency of its use [31]. Therefore, a number of convenient indices of visceral adiposity have been developed that use anthropometric data, such as WHtR, LAP, and VAI, and these were shown to be accurate means of assessing visceral obesity by comparison with CT [32]. However, these indices were developed using data obtained from white populations. Therefore, novel visceral adipose indices have been developed for Asian people: the CVAI and NVAI [10,21]. Given that age, which is associated with a substantial risk of CKD, is included in the CVAI and NVAI formulae, these represent more effective means of predicting age-related diseases, such as diabetes and atherosclerotic disease [8,10]. Indeed, CVAI outperformed other visceral adipose indices for the prediction of type 2 diabetes mellitus in Chinese adults and coronary artery calcification (CAC) in Korean adults [10,33]. In addition, NVAI was superior to VAI for the prediction of CAC in Koreans [8]. In the present study, we have shown that CVAI and NVAI were more significantly associated with CKD than VAI, LAP, or BMI by comparing the AUCs. Furthermore, in the cohort as a whole, we found stronger associations of CKD prevalence with CVAI and NVAI values than with VAI, even after adjustment for potential confounding factors.
Previous studies have shown that gender influences the AUCs for the association between visceral adiposity and CKD [15,19,34]. Specifically, a cross-sectional study conducted in Chinese people of >35 years old showed that the AUCs for indices including WC, WHtR, and the visceral fat index were larger in women than in men [35]. The mechanisms underpinning this difference may be a protective effect of estrogen against metabolic disease, including CKD, and its effect on fat deposition. An estrogen-related lower level of visceral adiposity in women may contribute to discrepancies in the associations between adiposity indices and CKD in men and women [19,35,36]. Indeed, we did not observe that eGFR was significantly associated with CVAI, NVAI, or VAI in the premenopausal group. Considering the suggested roles of estrogen in mediating gender differences in visceral adiposity and CKD, estrogen may attenuate the association between eGFR and visceral adiposity indices. However, further study will be needed to evaluate fully the effects of estrogen on the associations of CVAI and NVAI with CKD.
Previous studies showed that AUCs of CVAI for diabetes mellitus, coronary artery calcium score (CACS), or CVD are higher in women than in men [19,33]. Lee et al. [33] showed that the AUC values of CVAI for CACS in the Korean population are significantly higher in women than in men (0.592 in men vs. 0.771 in women). Son et al. [8] also showed that those for CACS >100 in other Korean cohorts are higher in women than in men (0.524 in men vs. 0.653 in women). By contrast, the gender differences of AUCs of NVAI for those were lesser (0.677 in men vs. 0.785 in women) [8]. In line with these findings, we found that the AUC of CVAI for CKD was higher in women than in men (0.827 vs. 0.657), whereas the AUC of NVAI for CKD was similar in women and men (0.796 vs. 0.739). We are unable to explain whether adding MBP and removing BMI as parameters for estimating NVAI reduced the effect of gender difference on eGFR in this retrospective study. Further study will be required to investigate this issue.
The present study had several limitations. First, it was a cross-sectional study of data from KNHANES VII, and therefore it is not possible to draw conclusions regarding causal relationships between the adipose tissue indices and the prevalence of CKD. Second, because the urinary albumin concentration was not measured during KNHANES VII, we defined CKD using an eGFR of ≤60 mL/min/1.73 m2, calculated using the CKD-EPI method; therefore, the prevalence of CKD may have been underestimated. Third, considering the significantly higher TGs levels in CKD stage 4 and 5 [37,38], we excluded pre-existing or advanced CKD subjects to reduce the possibility of reverse causality. Nevertheless, we cannot completely exclude the possibility of reverse causality.
Despite these limitations, we believe that the findings of the study are meaningful. In this survey of samples that are representative of the Korean population, we have demonstrated that the Asian-specific adipose tissue indices CVAI and NVAI are positively associated with CKD prevalence in Koreans. This implies that CVAI and NVAI may represent a useful means of identifying CKD in Asian populations, including in Korea.
SUPPLEMENTARY MATERIALS
Supplementary materials related to this article can be found online at https://doi.org/10.4093/dmj.2022.0099.
Supplementary Fig. 1.
Flowchart for the inclusion and exclusion of participants in the Korea National Health and Nutrition Examination Survey (KNHANES) VII. CKD, chronic kidney disease.
Supplementary Fig. 2.
Scatter plots of Pearson’s correlations in premenopausal (A) and postmenopausal (B) women of estimated glomerular filtration rate (eGFR) with Chinese visceral adiposity index (CVAI), new visceral adiposity index (NVAI), and visceral adiposity index (VAI). aP<0.01.
ACKNOWLEDGMENTS
None
Notes
CONFLICTS OF INTEREST
No potential conflict of interest relevant to this article was reported.
AUTHOR CONTRIBUTIONS
Conception or design: J.J., H.W.
Acquisition, analysis, or interpretation of data: J.J., H.W., Y.J., W.K.L.
Drafting the work or revising: J.J., H.W., J.G.K., I.K.L., K.G.P., Y.K.C.
Final approval of the manuscript: K.G.P., Y.K.C.
FUNDING
This work was supported by the National Research Foundation of Korea (NRF); grants NRF-2022R1A2C1008591 funded by the Ministry of Science and ICT; and grants HI16C1501 funded by the Ministry of Health and Welfare.


