
- Current
- Browse
- Collections
-
For contributors
- For Authors
- Instructions to authors
- Article processing charge
- e-submission
- For Reviewers
- Instructions for reviewers
- How to become a reviewer
- Best reviewers
- For Readers
- Readership
- Subscription
- Permission guidelines
- About
- Editorial policy
Articles
- Page Path
- HOME > Diabetes Metab J > Volume 34(6); 2010 > Article
-
Original ArticleThe Small Rice Bowl-Based Meal Plan was Effective at Reducing Dietary Energy Intake, Body Weight, and Blood Glucose Levels in Korean Women with Type 2 Diabetes Mellitus
- Hee Jung Ahn1, Kyung Ah Han2, Hwi Ryun Kwon1, Kyung Wan Min1,2
-
Korean Diabetes Journal 2010;34(6):340-349.
DOI: https://doi.org/10.4093/kdj.2010.34.6.340
Published online: December 31, 2010
- 3,266 Views
- 34 Download
- 5 Crossref
1Diabetes Center, Eulji Hospital, Seoul, Korea.
2Department of Internal Medicine, Eulji University School of Medicine, Daejeon, Korea.
- Corresponding author: Kyung Wan Min. Diabetes Center, Eulji Hospital, 280-1 Hagye 1-dong, Nowon-gu, Seoul 139-872, Korea. minyungwa@yahoo.co.kr
- *Hee Jung Ahn and Kyung Ah Han jointly contribute to this paper as first authors.
• Received: July 11, 2010 • Accepted: September 6, 2010
Copyright © 2010 Korean Diabetes Association
This is an Open Access article distributed under the terms of the Creative Commons Attribution Non-Commercial License (http://creativecommons.org/licenses/by-nc/3.0/) which permits unrestricted non-commercial use, distribution, and reproduction in any medium, provided the original work is properly cited.
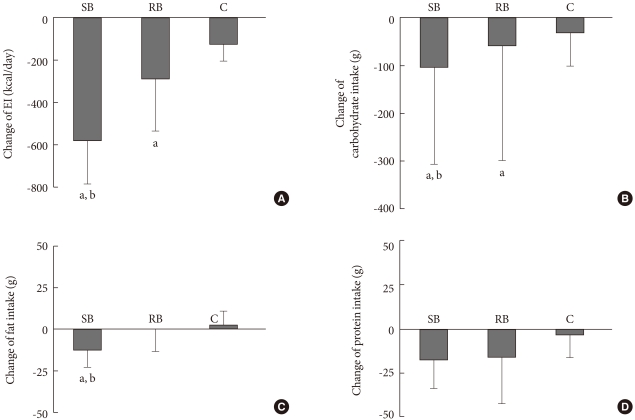
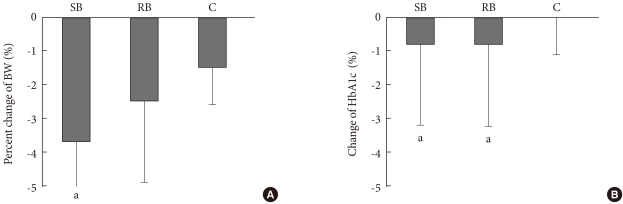
Figure & Data
References
Citations
Citations to this article as recorded by 
- Impact of Portion Control Tools on Portion Size Awareness, Choice and Intake: Systematic Review and Meta-Analysis
M. Angeles Vargas-Alvarez, Santiago Navas-Carretero, Luigi Palla, J. Alfredo Martínez, Eva Almiron-Roig
Nutrients.2021; 13(6): 1978. CrossRef - Do adults draw differently-sized meals on larger or smaller plates? Examining plate size in a community sample
David Sharp, Jeffery Sobal, Elaine Wethington
Food Quality and Preference.2019; 74: 72. CrossRef - Use and effectiveness of behavioural economics in interventions for lifestyle risk factors of non-communicable diseases: a systematic review with policy implications
Oana M Blaga, Livia Vasilescu, Razvan M Chereches
Perspectives in Public Health.2018; 138(2): 100. CrossRef - Whether Smaller Plates Reduce Consumption Depends on Who's Serving and Who's Looking: A Meta-Analysis
Stephen S. Holden, Natalina Zlatevska, Chris Dubelaar
SSRN Electronic Journal .2015;[Epub] CrossRef - Portion, package or tableware size for changing selection and consumption of food, alcohol and tobacco
Gareth J Hollands, Ian Shemilt, Theresa M Marteau, Susan A Jebb, Hannah B Lewis, Yinghui Wei, Julian P T Higgins, David Ogilvie
Cochrane Database of Systematic Reviews.2015;[Epub] CrossRef
 PubReader
 Cite
Cite


