- Current
- Browse
- Collections
-
For contributors
- For Authors
- Instructions to authors
- Article processing charge
- e-submission
- For Reviewers
- Instructions for reviewers
- How to become a reviewer
- Best reviewers
- For Readers
- Readership
- Subscription
- Permission guidelines
- About
- Editorial policy
Articles
- Page Path
- HOME > Diabetes Metab J > Volume 43(6); 2019 > Article
-
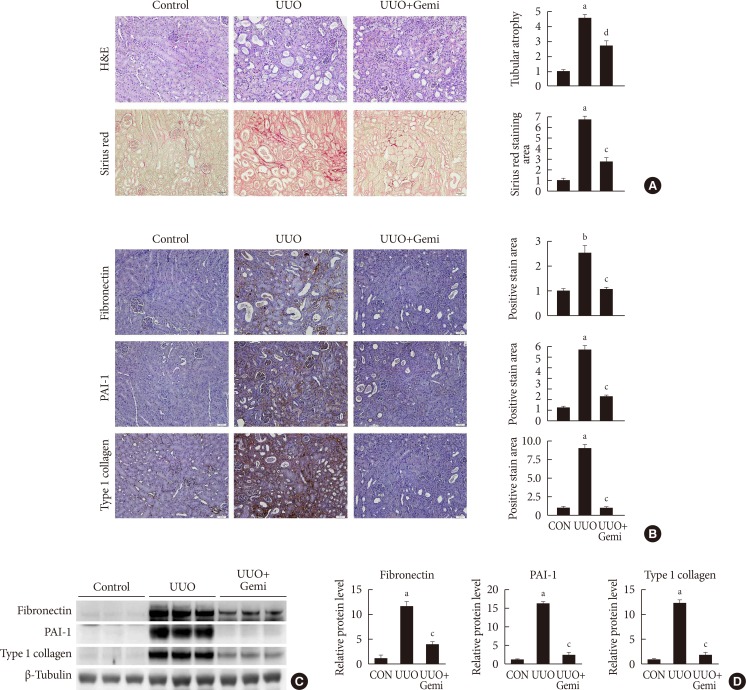
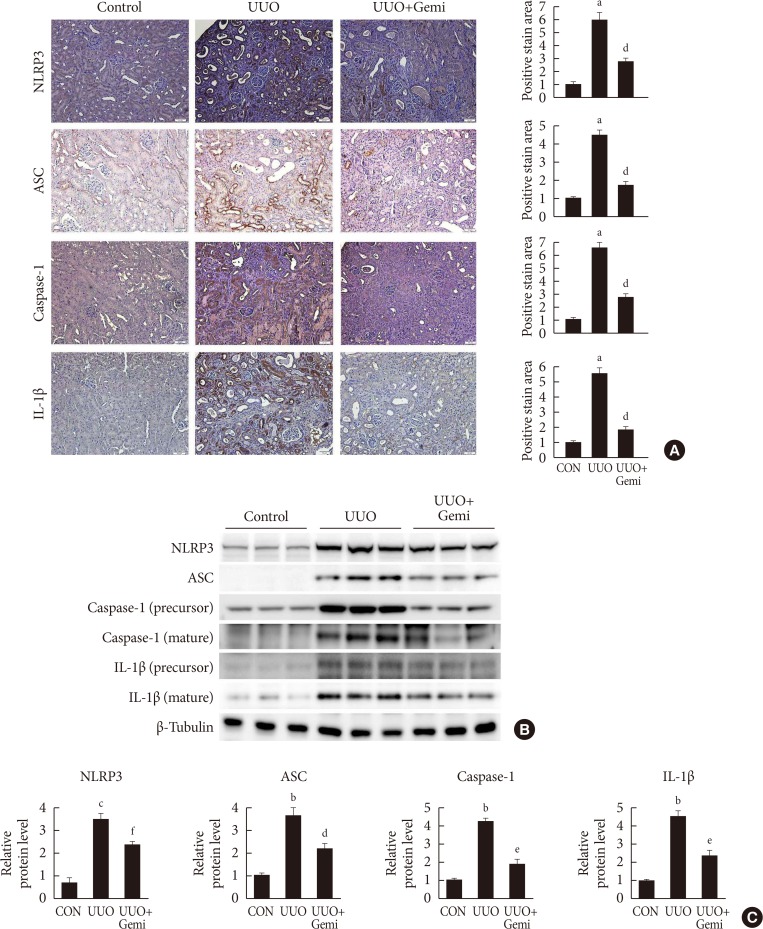
Original ArticleComplications Gemigliptin Attenuates Renal Fibrosis Through Down-Regulation of the NLRP3 Inflammasome
-
Jung Beom Seo1
 , Yeon-Kyung Choi1, Hye-In Woo1, Yun-A Jung1, Sungwoo Lee2, Seunghyeong Lee3,4, Mihyang Park3,4, In-Kyu Lee1, Gwon-Soo Jung2, Keun-Gyu Park1
 -
Diabetes & Metabolism Journal 2019;43(6):830-839.
DOI: https://doi.org/10.4093/dmj.2018.0181
Published online: March 5, 2019
1Division of Endocrinology and Metabolism, Department of Internal Medicine, School of Medicine, Kyungpook National University, Daegu, Korea.
2New Drug Development Center, Daegu-Gyeongbuk Medical Innovation Foundation, Daegu, Korea.
3Department of Biomedical Science, Graduate School, Kyungpook National University, Daegu, Korea.
4BK21 Plus KNU Biomedical Convergence Program, Kyungpook National University, Daegu, Korea.
- Corresponding author: Keun-Gyu Park. Division of Endocrinology and Metabolism, Department of Internal Medicine, School of Medicine, Kyungpook National University, 130 Dongdeok-ro, Jung-gu, Daegu 41944, Korea. kpark@knu.ac.kr
- Corresponding author: Gwon-Soo Jung. New Drug Development Center, Daegu-Gyeongbuk Medical Innovation Foundation, 88 Dongnae-ro, Dong-gu, Daegu 41061, Korea. gsjung@dgmif.re.kr
- *Jung Beom Seo and Yeon-Kyung Choi contributed equally to this study as first authors.
Copyright © 2019 Korean Diabetes Association
This is an Open Access article distributed under the terms of the Creative Commons Attribution Non-Commercial License (http://creativecommons.org/licenses/by-nc/4.0/) which permits unrestricted non-commercial use, distribution, and reproduction in any medium, provided the original work is properly cited.


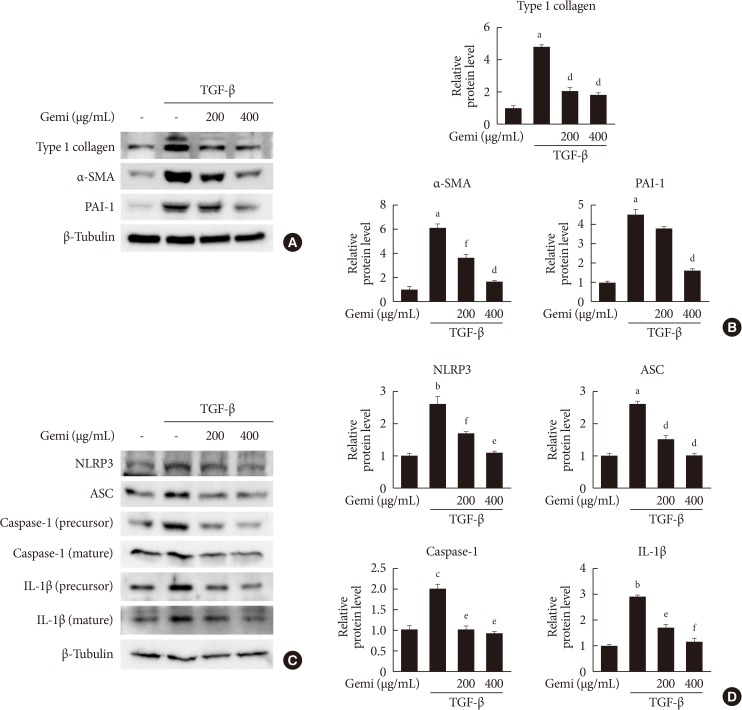
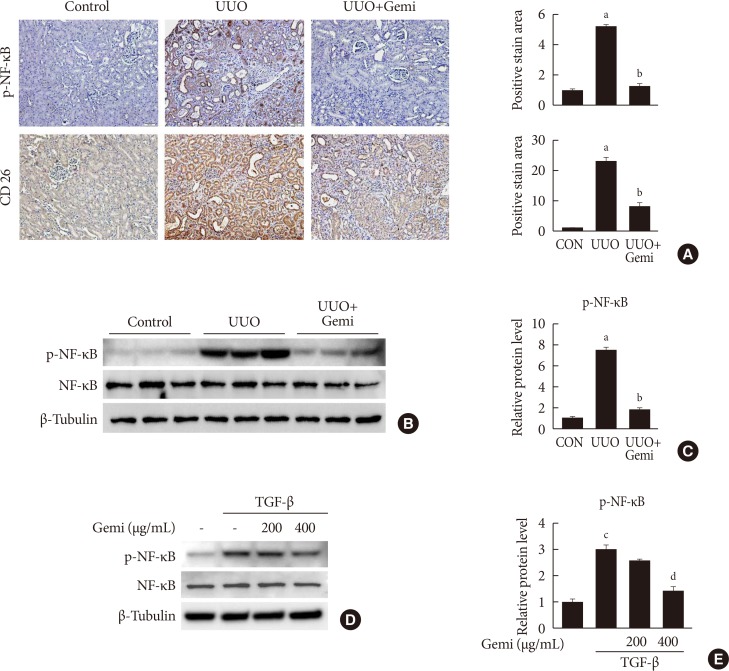
Figure & Data
References
Citations
- Novel pharmacological interventions for diabetic kidney disease
Seng Kiong Tan, Jairo A. Pinzon-Cortes, Mark E. Cooper
Current Opinion in Nephrology & Hypertension.2024; 33(1): 13. CrossRef - Integrated analysis reveals crosstalk between pyroptosis and immune regulation in renal fibrosis
Fengxia Bai, Longchao Han, Jifeng Yang, Yuxiu Liu, Xiangmeng Li, Yaqin Wang, Ruijian Jiang, Zhaomu Zeng, Yan Gao, Haisong Zhang
Frontiers in Immunology.2024;[Epub] CrossRef - Di (2-ethylhexyl) phthalate and polystyrene microplastics co-exposure caused oxidative stress to activate NF-κB/NLRP3 pathway aggravated pyroptosis and inflammation in mouse kidney
Shanshan Li, Xuedie Gu, Muyue Zhang, Qihang Jiang, Tong Xu
Science of The Total Environment.2024; 926: 171817. CrossRef - Fluorofenidone attenuates renal fibrosis by inhibiting lysosomal cathepsin‑mediated NLRP3 inflammasome activation
Linfeng Zheng, Wenjuan Mei, Jing Zhou, Xin Wei, Zhijuan Huang, Xiaozhen Lin, Li Zhang, Wei Liu, Qian Wu, Jinhong Li, Yan Yan
Experimental and Therapeutic Medicine.2024;[Epub] CrossRef - HIF1α-BNIP3-mediated mitophagy protects against renal fibrosis by decreasing ROS and inhibiting activation of the NLRP3 inflammasome
Jialin Li, Qisheng Lin, Xinghua Shao, Shu Li, Xuying Zhu, Jingkui Wu, Shan Mou, Leyi Gu, Qin Wang, Minfang Zhang, Kaiqi Zhang, Jiayue Lu, Zhaohui Ni
Cell Death & Disease.2023;[Epub] CrossRef - Pyroptosis in renal inflammation and fibrosis: current knowledge and clinical significance
Ya Liu, Haibo Lei, Wenyou Zhang, Qichang Xing, Renzhu Liu, Shiwei Wu, Zheng Liu, Qingzi Yan, Wencan Li, Xiang Liu, Yixiang Hu
Cell Death & Disease.2023;[Epub] CrossRef - Tubular injury in diabetic kidney disease: molecular mechanisms and potential therapeutic perspectives
Yu Wang, Mingyue Jin, Chak Kwong Cheng, Qiang Li
Frontiers in Endocrinology.2023;[Epub] CrossRef - Hederagenin inhibits high glucose‐induced fibrosis in human renal cells by suppression of NLRP3 inflammasome activation through reducing cathepsin B expression
Guohua Yang, Wang Yang, Hairong Jiang, Qing Yi, Wei Ma
Chemical Biology & Drug Design.2023; 102(6): 1409. CrossRef - Obstructive nephropathy and molecular pathophysiology of renal interstitial fibrosis
Rikke Nørregaard, Henricus A. M. Mutsaers, Jørgen Frøkiær, Tae-Hwan Kwon
Physiological Reviews.2023; 103(4): 2847. CrossRef - Adenine model of chronic renal failure in rats to determine whether MCC950, an NLRP3 inflammasome inhibitor, is a renopreventive
Mahmoud S. Sabra, Fahmy K. Hemida, Essmat A. H. Allam
BMC Nephrology.2023;[Epub] CrossRef - Gut microbiota dysbiosis promotes age-related atrial fibrillation by lipopolysaccharide and glucose-induced activation of NLRP3-inflammasome
Yun Zhang, Song Zhang, Bolin Li, Yingchun Luo, Yongtai Gong, Xuexin Jin, Jiawei Zhang, Yun Zhou, Xiaozhen Zhuo, Zixi Wang, Xinbo Zhao, Xuejie Han, Yunlong Gao, Hui Yu, Desen Liang, Shiqi Zhao, Danghui Sun, Dingyu Wang, Wei Xu, Guangjin Qu, Wanlan Bo, Dan
Cardiovascular Research.2022; 118(3): 785. CrossRef - The NLRP3 inflammasome in fibrosis and aging: The known unknowns
Yanqing Liu, Xuezeng Xu, Wangrui Lei, Yuxuan Hou, Yan Zhang, Ran Tang, Zhi Yang, Ye Tian, Yanli Zhu, Changyu Wang, Chao Deng, Shaofei Zhang, Yang Yang
Ageing Research Reviews.2022; 79: 101638. CrossRef - Research progress of endothelial‐mesenchymal transition in diabetic kidney disease
Ying Chen, Hang Zou, Hongwei Lu, Hong Xiang, Shuhua Chen
Journal of Cellular and Molecular Medicine.2022; 26(12): 3313. CrossRef - Exploring the mechanism of Shendi Bushen capsule in anti-renal fibrosis using metabolomics theory and network analysis
Tianwei Meng, Hong Chang, Hongyu Meng
Molecular Omics.2022; 18(9): 873. CrossRef - Gemigliptin suppresses salivary dysfunction in streptozotocin-induced diabetic rats
Wan Seok Kang, Woo Kwon Jung, Su-Bin Park, Hyung Rae Kim, Junghyun Kim
Biomedicine & Pharmacotherapy.2021; 137: 111297. CrossRef - Long‐Term Dipeptidyl Peptidase 4 Inhibition Worsens Hypertension and Renal and Cardiac Abnormalities in Obese Spontaneously Hypertensive Heart Failure Rats
Edwin K. Jackson, Zaichuan Mi, Delbert G. Gillespie, Dongmei Cheng, Stevan P. Tofovic
Journal of the American Heart Association.2021;[Epub] CrossRef - Disulfiram inhibits inflammation and fibrosis in a rat unilateral ureteral obstruction model by inhibiting gasdermin D cleavage and pyroptosis
Yu Zhang, Ruicheng Zhang, Xiaohu Han
Inflammation Research.2021; 70(5): 543. CrossRef - Inflammasome as an Effective Platform for Fibrosis Therapy
Ting-Ting Chen, Feng Xiao, Nan Li, Shan Shan, Meng Qi, Zi-Ying Wang, Sheng-Nan Zhang, Wei Wei, Wu-Yi Sun
Journal of Inflammation Research.2021; Volume 14: 1575. CrossRef - Targeting Dermal Fibroblast Subtypes in Antifibrotic Therapy: Surface Marker as a Cellular Identity or a Functional Entity?
Xin Huang, Yimin Khoong, Chengyao Han, Dai Su, Hao Ma, Shuchen Gu, Qingfeng Li, Tao Zan
Frontiers in Physiology.2021;[Epub] CrossRef - Linagliptin Protects against Endotoxin-Induced Acute Kidney Injury in Rats by Decreasing Inflammatory Cytokines and Reactive Oxygen Species
Tsung-Jui Wu, Yi-Jen Hsieh, Chia-Wen Lu, Chung-Jen Lee, Bang-Gee Hsu
International Journal of Molecular Sciences.2021; 22(20): 11190. CrossRef - Psidium guajava Flavonoids Prevent NLRP3 Inflammasome Activation and Alleviate the Pancreatic Fibrosis in a Chronic Pancreatitis Mouse Model
Guixian Zhang, Liming Tang, Hongbin Liu, Dawei Liu, Manxue Wang, Jun Cai, Weijun Liu, Wei Nie, Yi Zhang, Xiaomeng Yu
The American Journal of Chinese Medicine.2021; 49(08): 2001. CrossRef - Effect and Regulation of the NLRP3 Inflammasome During Renal Fibrosis
Hong Zhang, Zhengchao Wang
Frontiers in Cell and Developmental Biology.2020;[Epub] CrossRef - Zhen-Wu-Tang Protects IgA Nephropathy in Rats by Regulating Exosomes to Inhibit NF-κB/NLRP3 Pathway
Honglian Li, Ruirui Lu, Yu Pang, Jicheng Li, Yiwen Cao, Hongxin Fu, Guoxing Fang, Qiuhe Chen, Bihao Liu, Junbiao Wu, Yuan Zhou, Jiuyao Zhou
Frontiers in Pharmacology.2020;[Epub] CrossRef - Protective effect of exogenous hydrogen sulfide on diaphragm muscle fibrosis in streptozotocin-induced diabetic rats
Rui Yang, Qiang Jia, Yan Li, Shomaila Mehmood
Experimental Biology and Medicine.2020; 245(14): 1280. CrossRef
 PubReader
 Cite
Cite