- Current
- Browse
- Collections
-
For contributors
- For Authors
- Instructions to authors
- Article processing charge
- e-submission
- For Reviewers
- Instructions for reviewers
- How to become a reviewer
- Best reviewers
- For Readers
- Readership
- Subscription
- Permission guidelines
- About
- Editorial policy
Articles
- Page Path
- HOME > Diabetes Metab J > Volume 43(4); 2019 > Article
-
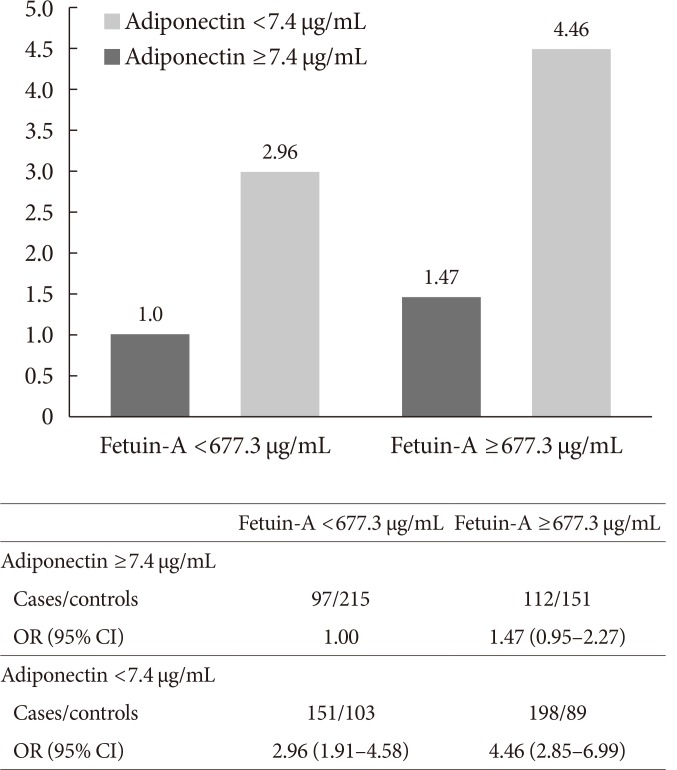
Original ArticleEpidemiology Plasma Fetuin-A Levels and Risk of Type 2 Diabetes Mellitus in A Chinese Population: A Nested Case-Control Study
-
Yeli Wang1
 , Woon-Puay Koh1,2, Majken K. Jensen3,4, Jian-Min Yuan5,6, An Pan7
 -
Diabetes & Metabolism Journal 2019;43(4):474-486.
DOI: https://doi.org/10.4093/dmj.2018.0171
Published online: March 20, 2019
1Health Services and Systems Research, Duke-NUS Medical School, Singapore.
2Saw Swee Hock School of Public Health, National University of Singapore and National University Health System, Singapore.
3Department of Nutrition, Harvard T.H. Chan School of Public Health, Boston, MA, USA.
4Channing Division of Network Medicine, Department of Medicine, Brigham and Women's Hospital, Harvard Medical School, Boston, MA, USA.
5Division of Cancer Control and Population Sciences, UPMC Hillman Cancer Center, University of Pittsburgh, Pittsburgh, PA, USA.
6Department of Epidemiology, Graduate School of Public Health, University of Pittsburgh, Pittsburgh, PA, USA.
7Department of Epidemiology and Biostatistics, School of Public Health, Tongji Medical College, Huazhong University of Science and Technology, Wuhan, China.
- Corresponding author: An Pan. Department of Epidemiology and Biostatistics, School of Public Health, Tongji Medical College, Huazhong University of Science and Technology, Hubei, Wuhan 430030, China. panan@hust.edu.cn
- Corresponding author: Woon-Puay Koh. Health Services and Systems Research, Duke-NUS Medical School, 169857, Singapore. woonpuay.koh@duke-nus.edu.sg
Copyright © 2019 Korean Diabetes Association
This is an Open Access article distributed under the terms of the Creative Commons Attribution Non-Commercial License (http://creativecommons.org/licenses/by-nc/4.0/) which permits unrestricted non-commercial use, distribution, and reproduction in any medium, provided the original work is properly cited.
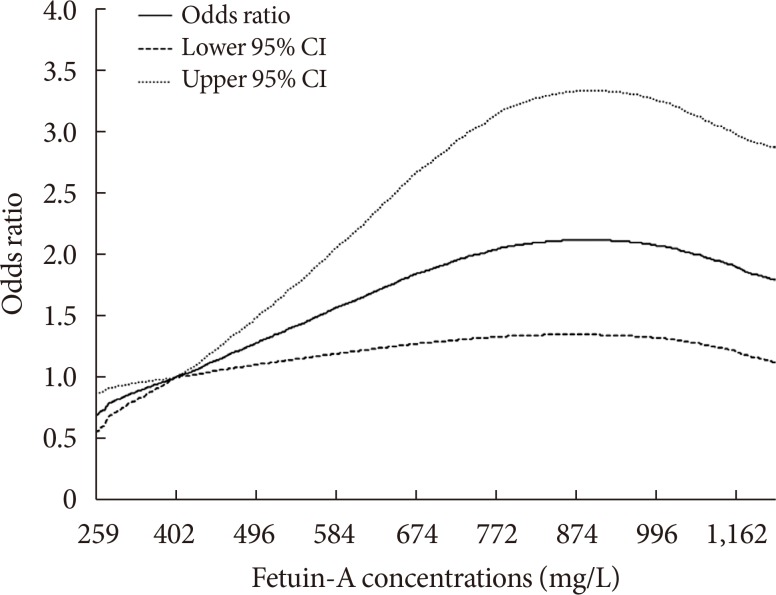

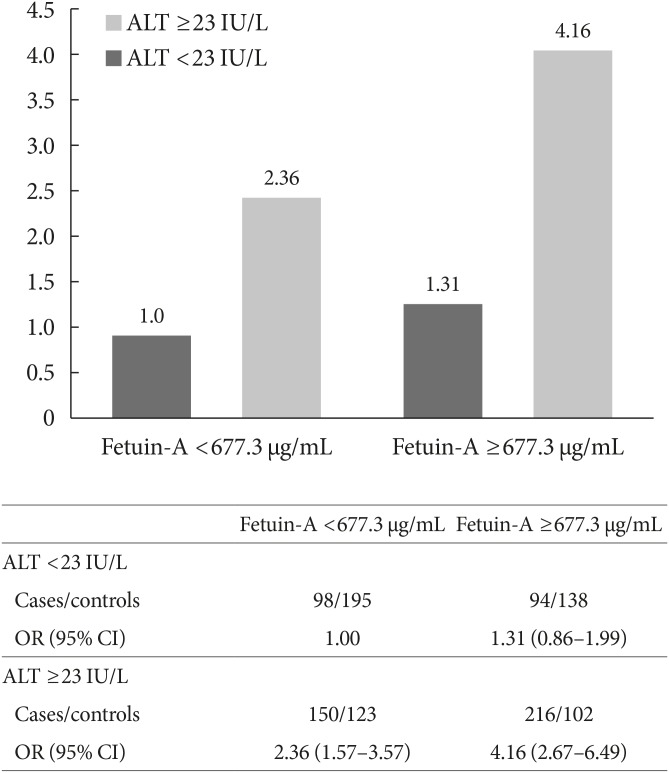
Figure & Data
References
Citations
- Type 2 diabetes and gut health - Narrative review
Janeline Lunghar, A. Thahira Banu
International Journal of Noncommunicable Diseases.2024; 9(1): 4. CrossRef - The predicted mechanisms and evidence of probiotics on type 2 diabetes mellitus (T2DM)
Ousman Bajinka, Kodzovi Sylvain Dovi, Lucette Simbilyabo, Ishmail Conteh, Yurong Tan
Archives of Physiology and Biochemistry.2023; : 1. CrossRef - Multiplexed measurements of salivary fetuin-A, insulin, and adiponectin as potential non-invasive biomarkers in childhood obesity
Vaithinathan Selvaraju, Jeganathan R. Babu, Thangiah Geetha
Cytokine.2022; 153: 155843. CrossRef - Recent Developments in Biomarkers for Diagnosis and Screening of Type 2 Diabetes Mellitus
Margarita Ortiz-Martínez, Mirna González-González, Alexandro J. Martagón, Victoria Hlavinka, Richard C. Willson, Marco Rito-Palomares
Current Diabetes Reports.2022; 22(3): 95. CrossRef - Serum Fetuin-A and Risk of Gestational Diabetes Mellitus: An Observational Study and Mendelian Randomization Analysis
Ping Wu, Yi Wang, Yi Ye, Xue Yang, Qi Lu, Jiaying Yuan, Li Zha, Yan Liu, Xingyue Song, Shijiao Yan, Ying Wen, Xiaorong Qi, Chun-Xia Yang, Yixin Wang, Gang Liu, Chuanzhu Lv, Xiong-Fei Pan, An Pan
The Journal of Clinical Endocrinology & Metabolism.2022; 107(9): e3841. CrossRef - Hepatokines as a Molecular Transducer of Exercise
Dae Yun Seo, Se Hwan Park, Jubert Marquez, Hyo-Bum Kwak, Tae Nyun Kim, Jun Hyun Bae, Jin-Ho Koh, Jin Han
Journal of Clinical Medicine.2021; 10(3): 385. CrossRef - Serum Fetuin-B Levels Are Elevated in Women with Metabolic Syndrome and Associated with Increased Oxidative Stress
Shiyao Xue, Hongdong Han, Shunli Rui, Mengliu Yang, Yizhou Huang, Bin Zhan, Shan Geng, Hua Liu, Chen Chen, Gangyi Yang, Ling Li, Colin Murdoch
Oxidative Medicine and Cellular Longevity.2021; 2021: 1. CrossRef - CD44, a Predominant Protein in Methylglyoxal-Induced Secretome of Muscle Cells, is Elevated in Diabetic Plasma
Shakuntala Bai, Arvindkumar H. Chaurasiya, Reema Banarjee, Prachi B. Walke, Faraz Rashid, Ambika G. Unnikrishnan, Mahesh J. Kulkarni
ACS Omega.2020; 5(39): 25016. CrossRef
 PubReader
 Cite
Cite