
- Current
- Browse
- Collections
-
For contributors
- For Authors
- Instructions to authors
- Article processing charge
- e-submission
- For Reviewers
- Instructions for reviewers
- How to become a reviewer
- Best reviewers
- For Readers
- Readership
- Subscription
- Permission guidelines
- About
- Editorial policy
Articles
- Page Path
- HOME > Diabetes Metab J > Volume 43(1); 2019 > Article
-
Original ArticleObesity and Metabolic Syndrome Proportion and Characteristics of the Subjects with Low Muscle Mass and Abdominal Obesity among the Newly Diagnosed and Drug-Naïve Type 2 Diabetes Mellitus Patients
-
Jung A Kim1, Soon Young Hwang2, Hye Soo Chung1, Nam Hoon Kim3, Ji A Seo4, Sin Gon Kim3, Nan Hee Kim4, Kyung Mook Choi1, Sei Hyun Baik1, Hye Jin Yoo1

-
Diabetes & Metabolism Journal 2019;43(1):105-113.
DOI: https://doi.org/10.4093/dmj.2018.0036
Published online: September 28, 2018
1Division of Endocrinology, Department of Internal Medicine, Korea University Guro Hospital, Korea University College of Medicine, Seoul, Korea.
2Department of Biostatistics, Korea University College of Medicine, Seoul, Korea.
3Division of Endocrinology, Department of Internal Medicine, Korea University Anam Hospital, Korea University College of Medicine, Seoul, Korea.
4Division of Endocrinology, Department of Internal Medicine, Korea University Ansan Hospital, Korea University College of Medicine, Ansan, Korea.
- Corresponding author: Hye Jin Yoo. Division of Endocrinology, Department of Internal Medicine, Korea University Guro Hospital, Korea University College of Medicine, 148 Gurodong-ro, Guro-gu, Seoul 08308, Korea. deisy21@naver.com
Copyright © 2018 Korean Diabetes Association
This is an Open Access article distributed under the terms of the Creative Commons Attribution Non-Commercial License (http://creativecommons.org/licenses/by-nc/4.0/) which permits unrestricted non-commercial use, distribution, and reproduction in any medium, provided the original work is properly cited.
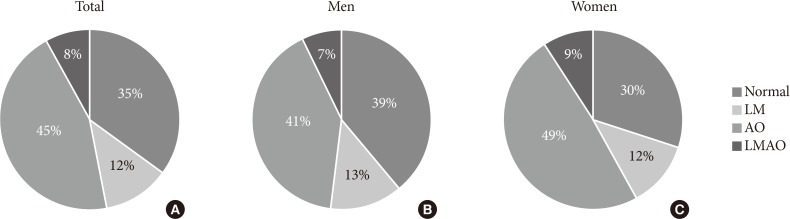
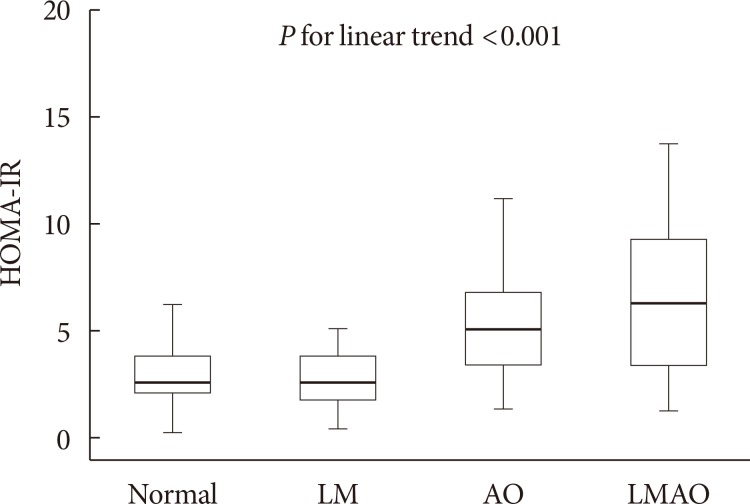
Figure & Data
References
Citations
- Clinical observation on acupuncture for 80 patients with abdominal obesity in Germany: based on the theory of unblocking and regulating the Belt Vessel
Yuanyuan Li, Hang Xiong, Shuhui Ma, Jingzhang Dai
Journal of Acupuncture and Tuina Science.2023; 21(2): 137. CrossRef - Waist circumference and end‐stage renal disease based on glycaemic status: National Health Insurance Service data 2009–2018
Yun Kyung Cho, Ji Hye Huh, Shinje Moon, Yoon Jung Kim, Yang‐Hyun Kim, Kyung‐do Han, Jun Goo Kang, Seong Jin Lee, Sung‐Hee Ihm
Journal of Cachexia, Sarcopenia and Muscle.2023; 14(1): 585. CrossRef - Incidence of sarcopenic obesity in older patients with diabetes and association between sarcopenic obesity and higher-level functional capacity: evaluation based on a consensus statement
Satoshi Ida, Ryutaro Kaneko, Kanako Imataka, Kaoru Okubo, Kentaro Azuma, Kazuya Murata
Endocrine Journal.2023; 70(6): 591. CrossRef - A Novel Anthropometric Parameter, Weight-Adjusted Waist Index Represents Sarcopenic Obesity in Newly Diagnosed Type 2 Diabetes Mellitus
Min Jeong Park, Soon Young Hwang, Nam Hoon Kim, Sin Gon Kim, Kyung Mook Choi, Sei Hyun Baik, Hye Jin Yoo
Journal of Obesity & Metabolic Syndrome.2023; 32(2): 130. CrossRef - Prevalence of sarcopenic obesity in patients with diabetes and adverse outcomes: A systematic review and meta-analysis
Yuan-yuan Zhou, Jin-feng Wang, Qian Yao, Qiu-feng Jian, Zhi-peng Luo
Clinical Nutrition ESPEN.2023; 58: 128. CrossRef - The Correlation Between Leg Muscle Mass Index and Non-Alcoholic Fatty Liver Disease in Patients with Type 2 Diabetes Mellitus
Menggege Liu, Qing Zhang, Juan Liu, Huiling Bai, Ping Yang, Xinhua Ye, Xiaoqing Yuan
Diabetes, Metabolic Syndrome and Obesity.2023; Volume 16: 4169. CrossRef - Sarcopenic Obesity with Normal Body Size May Have Higher Insulin Resistance in Elderly Patients with Type 2 Diabetes Mellitus
Tingting Han, Ting Yuan, Xinyue Liang, Ningxin Chen, Jia Song, Xin Zhao, Yurong Weng, Yaomin Hu
Diabetes, Metabolic Syndrome and Obesity: Targets and Therapy.2022; Volume 15: 1197. CrossRef - Relationship between Visceral Adipose Index, Lipid Accumulation Product and Type 2 Diabetes Mellitus
停停 陈
Advances in Clinical Medicine.2022; 12(04): 3350. CrossRef - Assessment of the relationship between prediabetes and low skeletal mass based on blood creatinine level
S. I. Ibragimova, G. O. Nuskabayeva, Z. N. Shalkharova, K. Zh. Sadykova, G. A. Junusbekova, M. Oran
Diabetes mellitus.2022; 25(3): 226. CrossRef - Changes in body composition and low blood urea nitrogen level related to an increase in the prevalence of fatty liver over 20 years: A cross‐sectional study
Yasushi Imamura, Seiichi Mawatari, Kohei Oda, Kotaro Kumagai, Yasunari Hiramine, Akiko Saishoji, Atsuko Kakihara, Mai Nakahara, Manei Oku, Kaori Hosoyamada, Shuji Kanmura, Akihiro Moriuchi, Hironori Miyahara, Akio ido
Hepatology Research.2021; 51(5): 570. CrossRef - Body Composition and Diabetes
Hye Jin Yoo
The Journal of Korean Diabetes.2021; 22(4): 238. CrossRef - Reduced Skeletal Muscle Volume and Increased Skeletal Muscle Fat Deposition Characterize Diabetes in Individuals after Pancreatitis: A Magnetic Resonance Imaging Study
Andre E. Modesto, Juyeon Ko, Charlotte E. Stuart, Sakina H. Bharmal, Jaelim Cho, Maxim S. Petrov
Diseases.2020; 8(3): 25. CrossRef - Low alanine aminotransferase levels predict low muscle strength in older patients with diabetes: A nationwide cross‐sectional study in Korea
Seung Min Chung, Jun Sung Moon, Ji Sung Yoon, Kyu Chang Won, Hyoung Woo Lee
Geriatrics & Gerontology International.2020; 20(4): 271. CrossRef - Association between sarcopenic obesity and higher risk of type 2 diabetes in adults: A systematic review and meta-analysis
Dima Khadra, Leila Itani, Hana Tannir, Dima Kreidieh, Dana El Masri, Marwan El Ghoch
World Journal of Diabetes.2019; 10(5): 311. CrossRef
 PubReader
 Cite
Cite


