- Current
- Browse
- Collections
-
For contributors
- For Authors
- Instructions to authors
- Article processing charge
- e-submission
- For Reviewers
- Instructions for reviewers
- How to become a reviewer
- Best reviewers
- For Readers
- Readership
- Subscription
- Permission guidelines
- About
- Editorial policy
Articles
- Page Path
- HOME > Diabetes Metab J > Volume 39(6); 2015 > Article
-
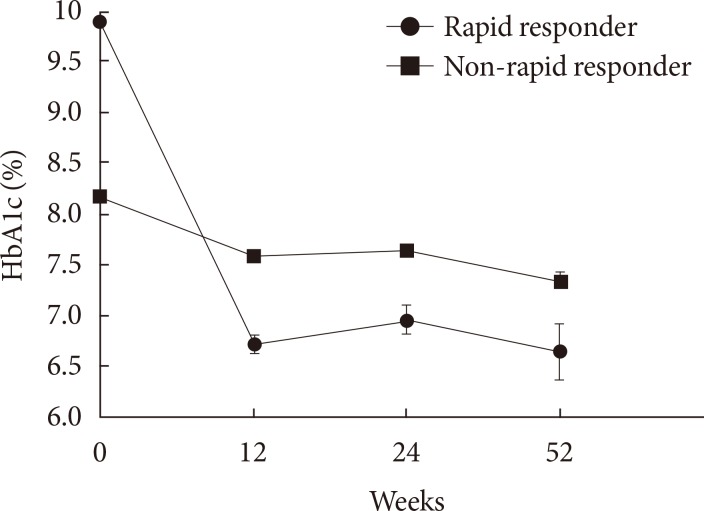
Original ArticleClinical Care/Education Clinical Characteristics and Metabolic Predictors of Rapid Responders to Dipeptidyl Peptidase-4 Inhibitor as an Add-on Therapy to Sulfonylurea and Metformin
- Ye An Kim1,2, Won Sang Yoo3, Eun Shil Hong1,4, Eu Jeong Ku1,5, Kyeong Seon Park1,6, Soo Lim1,6, Young Min Cho1, Kyong Soo Park1, Hak Chul Jang1,6, Sung Hee Choi1,6
-
Diabetes & Metabolism Journal 2015;39(6):489-497.
DOI: https://doi.org/10.4093/dmj.2015.39.6.489
Published online: November 27, 2015
1Department of Internal Medicine, Seoul National University College of Medicine, Seoul, Korea.
2Department of Internal Medicine, Seoul National University Hospital Healthcare System Gangnam Center, Seoul, Korea.
3Department of Internal Medicine, Dankook University College of Medicine, Cheonan, Korea.
4Department of Internal Medicine, Konkuk University Chungju Hospital, Konkuk University School of Medicine, Chungju, Korea.
5Department of Internal Medicine, Chungbuk National University Hospital, Chungbuk National University College of Medicine, Cheongju, Korea.
6Department of Internal Medicine, Seoul National University Bundang Hospital, Seoul National University College of Medicine, Seongnam, Korea.
- Corresponding author: Sung Hee Choi. Department of Internal Medicine, Seoul National University Bundang Hospital, Seoul National University College of Medicine, 82 Gumi-ro 173beon-gil, Bundang-gu, Seongnam 13620, Korea. drshchoi@snu.ac.kr
Copyright © 2015 Korean Diabetes Association
This is an Open Access article distributed under the terms of the Creative Commons Attribution Non-Commercial License (http://creativecommons.org/licenses/by-nc/3.0/) which permits unrestricted non-commercial use, distribution, and reproduction in any medium, provided the original work is properly cited.
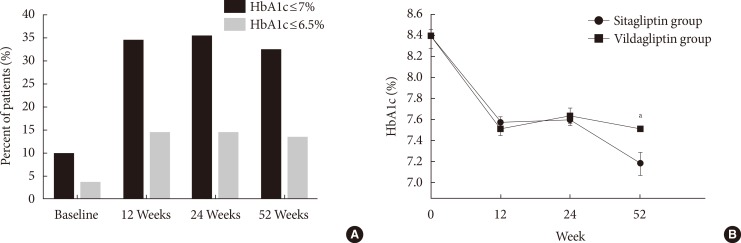

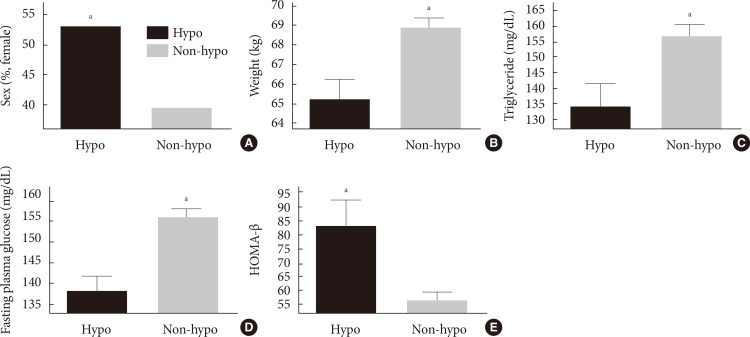
Figure & Data
References
Citations
- A genetic variant in GLP1R is associated with response to DPP-4 inhibitors in patients with type 2 diabetes
Eugene Han, Hye Sun Park, Obin Kwon, Eun Yeong Choe, Hye Jin Wang, Yong-ho Lee, Sang-Hak Lee, Chul Hoon Kim, Lee-Kyung Kim, Soo Heon Kwak, Kyong Soo Park, Chul Sik Kim, Eun Seok Kang
Medicine.2016; 95(44): e5155. CrossRef
 PubReader
 Cite
Cite