
- Current
- Browse
- Collections
-
For contributors
- For Authors
- Instructions to authors
- Article processing charge
- e-submission
- For Reviewers
- Instructions for reviewers
- How to become a reviewer
- Best reviewers
- For Readers
- Readership
- Subscription
- Permission guidelines
- About
- Editorial policy
Articles
- Page Path
- HOME > Diabetes Metab J > Volume 39(3); 2015 > Article
-
Original ArticleOthers Optimal Waist Circumference Cutoff Value Based on Insulin Resistance and Visceral Obesity in Koreans with Type 2 Diabetes
- Jung Soo Lim1, Young Ju Choi2, Soo-Kyung Kim3, Byoung Wook Huh2, Eun Jig Lee4, Kap Bum Huh2
-
Diabetes & Metabolism Journal 2015;39(3):253-263.
DOI: https://doi.org/10.4093/dmj.2015.39.3.253
Published online: April 24, 2015
1Division of Endocrinology, Department of Internal Medicine, Yonsei University Wonju College of Medicine, Wonju, Korea.
2Huh's Diabetes Center and the 21C Diabetes and Vascular Research Institute, Seoul, Korea.
3Department of Internal Medicine, CHA Bundang Medical Center, CHA University, Seongnam, Korea.
4Division of Endocrinology, Department of Internal Medicine, Yonsei University College of Medicine, Seoul, Korea.
- Corresponding author: Kap Bum Huh. Huh's Diabetes Center and the 21C Diabetes and Vascular Research Institute, 120 Sinchon-ro, Mapo-gu, Seoul 121-806, Korea. huh7181827@hanmail.net
- Corresponding author: Eun Jig Lee. Division of Endocrinology, Department of Internal Medicine, Yonsei University College of Medicine, 50-1 Yonsei-ro, Seodaemun-gu, Seoul 120-752, Korea. ejlee423@yuhs.ac
Copyright © 2015 Korean Diabetes Association
This is an Open Access article distributed under the terms of the Creative Commons Attribution Non-Commercial License (http://creativecommons.org/licenses/by-nc/3.0/) which permits unrestricted non-commercial use, distribution, and reproduction in any medium, provided the original work is properly cited.
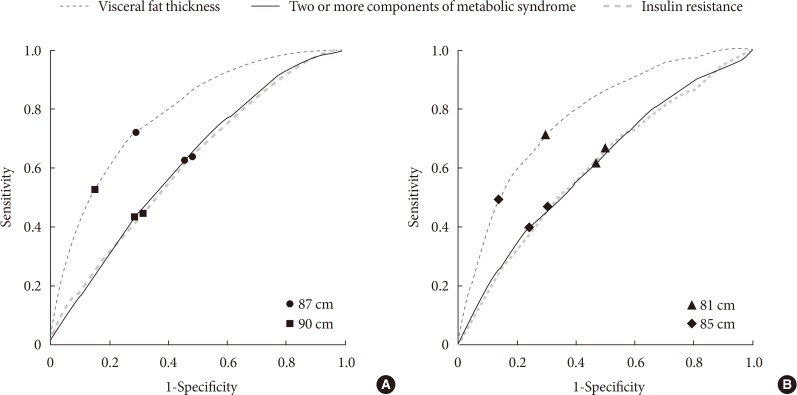
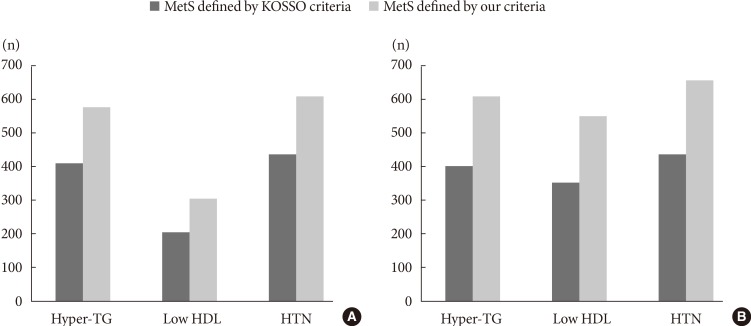
Figure & Data
References
Citations
- Association between Muscle Mass, Body Fat Mass, and Abdominal Circumstances with Insulin Resistance among Young Adult Population with Prediabetes Risk
Anindya Putri Adhisti, Siti Fatimah-Muis, Amalia Sukmadianti, Darmono S.S., Febe Christianto
The Indian Journal of Nutrition and Dietetics.2023; : 176. CrossRef - Brazil nut prevents oxidative DNA damage in type 2 diabetes patients
Tamires Pavei Macan, Thais Aquino de Amorim, Adriani Paganini Damiani, Ângela Caroline da Luz Beretta, Marina Lummertz Magenis, Thais Ceresér Vilela, João Paulo Teixeira, Vanessa Moraes de Andrade
Drug and Chemical Toxicology.2022; 45(3): 1066. CrossRef - Metabolic Syndrome and Breast Cancer Molecular Subtypes: An Observational Patient Study
Dafina Ademi-Islami, Suzana Manxhuka-Kerliu, Dhurata Tarifa-Koroveshi, Rozafa Koliqi, Blerim Mujaj
Breast Cancer: Basic and Clinical Research.2022; 16: 117822342210805. CrossRef - Performance of Two Novel Obesity Indicators for the Management of Metabolic Syndrome in Young Adults
Xiaoli Liu, Chunpeng Ma, Fuzai Yin, Rui Wang, Qiang Lu, Na Lu, Chunming Ma
Frontiers in Endocrinology.2021;[Epub] CrossRef - Differential effect of subcutaneous abdominal and visceral adipose tissue on cardiometabolic risk
Susan Sam
Hormone Molecular Biology and Clinical Investigation.2018;[Epub] CrossRef - Three novel obese indicators perform better in monitoring management of metabolic syndrome in type 2 diabetes
Chun-Ming Ma, Na Lu, Rui Wang, Xiao-Li Liu, Qiang Lu, Fu-Zai Yin
Scientific Reports.2017;[Epub] CrossRef - Association between Body Weight Changes and Menstrual Irregularity: The Korea National Health and Nutrition Examination Survey 2010 to 2012
Kyung Min Ko, Kyungdo Han, Youn Jee Chung, Kun-Ho Yoon, Yong Gyu Park, Seung-Hwan Lee
Endocrinology and Metabolism.2017; 32(2): 248. CrossRef - The renal tubular damage marker urinary N-acetyl-β-d-glucosaminidase may be more closely associated with early detection of atherosclerosis than the glomerular damage marker albuminuria in patients with type 2 diabetes
So Ra Kim, Yong-ho Lee, Sang-Guk Lee, Eun Seok Kang, Bong-Soo Cha, Byung-Wan Lee
Cardiovascular Diabetology.2017;[Epub] CrossRef - The association between metabolic health, obesity phenotype and the risk of breast cancer
Yong‐Moon Mark Park, Alexandra J. White, Hazel B. Nichols, Katie M. O'Brien, Clarice R. Weinberg, Dale P. Sandler
International Journal of Cancer.2017; 140(12): 2657. CrossRef - Reappraisal of waist circumference cutoff value according to general obesity
Kyung-Soo Kim, Hyun-Ju Oh, Young Ju Choi, Byung Wook Huh, Soo-Kyung Kim, Seok Won Park, Eun Jig Lee, Yong-Wook Cho, Kap-Bum Huh
Nutrition & Metabolism.2016;[Epub] CrossRef
 PubReader
 Cite
Cite


