
- Current
- Browse
- Collections
-
For contributors
- For Authors
- Instructions to authors
- Article processing charge
- e-submission
- For Reviewers
- Instructions for reviewers
- How to become a reviewer
- Best reviewers
- For Readers
- Readership
- Subscription
- Permission guidelines
- About
- Editorial policy
Articles
- Page Path
- HOME > Diabetes Metab J > Volume 38(6); 2014 > Article
-
Original ArticleClinical Care/Education Arterial Stiffness by Aerobic Exercise Is Related with Aerobic Capacity, Physical Activity Energy Expenditure and Total Fat but not with Insulin Sensitivity in Obese Female Patients with Type 2 Diabetes
- Ji Yeon Jung1, Kyung Wan Min2, Hee Jung Ahn, Hwi Ryun Kwon1, Jae Hyuk Lee2, Kang Seo Park2, Kyung Ah Han2
-
Diabetes & Metabolism Journal 2014;38(6):439-448.
DOI: https://doi.org/10.4093/dmj.2014.38.6.439
Published online: December 15, 2014
1Diabetes Center, Eulji General Hospital, Seoul, Korea.
2Department of Internal Medicine, Eulji University School of Medicine, Daejeon, Korea.
- Corresponding author: Kyung Ah Han. Department of Internal Medicine, Eulji University School of Medicine, 77 Gyeryong-ro 771beon-gil, Jung-gu, Daejeon 301-746, Korea. hka1114@yahoo.co.kr
- *Ji Yeon Jung and Kyung Wan Min contributed equally to this study as first authors.
• Received: December 18, 2013 • Accepted: April 10, 2014
Copyright © 2014 Korean Diabetes Association
This is an Open Access article distributed under the terms of the Creative Commons Attribution Non-Commercial License (http://creativecommons.org/licenses/by-nc/3.0/) which permits unrestricted non-commercial use, distribution, and reproduction in any medium, provided the original work is properly cited.

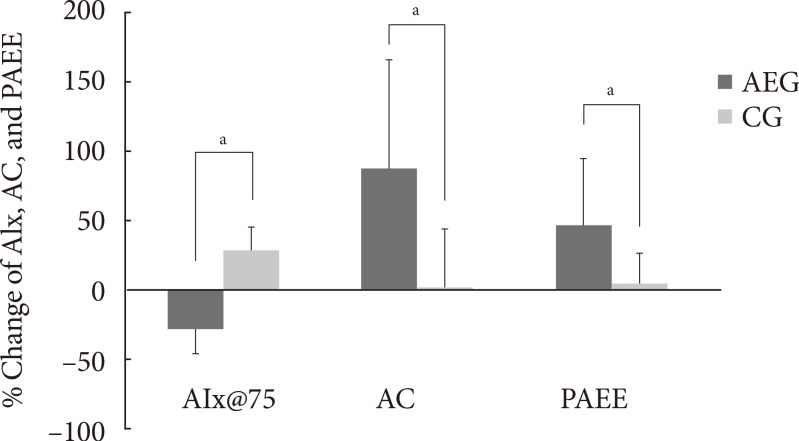
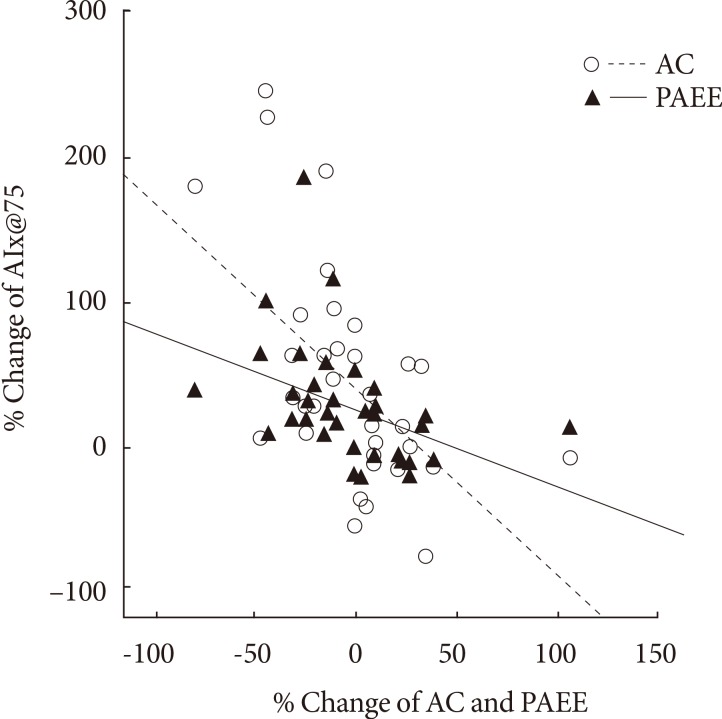


Figure & Data
References
Citations
Citations to this article as recorded by 
- Relationship between objectively measured physical activity and subclinical cardiovascular disease: a systematic review
Aparna Narendrula, Ellen Brinza, Christine Horvat Davey, Chris T Longenecker, Allison R Webel
BMJ Open Sport & Exercise Medicine.2024; 10(1): e001596. CrossRef - Aerobic training reduces pancreatic fat content and improves β‐cell function: A randomized controlled trial using IDEAL‐IQ magnetic resonance imaging
Min Li, Qidong Zheng, Joshua D. Miller, Panpan Zuo, Xiaodan Yuan, Jitao Feng, Chao Liu, Shan Bao, Qingqing Lou
Diabetes/Metabolism Research and Reviews.2022;[Epub] CrossRef - Effect of aerobic exercise on waist circumference in adults with overweight or obesity: A systematic review and meta‐analysis
Alex Armstrong, Klaus Jungbluth Rodriguez, Angelo Sabag, Yorgi Mavros, Helen M. Parker, Shelley E. Keating, Nathan A. Johnson
Obesity Reviews.2022;[Epub] CrossRef - Aortic waveform responses to insulin in late versus early chronotype with metabolic syndrome
Mary‐Margaret E. Remchak, Emily M. Heiston, Anna Ballantyne, Brielle L. Dotson, Steven K. Malin
Physiological Reports.2022;[Epub] CrossRef - Exercise and ectopic fat in type 2 diabetes: A systematic review and meta-analysis
A. Sabag, K.L. Way, S.E. Keating, R.N. Sultana, H.T. O’Connor, M.K. Baker, V.H. Chuter, J. George, N.A. Johnson
Diabetes & Metabolism.2017; 43(3): 195. CrossRef - Arterial Stiffness Measured with the Cuff Oscillometric Method Is Predictive of Exercise Capacity in Patients with Cardiac Diseases
Yasushi Tazawa, Nobuyoshi Mori, Yoshiko Ogawa, Osamu Ito, Masahiro Kohzuki
The Tohoku Journal of Experimental Medicine.2016; 239(2): 127. CrossRef
 PubReader
 Cite
Cite


