
- Current
- Browse
- Collections
-
For contributors
- For Authors
- Instructions to authors
- Article processing charge
- e-submission
- For Reviewers
- Instructions for reviewers
- How to become a reviewer
- Best reviewers
- For Readers
- Readership
- Subscription
- Permission guidelines
- About
- Editorial policy
Articles
- Page Path
- HOME > Diabetes Metab J > Volume 47(4); 2023 > Article
-
Original ArticleCardiovascular Risk/Epidemiology Glycemic Control and Adverse Clinical Outcomes in Patients with Chronic Kidney Disease and Type 2 Diabetes Mellitus: Results from KNOW-CKD
-
Ga Young Heo1
 , Hee Byung Koh1, Hyung Woo Kim1, Jung Tak Park1, Tae-Hyun Yoo1, Shin-Wook Kang1, Jayoun Kim2, Soo Wan Kim3, Yeong Hoon Kim4, Su Ah Sung5, Kook-Hwan Oh6, Seung Hyeok Han1
 -
Diabetes & Metabolism Journal 2023;47(4):535-546.
DOI: https://doi.org/10.4093/dmj.2022.0112
Published online: April 25, 2023
1Department of Internal Medicine, Institute of Kidney Disease Research, Yonsei University College of Medicine, Seoul, Korea
2Medical Research Collaborating Center, Seoul National University Hospital, Seoul National University College of Medicine, Seoul, Korea
3Department of Internal Medicine, Chonnam National University Medical School, Gwangju, Korea
4Department of Internal Medicine, Inje University Busan Paik Hospital, Busan, Korea
5Department of Internal Medicine, Nowon Eulji Medical Center, Eulji University School of Medicine, Seoul, Korea
6Department of Internal Medicine, Seoul National University Hospital, Seoul, Korea
-
Corresponding author: Seung Hyeok Han Department of Internal Medicine, Institute of Kidney Disease Research, Yonsei University College of Medicine, 50-1 Yonsei-ro, Seodaemun-gu, Seoul 03722, Korea E-mail: hansh@yuhs.ac
Copyright © 2023 Korean Diabetes Association
This is an Open Access article distributed under the terms of the Creative Commons Attribution Non-Commercial License (http://creativecommons.org/licenses/by-nc/4.0/) which permits unrestricted non-commercial use, distribution, and reproduction in any medium, provided the original work is properly cited.
ABSTRACT
-
Background
- The optimal level of glycosylated hemoglobin (HbA1c) to prevent adverse clinical outcomes is unknown in patients with chronic kidney disease (CKD) and type 2 diabetes mellitus (T2DM).
-
Methods
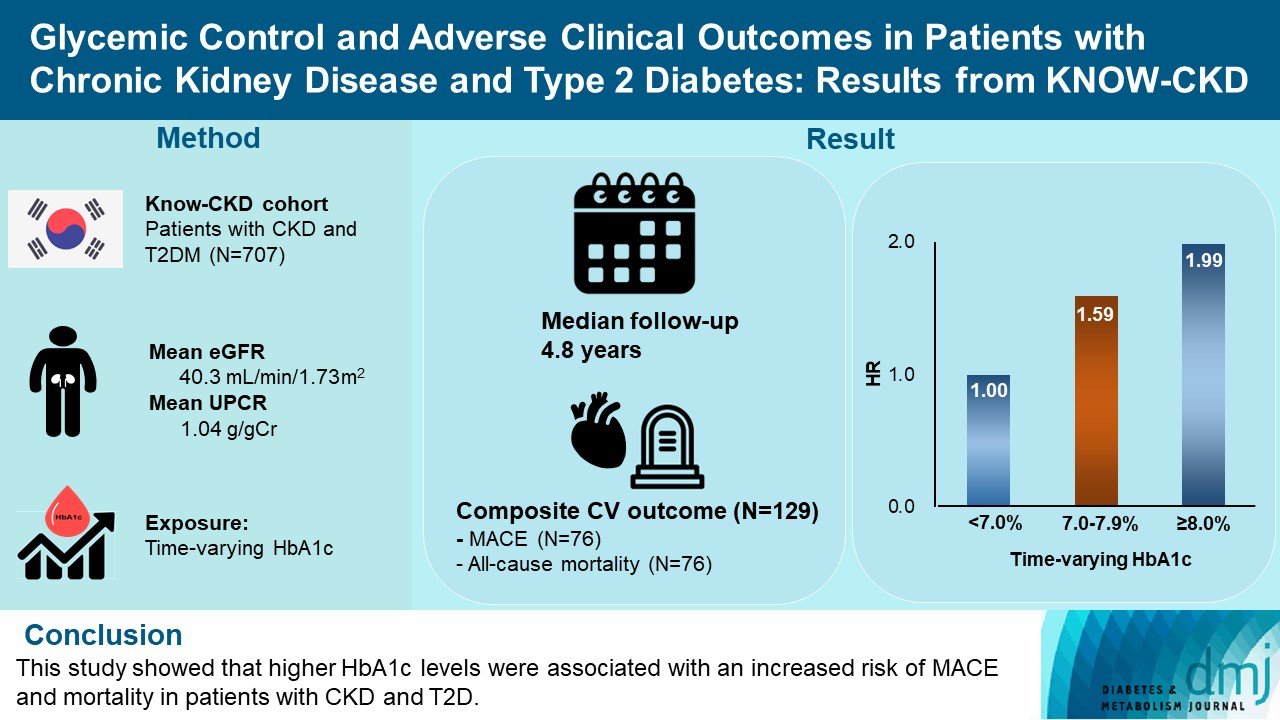
- We analyzed 707 patients with CKD G1-G5 without kidney replacement therapy and T2DM from the KoreaN Cohort Study for Outcome in Patients With Chronic Kidney Disease (KNOW-CKD), a nationwide prospective cohort study. The main predictor was time-varying HbA1c level at each visit. The primary outcome was a composite of development of major adverse cardiovascular events (MACEs) or all-cause mortality. Secondary outcomes included the individual endpoint of MACEs, all-cause mortality, and CKD progression. CKD progression was defined as a ≥50% decline in the estimated glomerular filtration rate from baseline or the onset of end-stage kidney disease.
-
Results
- During a median follow-up of 4.8 years, the primary outcome occurred in 129 (18.2%) patients. In time-varying Cox model, the adjusted hazard ratios (aHRs) for the primary outcome were 1.59 (95% confidence interval [CI], 1.01 to 2.49) and 1.99 (95% CI, 1.24 to 3.19) for HbA1c levels of 7.0%–7.9% and ≥8.0%, respectively, compared with <7.0%. Additional analysis of baseline HbA1c levels yielded a similar graded association. In secondary outcome analyses, the aHRs for the corresponding HbA1c categories were 2.17 (95% CI, 1.20 to 3.95) and 2.26 (95% CI, 1.17 to 4.37) for MACE, and 1.36 (95% CI, 0.68 to 2.72) and 2.08 (95% CI, 1.06 to 4.05) for all-cause mortality. However, the risk of CKD progression did not differ between the three groups.
-
Conclusion
- This study showed that higher HbA1c levels were associated with an increased risk of MACE and mortality in patients with CKD and T2DM.
- Type 2 diabetes mellitus (T2DM) is a common disease with an increasing prevalence worldwide, accounting for 90% of all cases of diabetes mellitus [1,2]. If hyperglycemia is not properly controlled, it can cause various vascular complications, leading to retinopathy, nephropathy, cardiovascular events, or even death [3-8]. Therefore, glycemic control is important to prevent adverse clinical outcomes in patients with T2DM.
- There have been several major clinical trials to prove clinical benefits of intensive glycemic control. In the United Kingdom Prospective Diabetes Study (UKPDS), a landmark trial that tested the effects of glycemic control among patients with T2DM, there was no significant difference in macrovascular complications, such as cardiovascular disease and cardiac death, between the intensive and conventional control groups [9]. The effects of intensive glycemic control on major cardiovascular outcomes were further tested in three randomized controlled trials: Action in Diabetes and Vascular Disease: Preterax and Diamicron Modified Release Controlled Evaluation (ADVANCE) trial [10], Action to Control Cardiovascular Risk in Diabetes (ACCORD) trial [11], and Veterans Affairs Diabetes Trial (VADT) [12]. However, none of these trials demonstrated the significant benefit of intensive control. Interestingly, a long-term follow-up study of the UKPDS showed that there were fewer overall deaths, diabetes-related deaths, and myocardial infarction in the intensive group, suggesting the clinical benefits of intensive glycemic control on macrovascular disease [13].
- In patients with chronic kidney disease (CKD) and T2DM, the optimal level of glycosylated hemoglobin (HbA1c) to prevent adverse clinical outcomes is unknown. All trials mentioned above included patients with CKD G3 and few patients had an estimated glomerular filtration rate (eGFR) of <45 mL/min/1.73 m2. This issue has been reported in several observational studies. Previously, two studies in North America reported a U-shaped association between HbA1c levels and all-cause mortality in individuals with CKD and diabetes, where the lowest risk was observed for HbA1c of approximately 7.0% [14,15]. Despite uncertain evidence on the optimal level of HbA1c in these patients, the recently updated Kidney Disease: Improving Global Outcomes (KDIGO) guideline recommends a broad range of HbA1c targets from <6.5% to <8.0% in patients with diabetes and CKD without kidney replacement therapy (KRT) [16]. The panels also state that this glycemic goal should be individualized according to clinical conditions, and a lower HbA1c target (e.g., <6.5%) may be acceptable in patients with a long-life expectancy, few comorbidities, absent or minor macrovascular complications, and those aware of hypoglycemic symptoms.
- With this background, this study aimed to examine the association between HbA1c levels and major adverse clinical outcomes, including cardiovascular events, all-cause mortality, and CKD progression among Korean patients with CKD and T2DM.
INTRODUCTION
- Study population
- The KoreaN Cohort Study for Outcome in Patients With Chronic Kidney Disease (KNOW-CKD) is a nationwide prospective cohort study from nine tertiary centers in Korea (NCT0-1630-486, http://www.clinicaltrials.gov). KNOW-CKD recruited patients aged 20 to 75 who had CKD G1–G5 without KRT from 2011 until 2016. The detailed design and methods of KNOW-CKD have been previously published [17]. Among the 2,238 participants, 744 had T2DM. We excluded 37 patients whose baseline levels of HbA1c were unavailable. Therefore, 707 patients were included in the final analysis. The study was conducted following the Helsinki Declaration, and the research protocol was approved by the Institutional Review Board at each participating center (IRB approval number of Yonsei University Severance Hospital: 4-2011-0163). Written informed consent was obtained from all participants.
- Data collection and measurements
- Socio-demographic information and medical history, such as age, sex, smoking status, drug history, and detailed personal and family medical history, were evaluated at enrollment. Hypertension was defined as self-reported hypertension, systolic blood pressure ≥140 mm Hg, diastolic blood pressure ≥90 mm Hg, or current use of antihypertensive drugs. Diabetes mellitus was defined as a history of diabetes mellitus, fasting glucose ≥126 mg/dL, or the prescribed use of glucose-lowering drugs. Body mass index (BMI) was calculated by body weight divided by the square of height. The Charlson comorbidity index was used to assess comorbid conditions.
- Serum and urine samples were collected after overnight fasting at baseline and 6 months, and annually thereafter, according to the study protocol. The following laboratory variables were measured, hemoglobin, creatinine, total cholesterol, high-density lipoprotein cholesterol, low-density lipoprotein cholesterol (LDL-C), triglycerides, albumin, ferritin and high-sensitive C-reactive protein (hs-CRP). Serum HbA1c concentrations were routinely measured using high-performance liquid chromatography (HPLC) at each visit. Serum creatinine was measured using the isotope dilution mass spectrometry-traceable method, and eGFR was calculated using the Chronic Kidney Disease Epidemiology Collaboration (CKD-EPI) creatinine equation [18,19]. Urinary protein excretion was determined using the urinary protein-to-creatinine ratio (UPCR; g/g).
- The main exposure of interest and study outcomes
- The patients were followed up from enrollment to March 2020. The primary exposure of interest was time-updated and baseline HbA1c levels. Patients were classified into the following three groups according to HbA1c levels of <7.0%, 7.0%–7.9%, and ≥8.0%. We employed these cut-off values, which have been tested in previous clinical trials with aim to find clinical benefits associated with intensive glycemic control [9,10,12]. Additionally, HbA1c per 1.0% increase was used for the analysis, in which HbA1c was treated as a continuous variable.
- The primary endpoint was a composite of major adverse cardiovascular events (MACEs) or all-cause mortality. MACE was defined as nonfatal myocardial infarction, unstable angina, percutaneous coronary intervention, coronary artery bypass graft, nonfatal stroke, and cardiac death [20]. Secondary endpoints included individual outcomes of MACEs, all-cause mortality, and CKD progression. CKD progression was defined as a ≥50% decline in eGFR from baseline or the onset of end-stage kidney disease (ESKD) that required dialysis or transplantation.
- Statistical analysis
- The baseline characteristics of the study population were described according to three categories of HbA1c level. Continuous variables were expressed as mean±standard deviation or medians with interquartile ranges for skewed data and compared using one-way analysis of variance. Categorical variables were expressed as numbers and proportions and analyzed by chi-square test. To explore the association between HbA1c levels and the risk of adverse outcomes, a time-varying Cox proportional hazards model was used for the primary analysis. In this analysis, all repeated measures, such as HbA1c, systolic blood pressure, BMI, serum albumin, eGFR, and drugs, were considered as time-varying exposures. Furthermore, we performed a conventional Cox proportional hazards regression model using baseline HbA1c levels. The adjusted model includes variables that showed statistical significance in the unadjusted model and well-known risk factors for cardiovascular events. The proportional hazard assumptions were confirmed using Schoenfeld residuals. Model 1 was adjusted for age, sex, BMI, systolic blood pressure, socioeconomic status, smoking status and Charlson comorbidity index. Model 2 further included the use of medications (renin-angiotensin-aldosterone system inhibitors and statins) and laboratory parameters (serum albumin, LDL-C, eGFR, and UPCR). The results of the hazard models were presented as hazard ratios (HRs) and 95% confidence intervals (CIs). Kaplan-Meier curve analyses for the cumulative incidence of the study outcomes were used to derive the incidence rates, and differences between the groups were compared by the log-rank test. Survival time was defined as the time interval between enrollment and the first onset of clinical outcomes. Patients lost to follow-up were censored on the date of the last examination. Adjusted restricted cubic splines with 3 knots were used to reveal the relationship between HbA1c levels and the risk of mortality. For the secondary analysis of MACE and CKD progression, a cause-specific hazard function for competing risk model was used. In this analysis, non-cardiac deaths that occurred before MACE and death that occurred before kidney outcome were treated as a competing risk and censored. Cumulative incidence function was used for the cumulative renal outcome curve and were compared using Gray’s test. The rate of kidney function decline per year was determined by the slope of eGFR obtained from a generalized linear mixed model. We additionally examined the effect modification among prespecified subgroups by age (<60 or ≥60 years), sex (male or female), BMI (<25 or ≥25 kg/m2), previous cardiovascular disease (yes or no), eGFR (<45 or ≥45 mL/min/1.73 m2), hs-CRP (<1 or ≥1 mg/L), and serum albumin (<4.0 or ≥4.0 g/dL). Statistical significance was defined as P<0.05, and all analyses were performed with Stata version 14.2 (Stata Corporation, College Station, TX, USA).
METHODS
- Baseline characteristics
- Demographic, clinical and laboratory details of participants according to HbA1c categories are presented in Table 1. The mean age was 59 years and 478 (67.6%) were men. The mean baseline eGFR was 40.3 mL/min/1.73 m2 and the median proteinuria was 1.04 g/g. A histogram showing the distribution of HbA1c levels is presented in Supplementary Fig. 1. The mean and median HbA1c levels of all patients were 7.2% and 6.9%, respectively. The mean HbA1c levels of each group were 6.2%, 7.4%, and 9.1%, and the median levels were 6.3%, 7.3%, and 8.7%, respectively (Table 1).
- Overall, there were no significant differences in age, Charlson comorbidity index, eGFR, and serum levels of albumin, LDL-C, ferritin, and hs-CRP. Patients with higher HbA1c levels were more likely to be women and current smokers, and those with higher levels of urinary protein excretion, and total serum cholesterol and triglycerides. Most patients were treated with renin-angiotensin-aldosterone system inhibitors (87%), with no difference in the use of this drug among the three groups. However, diuretics were used more frequently in patients with higher HbA1c levels. There was no difference in the use of oral antidiabetic medication among the three HbA1c categories. Not surprisingly, patients with uncontrolled glycemic control undertook insulin therapy more frequently (Supplementary Fig. 2).
- Primary outcome analysis
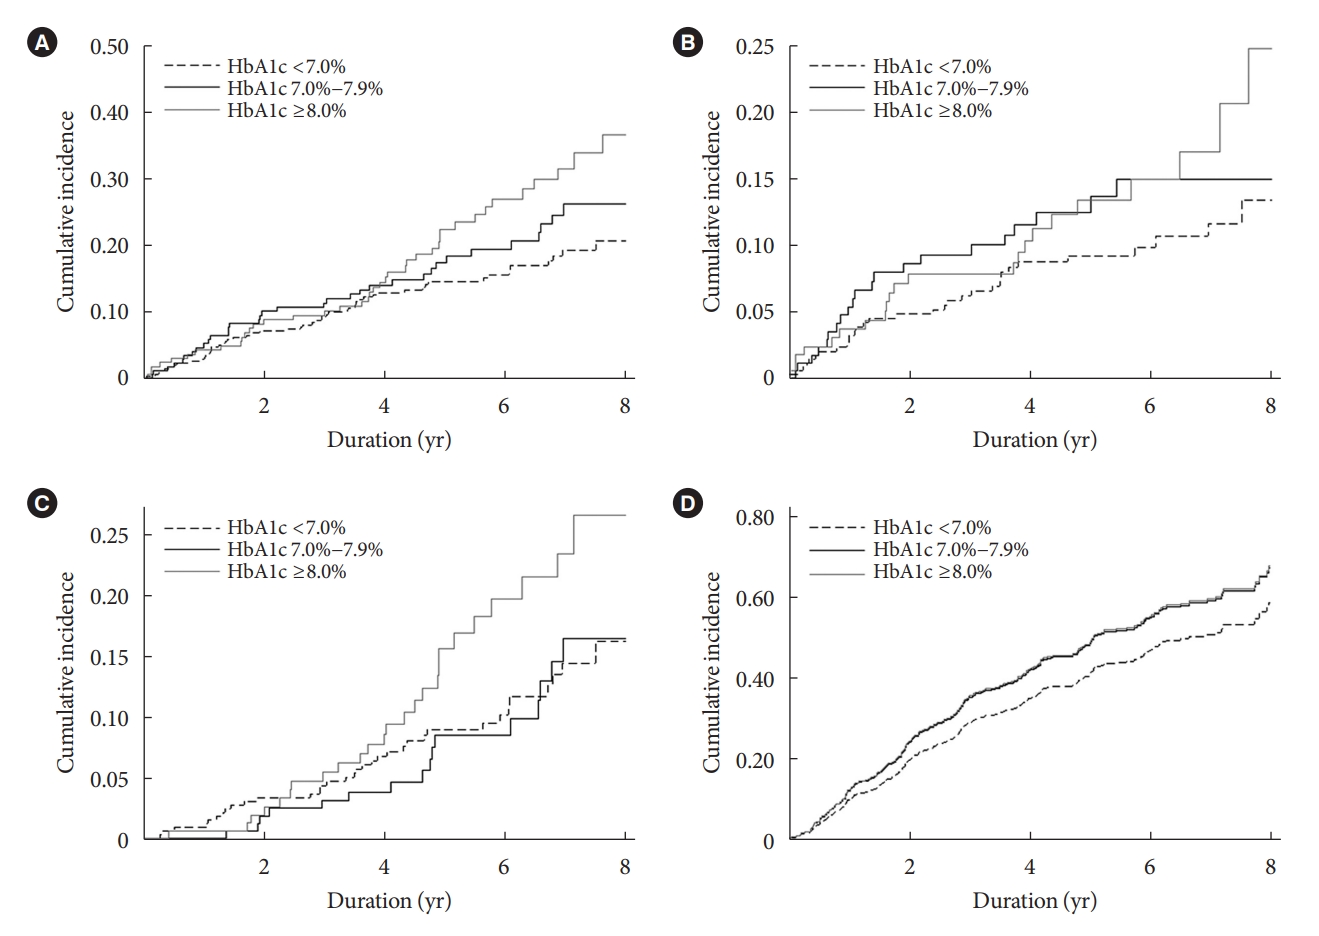
- During 3,358 person-years of follow-up, a total of 129 composite outcome events occurred (incidence rate, 3.78 per 100 person-years). The incidence rates of the composite outcome were significantly higher in patients with HbA1c levels of 7.0%–7.9% (3.98 per 100 person-years) and ≥8.0% (5.04 per 100 person-years) than in those with HbA1c levels of <7.0% (3.12 per 100 person-years) (Table 2). The Kaplan-Meier curve for the primary outcome also showed that the events were significantly higher in patients with higher HbA1c categories (Fig. 1A). In the time-varying Cox model, the adjusted hazard ratios (aHRs) for HbA1c levels of 7.0%–7.9% and ≥8.0% were 1.59 (95% CI, 1.01 to 2.49) and 1.99 (95% CI, 1.24 to 3.19), respectively, compared with HbA1c level of <7.0% (Table 3). In an additional analysis treating HbA1c as a continuous variable, the aHR per a 1.0% increase in HbA1c level was 1.17 (95% CI, 1.03 to 1.32) (Table 3). This association was similar to the baseline HbA1c-based model. The corresponding aHRs (95% CIs) for each HbA1c categories were 1.29 (95% CI, 0.82 to 2.04) and 2.03 (95% CI, 1.31 to 3.13), respectively (Supplementary Table 1). The continuous model also showed that a 1.0% increase in HbA1c was associated with 1.17-fold (95% CI, 1.03 to 1.33) higher risk of the primary outcome (Supplementary Table 1).
- Secondary outcome analysis
- We also studied secondary outcomes for separate associations of HbA1c levels with the risk of MACE, all-cause mortality, and CKD progression. Consistent with the composite outcome events, there were graded increases in the individual incidence rates of MACE and all-cause mortality across the three HbA1c categories (Table 2). We also observed similar findings in the Kaplan-Meier curve analyses (Fig. 1B and C). In the analysis with MACE, the time-varying Cox model showed that HbA1c levels of 7.0%–7.9% and ≥8.0% were associated with a 2.17-fold (95% CI, 1.20 to 3.95) and 2.26-fold (95% CI, 1.17 to 4.37), respectively, higher risk of this outcome than HbA1c level of <7.0% (Table 4). Furthermore, the aHRs for all-cause mortality were 1.36 (95% CI, 0.68 to 2.72) and 2.08 (95% CI, 1.06 to 4.05) for the corresponding HbA1c categories. When HbA1c was used as a continuous variable, the HRs per a 1.0% increase in HbA1c level were 1.17 (95% CI, 0.98 to 1.40) and 1.23 (95% CI, 1.04 to 1.46) for MACE and all-cause mortality, respectively (Table 4). Similar trends were also observed in the analysis of baseline HbA1c levels (Supplementary Table 1). As previous studies showed a U-shaped association between HbA1c levels and mortality [14,15], we further examined this association by restricted cubic spline curve analysis. However, the results showed a relatively linear relationship between HbA1c levels and risk of mortality (Supplementary Fig. 3).
- In contrast to the results above, there were no differences in the risk of adverse kidney outcomes among the three HbA1c categories. This association was consistent in both the timevarying and baseline Cox models (Table 4, Supplementary Table 1). In an additional analysis considering HbA1c as a continuous variable, a 1.0% increase in HbA1c level was not associated with CKD progression (Table 4). The cumulative incidence curve analyses confirmed this finding (Fig. 1D). We further evaluated if this association might differ by CKD severity because clinical benefits of intensive glycemic control with respect to adverse kidney outcome was observed in previous trials, in which patients with CKD G3 or greater were not included. Notably, for eGFR of ≥45mL/min/1.73m2, patients with higher HbA1c levels showed greater decline rate of eGFR in generalized linear mixed models (Supplementary Table 2).
- Sensitivity analysis
- To validate our findings, we performed a sensitivity analysis in the tertile group of HbA1c levels. In line with the primary analysis, there was a graded association between HbA1c levels and the risk of the primary outcome. In the time-varying model, the aHRs for the middle and highest tertiles of HbA1c levels. were 1.25 (95% CI, 0.77 to 2.00) and 1.90 (95% CI, 1.19 to 3.05), respectively, compared with the lowest tertile. The corresponding HRs in the baseline Cox model were 1.51 (95% CI, 0.94 to 2.43) and 2.07 (95% CI, 1.29 to 3.33) (Supplementary Table 3).
- Subgroup analysis
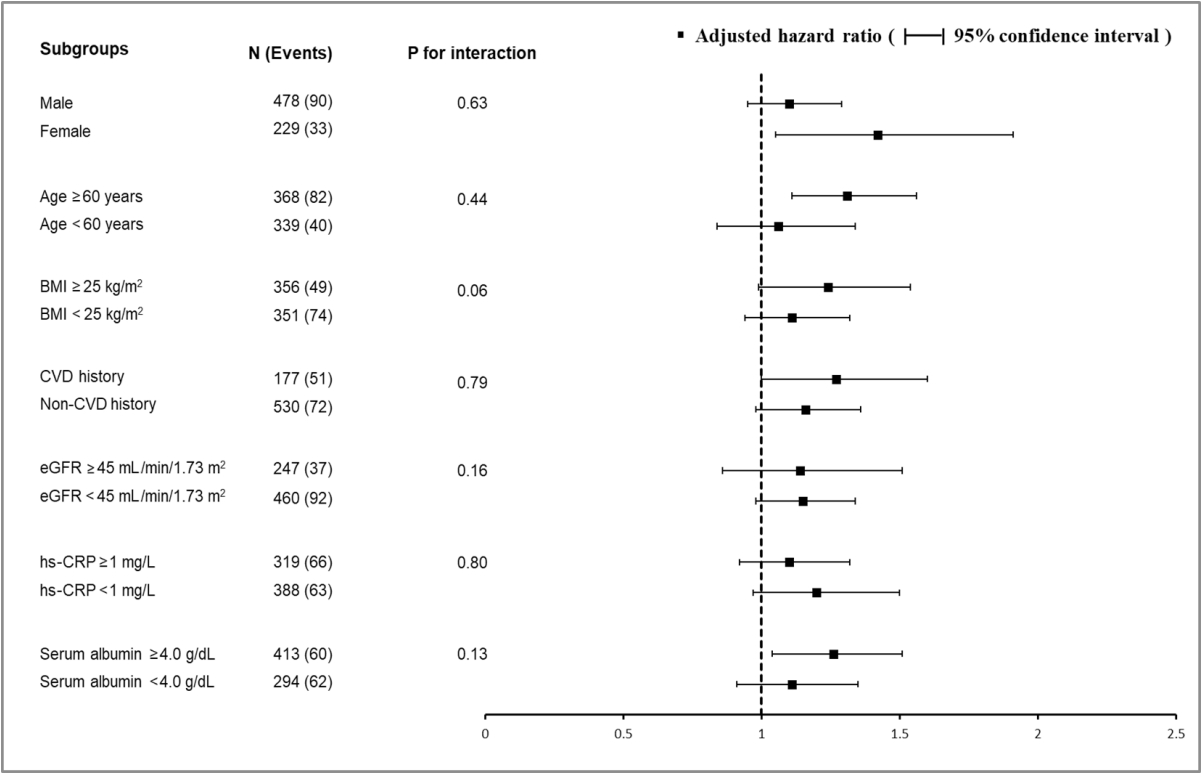
- Finally, we tested the effect of interactions between baseline HbA1c levels and prespecified subgroups by age, sex, BMI, prior cardiovascular disease, baseline eGFR, hs-CRP, and serum albumin level on the risk of the composite outcome. None of the subgroup factors was statistically significant, suggesting that the association of higher HbA1c levels with a higher risk of primary outcome existed in all subgroups (Fig. 2).
RESULTS
- In this prospective study involving 707 patients with CKD and T2DM, we observed that higher HbA1c levels were associated with a significantly higher risk of the composite outcome of MACE or all-cause mortality. This association was consistent in both the time-varying and baseline Cox models. There was no effect modification in this relationship by several key subgroups. In the secondary outcome analyses, the association was statistically significant for separate outcomes of MACE and all-cause mortality, but HbA1c levels were not associated with the risk of CKD progression. Given the absence of randomized controlled trials to test the effect of lowering HbA1c levels, particularly, in patients with CKD and T2DM, our findings suggest clinical implications with respect to glycemic control in these patients.
- T2DM is a common cause of CKD and is associated with increased cardiovascular risk [21,22]. The ultimate goal of glycemic control in patients with or without kidney failure is to prevent major diabetes-related vascular complications. However, previous studies on this issue do not show salutary results. In early reports from the Diabetes Control and Complications (DCCT) study in patients with type 1 diabetes mellitus and UKPDS in patients with T2DM, intensive glucose control failed to reduce cardiovascular events and mortality [9,13,23]. In contrast, the long-term observation of both studies after the completion of the intervention has suggested the clinical benefits of intensive glucose control. In the UKPDS T2DM cohort, a 10-year postintervention follow-up showed that there were fewer microvascular complications, such as kidney failure, as well as a lower incidence of myocardial infarction and overall death in the intensive glucose control group with a target HbA1c level of 7.0% compared to the conventional control group with an HbA1c level of 7.9% [24]. In line with this finding, an 11-year observation of the DCCT study also showed similar results [25]. The effects of more intensive glycemic control with an HbA1c target of 6.0%–6.5% on major cardiovascular outcomes were further tested by ADVANCE trial [10], ACCORD trial [11], and VADT [12]. However, these trials did not demonstrate significant cardiovascular benefits with intensive glycemic control. In addition, there was a concern regarding under-power due to fewer reports of adverse events than anticipated in ADVANCE and VADT and the early termination of ACCORD [10-12,26]. Notably, in the ACCORD trial, intensive control resulted in 22% and 35% higher risk of death and cardiac death, respectively, compared with conventional control and a similar trend was observed for mild and moderate CKD (G1–G3) [27]. However, many of these trials showed a lower occurrence of microvascular complications in the intensive control group. Therefore, this benefit should be weighed against unexpected events, such as increased mortality and frequent hypoglycemia.
- In patients with ESKD receiving dialysis therapy, glycemic control aims to prevent cardiovascular events and reduce mortality. However, intensive glycemic control in these patients contributes little to improved outcomes. Previous observational studies have shown that poor glycemic control is not associated with a higher risk of mortality or is weakly associated with an increased risk of cardiovascular disease [28-30]. It can be presumed that intensive control may no longer provide clinical cardiovascular benefits given the severely damaged vascular systems in these patients. To date, there have been no randomized controlled trials on the effects of intensive glycemic control in patients with CKD G1–G5 without KRT. In this regard, the findings of a previous Canadian cohort study are intriguing because this study analyzed the relationship between glycemic control and adverse outcomes including mortality, cardiovascular events, and ESKD in patients with CKD G3–G4 [14]. They found that higher HbA1c levels were independently associated with an increased risk of adverse outcomes. Notably, the risk of myocardial infarction and stroke appeared to increase in patients with HbA1c levels of ≥7.0% compared to those with HbA1c levels of <7.0%. We observed similar findings in our study. Interestingly, all participants in our cohort had a mean eGFR of 40.4 mL/min/1.73 m2 compared with 47 mL/min/1.73 m2 in the Canadian cohort, while both cohorts had a median HbA1c level of 6.9%. Therefore, all of these findings suggest that intensive glycemic control may be necessary to improve cardiovascular outcomes even in patients with CKD G3 or greater.
- In contrast to the significant association of HbA1c levels with adverse cardiovascular event, we found that HbA1c levels were not associated with the risk of kidney outcomes. This finding aligns with several previous studies that did not show a significant association between glycemic control and CKD progression in patients with CKD [31-33]. In particular, an observational United States study by Navaneethan et al. [15] used the same analytical approach with a competing risk model as our study and showed no significant relationship between HbA1c levels and the risk of ESKD. However, in the Canadian cohort study mentioned above [14] and a Taiwanese cohort of adults with T2DM [34], patients with higher HbA1c levels were more likely to progress to ESKD. Moreover, in Korean patients with T2DM and CKD G1–G3, risk of ESKD development was higher in patients with HbA1c levels of 6.50%–7.49% and ≥7.50% compared with those with HbA1c level of <6.50% [35]. It should be noted that our cohort and the US study included more than 30% of patients with eGFR <45 mL/min/1.73 m2, while most patients had CKD G3 or greater in the Canadian, Taiwanese, and previous Korean cohort studies. Interestingly, in a Canadian cohort study, a significant association was observed between poor glycemic control and increased risk of ESKD only in patients with CKD G3. In agreement with this result, we showed faster decline in eGFR in higher HbA1c categories among patients with eGFR ≥45 mL/min/1.73 m2. These findings suggest that early intervention with strict glucose control may be beneficial in delaying CKD progression before reaching more advanced kidney failure.
- This study has several limitations. First, because this was an observational study, potential uncontrolled confounding factors were not considered. To mitigate bias, we used various analytic methods using both time-varying and baseline Cox models and performed a sensitivity analysis with different cut-off values of HbA1c levels. Nevertheless, our findings should be interpreted with caution because we did not provide intervention to lower HbA1c levels. Second, HbA1c level was measured in the local laboratory rather than in the central laboratory. There are several methods for the determination of HbA1c levels such as HPLC, immunoassay, and enzymatic methods. This may raise concerns about bias in measuring HbA1c levels. However, all laboratories in each participating center used the same HPLC for the measurements in our study. Although HPLC is expensive and requires regular maintenance, it is a rapid, automated, and highly precise method, that delivers high resolution compared to other techniques [36]. Third, the sample size of our cohort was insufficient for further detailed analyses. For example, contrary to previous studies that showed a U-shaped association between HbA1c levels and mortality [14,15], we only observed incremental mortality associated with higher HbA1c levels. Patients with extremely low levels of HbA1c can be interpreted as “well-controlled” or “severely ill.” This issue should be studied considering malnutrition and inflammation. In our study, the levels of markers of malnutrition and inflammation, such as BMI, serum albumin, and hs-CRP, did not differ between the HbA1c categories at baseline. Furthermore, in the subgroup analysis, serum albumin and hs-CRP did not modify the relationship between HbA1c levels and the risk of the primary outcome. However, we could not exclude the possibility that there were fewer “seriously ill” patients in our cohort. Fourth, our cohort data did not include information on hypoglycemic episodes that could affect glycemic control and increase the mortality risk. In fact, hypoglycemia is a major obstacle to intensive glycemic control and severe hypoglycemia was more common in the intensive control arm in ACCORD and ADVANCE studies [10,11]. Fifth, detailed analyses of anti-diabetic medications were also limited by the small sample size. We could not include information on sodium glucose co-transporter 2 inhibitors (SGLT2is) because SGLT2is were unavailable when KNOW-CKD started in 2011. This drug has been used since 2014, and its prescription rate has risen to 4.4% in 2019 among patients with T2DM in Korea [37]. KNOW-CKD has recently decided to recruit more patients with T2DM until 2026. We hope to analyze the benefits of SGLT2i in our cohort in the future. Finally, since burden of environmental exposures, social factors, and chronic disease vary greatly between different countries, our findings may not be generalizable to other populations.
- In conclusion, we showed that higher HbA1c levels were associated with increased risk of MACEs and mortality in Korean patients with CKD and T2DM. However, this association was not observed for kidney outcomes. Given the lack of evidence on the clinical benefits of intensive glycemic control in patients with CKD, large and well-designed randomized controlled trials are needed to clarify these unresolved issues.
DISCUSSION
SUPPLEMENTARY MATERIALS
Supplementary Table 1.
Supplementary Table 2.
Supplementary Table 3.
Supplementary Fig. 1.
Supplementary Fig. 2.
Supplementary Fig. 3.
-
CONFLICTS OF INTEREST
No potential conflict of interest relevant to this article was reported.
-
AUTHOR CONTRIBUTIONS
Conception or design: G.Y.H., S.H.H.
Acquisition, analysis, or interpretation of data: G.Y.H., S.H.H.
Drafting the work or revising: G.Y.H., S.H.H.
Final approval of the manuscript: G.Y.H., H.B.K., H.W.K., J. T.P., T.H.Y., S.W.K., J.K., S.W.K., Y.H.K., S.A.S., K.H.O., S.H.H.
-
FUNDING
This work was supported by Research Program funded by the Korea Centers for Disease Control and Prevention grants 2011-E3300300, 2012E3301100, 2013E3301600, 2013E3301601, 2013E3301602, 2016E3300200, 2016E3300201, 2016E3300-202, 2019E320100, 2019E320101, 2019E320102, and 2022-11-007. Funding sources had no role in the design and conduct of study; collection, management, analysis, and interpretation of the data; preparation, review, or approval of the manuscript; and decision to submit the manuscript for publication.
NOTES
-
Acknowledgements
- The authors thank all of the KNOW-CKD investigators.

Values are presented as mean±standard deviation, number (%), or median (interquartile range). eGFR was calculated using the Chronic Kidney Disease–Epidemiology Collaboration equation.
HbA1c, glycosylated hemoglobin; BMI, body mass index; SBP, systolic blood pressure; DBP, diastolic blood pressure; CCI, Charlson comorbidity index; RAAS, renin angiotensin aldosterone system; CCB, calcium channel blocker; BB, beta blocker; eGFR, estimated glomerular filtration rate; UPCR, urine protein/creatinine ratio; LDL-C, low-density lipoprotein cholesterol; HDL-C, high-density lipoprotein cholesterol; hs-CRP, high sensitive C-reactive protein.
| Variable | Total |
HbA1c categories |
||
|---|---|---|---|---|
| <7.0% | 7.0%–7.9% | ≥8.0% | ||
| No. of participants | 707 | 357 | 178 | 172 |
| Person-year | 3,358 | 1,727 | 843 | 787 |
| Primary composite outcomea | ||||
| Events, | 129 (18.2) | 55 (15.4) | 34 (19.2) | 40 (23.2) |
| Events, /100 person-yr | 3.78 | 3.12 | 3.98 | 5.04 |
| All-cause mortality | ||||
| Events | 76 (10.7) | 35 (9.8) | 16 (9.1) | 25 (14.5) |
| Events, /100 person-yr | 2.10 | 1.90 | 1.73 | 2.90 |
| MACEb | ||||
| Events | 76 (10.7) | 33 (9.2) | 21 (11.8) | 22 (12.7) |
| Events, /100 person-yr | 2.23 | 1.87 | 2.46 | 2.77 |
| Renal outcomec | ||||
| Events | 325 (45.9) | 150 (42.0) | 91 (51.4) | 84 (48.8) |
| Events, /100 person-yr | 12.24 | 10.84 | 13.40 | 14.17 |
Values are presented as number (%).
HbA1c, glycosylated hemoglobin; M ACE, major cardiovascular events.
a Primary composite outcome included MACE, cardiac death or all-cause death, whichever came first,
b MACE included nonfatal myocardial infarction, unstable angina, percutaneous coronary intervention, coronary artery bypass graft, nonfatal stroke, and cardiac death,
c Renal outcome included a ≥50% decline in estimated glomerular filtration rate or the onset of end-stage kidney disease, whichever came first.
Model 1: Adjusted for age, sex, body mass index, Charlson comorbidity index, socioeconomic status, smoking status and systolic blood pressure; Model 2: Model 1+estimated glomerular filtration rate, urine protein/creatinine ratio, low-density lipoprotein cholesterol, albumin, renin angiotensin aldosterone system inhibitors, and statins.
HbA1c, glycosylated hemoglobin; HR, hazard ratio; CI, confidence interval.
a Primary composite outcome included major adverse cardiovascular events, cardiac death or all-cause death, whichever came first.
| HbA1c |
Model 1 |
Model 2 |
||||
|---|---|---|---|---|---|---|
| HR (95% CI) | P value | HR (95% CI) | P value | |||
| All-cause mortality | ||||||
| Categorical model | ||||||
| <7.0% | Reference | Reference | ||||
| 7.0%–7.9% | 1.23 (0.69–2.21) | 0.48 | 1.36 (0.68–2.72) | 0.37 | ||
| ≥8.0% | 1.64 (0.91–2.92) | 0.09 | 2.08 (1.06–4.05) | 0.03 | ||
| Continuous model | ||||||
| Per 1.0% increase | 1.15 (0.97–1.35) | 0.09 | 1.23 (1.04–1.46) | 0.01 | ||
| MACEa | ||||||
| Categorical model | ||||||
| <7.0% | Reference | Reference | ||||
| 7.0%–7.9% | 1.91 (1.01–3.60) | 0.04 | 2.17 (1.20–3.95) | 0.01 | ||
| ≥8.0% | 2.26 (1.27–4.02) | <0.01 | 2.26 (1.17–4.37) | 0.01 | ||
| Continuous model | ||||||
| Per 1.0% increase | 1.14 (0.95–1.35) | 0.16 | 1.17 (0.98–1.40) | 0.08 | ||
| Renal outcomeb | ||||||
| Categorical model | ||||||
| <7.0% | Reference | Reference | ||||
| 7.0%–7.9% | 0.91 (0.70–1.19) | 0.48 | 0.96 (0.70–1.31) | 0.79 | ||
| ≥8.0% | 0.91 (0.67–1.23) | 0.53 | 1.14 (0.82–1.59) | 0.43 | ||
| Continuous model | ||||||
| Per 1.0% increase | 0.97 (0.88–1.04) | 0.51 | 1.05 (0.95–1.16) | 0.29 | ||
Model 1: Adjusted for age, sex, body mass index, Charlson comorbidity index, socioeconomic status, smoking status and systolic blood pressure; Model 2: Model 1+estimated glomerular filtration rate (eGFR), urine protein/creatinine ratio, low-density lipoprotein cholesterol, albumin, renin angiotensin aldosterone system inhibitors and statins.
HbA1c, glycosylated hemoglobin; HR, hazard ratio; CI, confidence interval; MACE, major adverse cardiovascular events.
a MACE included nonfatal myocardial infarction, unstable angina, percutaneous coronary intervention, coronary artery bypass graft, nonfatal stroke, and cardiac death,
b Renal outcome included a ≥50% decline in eGFR or the onset of end-stage kidney disease, whichever came first.
- 1. Centers for Disease Control and Prevention: National diabetes statistics report, 2020 : estimates of diabetes and its burden in the United States. Available from: https://www.cdc.gov/diabetes/pdfs/data/statistics/national-diabetes-statistics-report.pdf (updated 2022 Mar 28).
- 2. Saeedi P, Petersohn I, Salpea P, Malanda B, Karuranga S, Unwin N, et al. Global and regional diabetes prevalence estimates for 2019 and projections for 2030 and 2045: results from the International Diabetes Federation Diabetes Atlas, 9th edition. Diabetes Res Clin Pract 2019;157:107843.ArticlePubMed
- 3. Hammes HP. Diabetic retinopathy: hyperglycaemia, oxidative stress and beyond. Diabetologia 2018;61:29-38.ArticlePubMedPDF
- 4. Selvin E, Marinopoulos S, Berkenblit G, Rami T, Brancati FL, Powe NR, et al. Meta-analysis: glycosylated hemoglobin and cardiovascular disease in diabetes mellitus. Ann Intern Med 2004;141:421-31.ArticlePubMed
- 5. Ravid M, Brosh D, Ravid-Safran D, Levy Z, Rachmani R. Main risk factors for nephropathy in type 2 diabetes mellitus are plasma cholesterol levels, mean blood pressure, and hyperglycemia. Arch Intern Med 1998;158:998-1004.ArticlePubMed
- 6. Takao T, Takahashi K, Yoshida Y, Kushiyama A, Onishi Y, Tahara T, et al. Effect of postprandial hyperglycemia at clinic visits on the incidence of retinopathy in patients with type 2 diabetes: an analysis using real-world long-term follow-up data. J Diabetes Investig 2020;11:930-7.ArticlePubMedPMCPDF
- 7. Niskanen L, Turpeinen A, Penttila I, Uusitupa MI. Hyperglycemia and compositional lipoprotein abnormalities as predictors of cardiovascular mortality in type 2 diabetes: a 15-year follow-up from the time of diagnosis. Diabetes Care 1998;21:1861-9.ArticlePubMedPDF
- 8. Rhee SY, Kim YS. The role of advanced glycation end products in diabetic vascular complications. Diabetes Metab J 2018;42:188-95.ArticlePubMedPMCPDF
- 9. UK Prospective Diabetes Study (UKPDS) Group. Intensive blood-glucose control with sulphonylureas or insulin compared with conventional treatment and risk of complications in patients with type 2 diabetes (UKPDS 33). Lancet 1998;352:837-53.ArticlePubMed
- 10. ADVANCE Collaborative Group, Patel A, MacMahon S, Chalmers J, Neal B, Billot L, et al. Intensive blood glucose control and vascular outcomes in patients with type 2 diabetes. N Engl J Med 2008;358:2560-72.ArticlePubMed
- 11. Action to Control Cardiovascular Risk in Diabetes Study Group, Gerstein HC, Miller ME, Byington RP, Goff DC Jr, Bigger JT, et al. Effects of intensive glucose lowering in type 2 diabetes. N Engl J Med 2008;358:2545-59.ArticlePubMedPMC
- 12. Duckworth W, Abraira C, Moritz T, Reda D, Emanuele N, Reaven PD, et al. Glucose control and vascular complications in veterans with type 2 diabetes. N Engl J Med 2009;360:129-39.ArticlePubMed
- 13. Holman RR, Paul SK, Bethel MA, Matthews DR, Neil HA. 10-Year follow-up of intensive glucose control in type 2 diabetes. N Engl J Med 2008;359:1577-89.ArticlePubMed
- 14. Shurraw S, Hemmelgarn B, Lin M, Majumdar SR, Klarenbach S, Manns B, et al. Association between glycemic control and adverse outcomes in people with diabetes mellitus and chronic kidney disease: a population-based cohort study. Arch Intern Med 2011;171:1920-7.ArticlePubMed
- 15. Navaneethan SD, Schold JD, Jolly SE, Arrigain S, Winkelmayer WC, Nally JV Jr. Diabetes control and the risks of ESRD and mortality in patients with CKD. Am J Kidney Dis 2017;70:191-8.ArticlePubMedPMC
- 16. Navaneethan SD, Zoungas S, Caramori ML, Chan J, Heerspink H, Hurst C, et al. Diabetes management in chronic kidney disease: synopsis of the 2020 KDIGO clinical practice guideline. Ann Intern Med 2021;174:385-94.ArticlePubMed
- 17. Oh KH, Park SK, Park HC, Chin HJ, Chae DW, Choi KH, et al. KNOW-CKD (KoreaN cohort study for Outcome in patients With Chronic Kidney Disease): design and methods. BMC Nephrol 2014;15:80.ArticlePubMedPMCPDF
- 18. Siekmann L. Determination of creatinine in human serum by isotope dilution-mass spectrometry. Definitive methods in clinical chemistry, IV. J Clin Chem Clin Biochem 1985;23:137-44.ArticlePubMed
- 19. Levey AS, Stevens LA, Schmid CH, Zhang YL, Castro AF 3rd, Feldman HI, et al. A new equation to estimate glomerular filtration rate. Ann Intern Med 2009;150:604-12.ArticlePubMedPMC
- 20. Marx N, McGuire DK, Perkovic V, Woerle HJ, Broedl UC, von Eynatten M, et al. Composite primary end points in cardiovascular outcomes trials involving type 2 diabetes patients: should unstable angina be included in the primary end point? Diabetes Care 2017;40:1144-51.ArticlePubMedPDF
- 21. Lee WC, Lee YT, Li LC, Ng HY, Kuo WH, Lin PT, et al. The number of comorbidities predicts renal outcomes in patients with stage 3-5 chronic kidney disease. J Clin Med 2018;7:493.ArticlePubMedPMC
- 22. Gerstein HC, Mann JF, Yi Q, Zinman B, Dinneen SF, Hoogwerf B, et al. Albuminuria and risk of cardiovascular events, death, and heart failure in diabetic and nondiabetic individuals. JAMA 2001;286:421-6.ArticlePubMed
- 23. Nathan DM. Long-term complications of diabetes mellitus. N Engl J Med 1993;328:1676-85.ArticlePubMed
- 24. The Diabetes Control and Complications (DCCT) Research Group. Effect of intensive therapy on the development and progression of diabetic nephropathy in the Diabetes Control and Complications Trial. Kidney Int 1995;47:1703-20.ArticlePubMed
- 25. Bebu I, Braffett BH, Pop-Busui R, Orchard TJ, Nathan DM, Lachin JM, et al. The relationship of blood glucose with cardiovascular disease is mediated over time by traditional risk factors in type 1 diabetes: the DCCT/EDIC study. Diabetologia 2017;60:2084-91.ArticlePubMedPMCPDF
- 26. Jun M, Ohkuma T, Zoungas S, Colagiuri S, Mancia G, Marre M, et al. Changes in albuminuria and the risk of major clinical outcomes in diabetes: results from ADVANCE-ON. Diabetes Care 2018;41:163-70.ArticlePubMedPDF
- 27. Papademetriou V, Lovato L, Doumas M, Nylen E, Mottl A, Cohen RM, et al. Chronic kidney disease and intensive glycemic control increase cardiovascular risk in patients with type 2 diabetes. Kidney Int 2015;87:649-59.ArticlePubMed
- 28. Shurraw S, Majumdar SR, Thadhani R, Wiebe N, Tonelli M; Alberta Kidney Disease Network. Glycemic control and the risk of death in 1,484 patients receiving maintenance hemodialysis. Am J Kidney Dis 2010;55:875-84.ArticlePubMed
- 29. Williams ME, Lacson E Jr, Wang W, Lazarus JM, Hakim R. Glycemic control and extended hemodialysis survival in patients with diabetes mellitus: comparative results of traditional and time-dependent Cox model analyses. Clin J Am Soc Nephrol 2010;5:1595-601.PubMedPMC
- 30. Okada T, Nakao T, Matsumoto H, Shino T, Nagaoka Y, Tomaru R, et al. Association between markers of glycemic control, cardiovascular complications and survival in type 2 diabetic patients with end-stage renal disease. Intern Med 2007;46:807-14.ArticlePubMed
- 31. Kuo IC, Lin HY, Niu SW, Hwang DY, Lee JJ, Tsai JC, et al. Glycated hemoglobin and outcomes in patients with advanced diabetic chronic kidney disease. Sci Rep 2016;6:20028.ArticlePubMedPMCPDF
- 32. Intensive therapy and progression to clinical albuminuria in patients with insulin dependent diabetes mellitus and microalbuminuria. Microalbuminuria Collaborative Study Group, United Kingdom. BMJ 1995;311:973-7.ArticlePubMedPMC
- 33. Kim YA, Lee Y, Seo JH. Renal complication and glycemic control in Korean veterans with type 2 diabetes: a 10-year retrospective cohort study. J Diabetes Res 2020;2020:9806790.ArticlePubMedPMCPDF
- 34. Liao LN, Li CI, Liu CS, Huang CC, Lin WY, Chiang JH, et al. Extreme levels of HbA1c increase incident ESRD risk in Chinese patients with type 2 diabetes: competing risk analysis in national cohort of Taiwan diabetes study. PLoS One 2015;10:e0130828.ArticlePubMedPMC
- 35. Oh SW, Kim YC, Koo HS, Jin DC, Na KY, Chae DW, et al. Glycated haemoglobin and the incidence of end-stage renal disease in diabetics. Nephrol Dial Transplant 2011;26:2238-44.ArticlePubMed
- 36. Davis JE, McDonald JM, Jarett L. A high-performance liquid chromatography method for hemoglobin A1c. Diabetes 1978;27:102-7.ArticlePubMed
- 37. Baek JH. Real-world treatment patterns according to KDA guideline in patients with type 2 diabetes and established ASCVD: based on KNHIS data. In: Presented at: International Congress of Diabetes and Metabolism and the 13th AASD Scientific Meeting. 2021 Oct 7-9; Online.
REFERENCES
Figure & Data
References
Citations
- The Beneficial Effect of Glycemic Control against Adverse Outcomes in Patients with Type 2 Diabetes Mellitus and Chronic Kidney Disease
Dong-Hwa Lee
Diabetes & Metabolism Journal.2023; 47(4): 484. CrossRef - Prevalence and predictors of chronic kidney disease among type 2 diabetic patients worldwide, systematic review and meta-analysis
Eneyew Talie Fenta, Habitu Birhan Eshetu, Natnael Kebede, Eyob Ketema Bogale, Amare Zewdie, Tadele Derbew Kassie, Tadele Fentabil Anagaw, Elyas Melaku Mazengia, Sintayehu Shiferaw Gelaw
Diabetology & Metabolic Syndrome.2023;[Epub] CrossRef - Efficacy and safety of teneligliptin in patients with type 2 diabetes mellitus: a Bayesian network meta-analysis
Miao Zhu, Ruifang Guan, Guo Ma
Frontiers in Endocrinology.2023;[Epub] CrossRef
 PubReader
 ePub Link
 Cite
Cite- Figure
-


- Related articles
-
- Risk Prediction and Management of Chronic Kidney Disease in People Living with Type 2 Diabetes Mellitus
- The Beneficial Effect of Glycemic Control against Adverse Outcomes in Patients with Type 2 Diabetes Mellitus and Chronic Kidney Disease
- Safety and Effectiveness of Empagliflozin in Korean Patients with Type 2 Diabetes Mellitus: Results from a Nationwide Post-Marketing Surveillance
- Advanced Liver Fibrosis Is Associated with Chronic Kidney Disease in Patients with Type 2 Diabetes Mellitus and Nonalcoholic Fatty Liver Disease


