
- Current
- Browse
- Collections
-
For contributors
- For Authors
- Instructions to authors
- Article processing charge
- e-submission
- For Reviewers
- Instructions for reviewers
- How to become a reviewer
- Best reviewers
- For Readers
- Readership
- Subscription
- Permission guidelines
- About
- Editorial policy
Articles
- Page Path
- HOME > Diabetes Metab J > Volume 45(2); 2021 > Article
-
Original ArticleMetabolic Risk/Epidemiology Effect of Sarcopenia and Body Shape on Cardiovascular Disease According to Obesity Phenotypes
-
Hyun-Woong Cho1*
 , Wankyo Chung2,3*, Shinje Moon1, Ohk-Hyun Ryu1, Min Kyung Kim1, Jun Goo Kang1
 -
Diabetes & Metabolism Journal 2021;45(2):209-218.
DOI: https://doi.org/10.4093/dmj.2019.0223
Published online: July 10, 2020
1Division of Endocrinology and Metabolism, Hallym University College of Medicine, Chuncheon, Korea
2Department of Public Health Science, Graduate School of Public Health, Seoul National University, Seoul, Korea
3Institute of Health and Environment, Seoul National University, Seoul, Korea
-
Corresponding author: Jun Goo Kang Division of Endocrinology and Metabolism, Hallym University College of Medicine,1 Hallimdaehak-gil, Chuncheon 24252, Korea. kjg0804@empas.com
-
Corresponding author: Min Kyung Kim Division of Endocrinology and Metabolism, Hallym University College of Medicine, 1 Hallimdaehak-gil, Chuncheon 24252, Korea. mkkim83@kdh.or.kr
- *Hyun-Woong Cho and Wankyo Chung contributed equally to this study as first authors.
• Received: November 20, 2019 • Accepted: December 6, 2019
Copyright © 2021 Korean Diabetes Association
This is an Open Access article distributed under the terms of the Creative Commons Attribution Non-Commercial License (http://creativecommons.org/licenses/by-nc/4.0/) which permits unrestricted non-commercial use, distribution, and reproduction in any medium, provided the original work is properly cited.
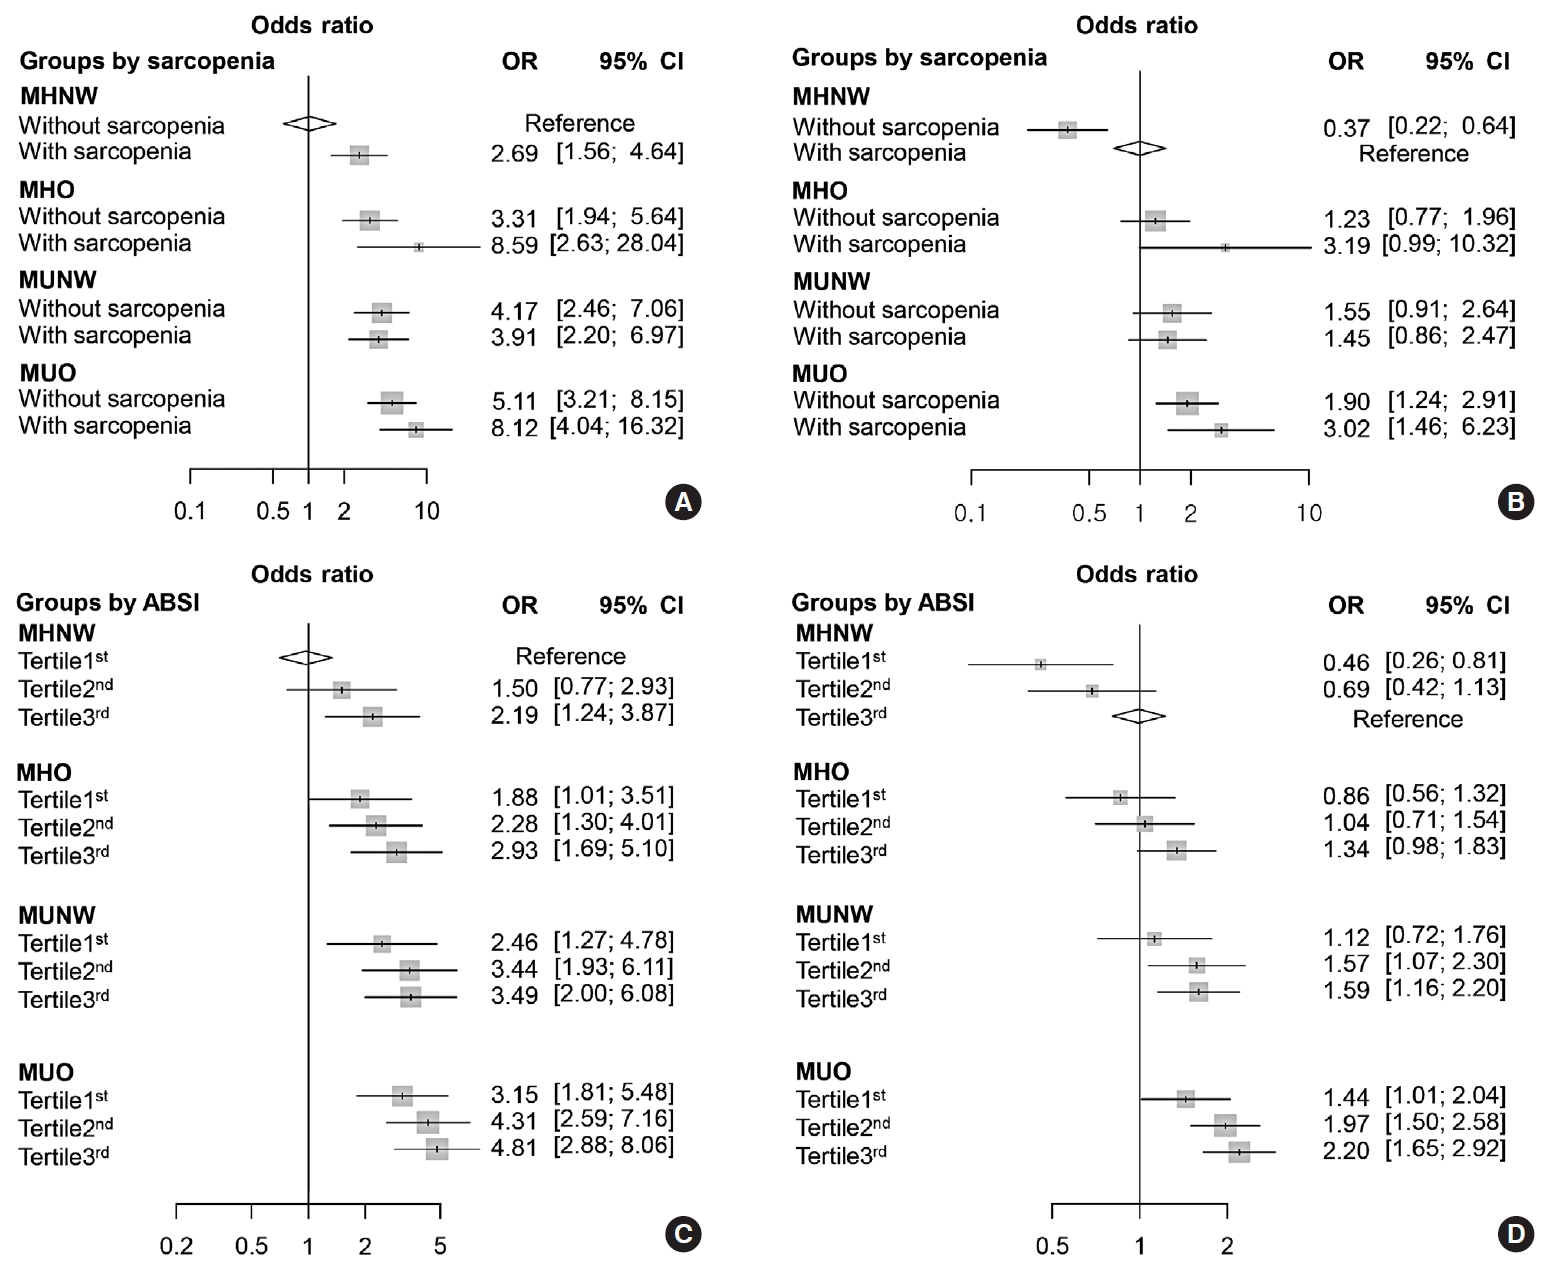
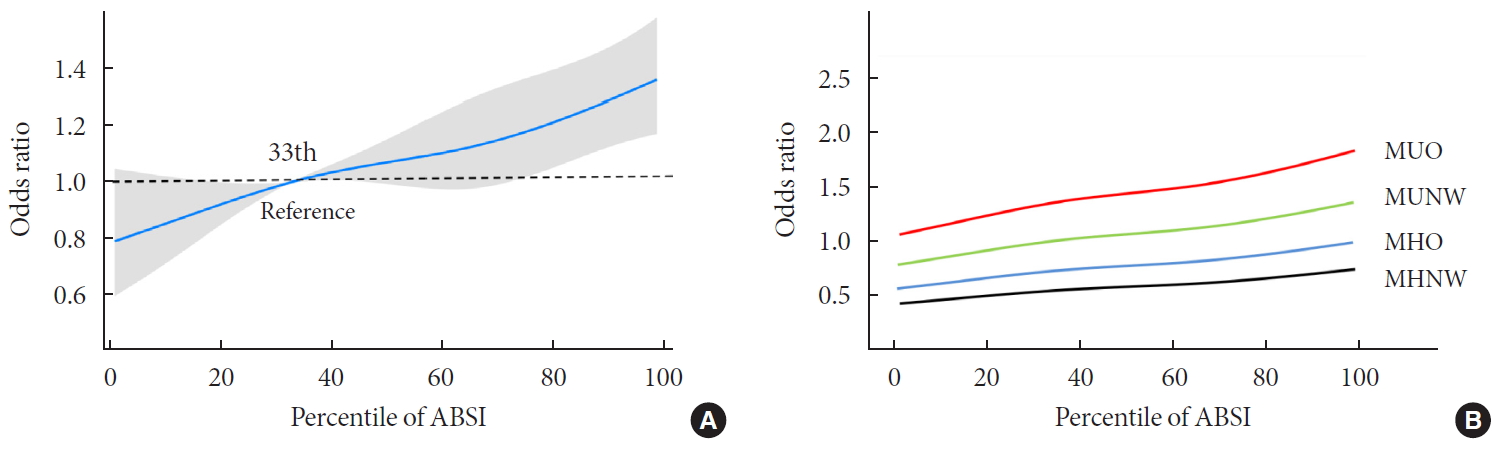
Figure & Data
References
Citations
Citations to this article as recorded by 
- Association of low muscle mass and obesity with increased all‐cause and cardiovascular disease mortality in US adults
Donghyun Kim, Junghoon Lee, Raekil Park, Chang‐Myung Oh, Shinje Moon
Journal of Cachexia, Sarcopenia and Muscle.2024; 15(1): 240. CrossRef - Metabolic-associated fatty liver disease and sarcopenia: A double whammy
Aditya Viswanath, Sherouk Fouda, Cornelius James Fernandez, Joseph M Pappachan
World Journal of Hepatology.2024; 16(2): 152. CrossRef - Association of Myosteatosis with Nonalcoholic Fatty Liver Disease, Severity, and Liver Fibrosis Using Visual Muscular Quality Map in Computed Tomography
Hwi Seung Kim, Jiwoo Lee, Eun Hee Kim, Min Jung Lee, In Young Bae, Woo Je Lee, Joong-Yeol Park, Hong-Kyu Kim, Chang Hee Jung
Diabetes & Metabolism Journal.2023; 47(1): 104. CrossRef - Additive impact of diabetes and sarcopenia on all-cause and cardiovascular mortality: A longitudinal nationwide population-based study
Eyun Song, Soon Young Hwang, Min Jeong Park, Ahreum Jang, Kyeong Jin Kim, Ji Hee Yu, Nam Hoon Kim, Hye Jin Yoo, Ji A. Seo, Sin Gon Kim, Nan Hee Kim, Sei Hyun Baik, Kyung Mook Choi
Metabolism.2023; 148: 155678. CrossRef - Association between a body shape index and abdominal aortic calcification in general population: A cross-sectional study
Wei Li, Zhenwei Wang, Min Li, Jing Xie, Jing Gong, Naifeng Liu
Frontiers in Cardiovascular Medicine.2023;[Epub] CrossRef - Metabolic Impact of Frailty Changes Diabetes Trajectory
Alan J. Sinclair, Ahmed H. Abdelhafiz
Metabolites.2023; 13(2): 295. CrossRef - Association between sarcopenic obesity and poor muscle quality based on muscle quality map and abdominal computed tomography
Yun Kyung Cho, Han Na Jung, Eun Hee Kim, Min Jung Lee, Joong‐Yeol Park, Woo Je Lee, Hong‐Kyu Kim, Chang Hee Jung
Obesity.2023; 31(6): 1547. CrossRef - Metabolic Characteristics of Frail Older People with Diabetes Mellitus—A Systematic Search for Phenotypes
Ahmed H. Abdelhafiz, Grace L. Keegan, Alan J. Sinclair
Metabolites.2023; 13(6): 705. CrossRef - Risk of Cardiovascular Diseases Among Different Metabolic Obesity Phenotypes: A Prospective Observational Study
Xiaowei Liu, Chan Yang, Yuanyuan Dang, Zhenqi Chang, Juan Li, Yi Zhao, Yuhong Zhang
Metabolic Syndrome and Related Disorders.2023; 21(6): 306. CrossRef - Effect of Hypoxia Conditioning on Body Composition in Middle-Aged and Older Adults: A Systematic Review and Meta-Analysis
Zhijian He, Lijun Qiang, Yusheng Liu, Wenfeng Gao, Tao Feng, Yang Li, Bing Yan, Olivier Girard
Sports Medicine - Open.2023;[Epub] CrossRef - Association Between a Body Shape Index and Subclinical Carotid Atherosclerosis in Population Free of Cardiovascular and Cerebrovascular Diseases
Xiaotian Ma, Lihong Chen, Wenchao Hu, Lanjie He
Journal of Atherosclerosis and Thrombosis.2022; 29(8): 1140. CrossRef - Impact of Sarcopenia on the Severity of the Liver Damage in Patients With Non-alcoholic Fatty Liver Disease
Vittoria Zambon Azevedo, Cristina Alina Silaghi, Thomas Maurel, Horatiu Silaghi, Vlad Ratziu, Raluca Pais
Frontiers in Nutrition.2022;[Epub] CrossRef - Identification of sarcopenic obesity in adults undergoing orthopaedic surgery: Relationship between “a body shape index” (ABSI) and fat-free mass. A cross -sectional study
Ana Tomažič, Boštjan Žvanut, Lilijana Vouk Grbac, Mihaela Jurdana, Fatih Özden
PLOS ONE.2022; 17(6): e0269956. CrossRef - Associations of Dynapenic Obesity and Sarcopenic Obesity with the Risk of Complications in COVID-19
Laura Pérez-Campos Mayoral, Carlos Alberto Matias-Cervantes, Eduardo Pérez-Campos, Carlos Romero Díaz, Luis Ángel Laguna Barrios, María del Socorro Pina Canseco, Margarito Martínez Cruz, Eduardo Pérez-Campos Mayoral, Carlos Josué Solórzano Mata, Francisco
International Journal of Molecular Sciences.2022; 23(15): 8277. CrossRef - Sex Differences in Adiposity and Cardiovascular Diseases
Haoyun Li, Daniels Konja, Luyao Wang, Yu Wang
International Journal of Molecular Sciences.2022; 23(16): 9338. CrossRef - The Applicability of the ESPEN and EASO-Defined Diagnostic Criteria for Sarcopenic Obesity in Japanese Patients after Stroke: Prevalence and Association with Outcomes
Yoshihiro Yoshimura, Hidetaka Wakabayashi, Fumihiko Nagano, Ayaka Matsumoto, Sayuri Shimazu, Ai Shiraishi, Yoshifumi Kido, Takahiro Bise
Nutrients.2022; 14(19): 4205. CrossRef - The value of combining the simple anthropometric obesity parameters, Body Mass Index (BMI) and a Body Shape Index (ABSI), to assess the risk of non-alcoholic fatty liver disease
Maobin Kuang, Guotai Sheng, Chong Hu, Song Lu, Nan Peng, Yang Zou
Lipids in Health and Disease.2022;[Epub] CrossRef - Sarcopenia and cardiovascular disease in patients with and without kidney disease: what do we know?
Ozkan Gungor, Mustafa Sevinc, Sena Ulu, Ismail Kocyigit
International Urology and Nephrology.2022; 55(5): 1161. CrossRef - Skeletal Muscle Should Not Be Overlooked
Ji A Seo
Diabetes & Metabolism Journal.2021; 45(2): 173. CrossRef - The Role of Sarcopenic Obesity in Cancer and Cardiovascular Disease: A Synthesis of the Evidence on Pathophysiological Aspects and Clinical Implications
Erika Aparecida Silveira, Rômulo Roosevelt da Silva Filho, Maria Claudia Bernardes Spexoto, Fahimeh Haghighatdoost, Nizal Sarrafzadegan, Cesar de Oliveira
International Journal of Molecular Sciences.2021; 22(9): 4339. CrossRef
 PubReader
 ePub Link
 Cite
Cite


