Adipokines and Insulin Resistance According to Characteristics of Pregnant Women with Gestational Diabetes Mellitus
Article information
Abstract
Background
The aim of this study was to evaluate adipokines concentration and insulin resistance according to maternal age or obesity at pregnancy and weight change at diagnosed gestational diabetes mellitus (GDM) in pregnant women with GDM.
Methods
This study included 57 pregnant women who were diagnosed with GDM at 24 to 28 weeks of gestation. The subjects were classified into two or three groups according to pre-pregnancy body mass index (BMI, <25 kg/m2 vs. ≥25 kg/m2), maternal age at pregnancy (<35 years old vs. ≥35 years old), and weight change during pregnancy at screening for GDM (weight change below, within, and in excess of the recommended range). They were respectively compared in each group.
Results
Leptin, homeostasis model assessment of insulin resistance (HOMA-IR), and HOMA2-%B were increased in the group with pre-pregnancy BMI ≥25 kg/m2. Leptin and HOMA-IR were positively correlated with BMI both before pregnancy and at screening for GDM. There were no significant correlations between HOMA-IR and adipokines. HOMA-IR showed positive correlation with HOMA2-%B and negative correlation with HOMA2-%S.
Conclusion
Leptin and HOMA-IR at diagnosed GDM were increased in the GDM patients with obesity before pregnancy. They were positively correlated with BMI both before pregnancy and at screening for GDM. The effect of maternal age at pregnancy and weight change during pregnancy at GDM screening on adipokines and insulin resistance might be less pronounced than the effect of maternal obesity.
INTRODUCTION
Gestational diabetes mellitus (GDM) is characterized by impaired glucose tolerance (IGT) with first recognition of onset during pregnancy and is one of the most common complications that can lead to risks for the mother and fetus [1]. The complications related to GDM are macrosomia, shoulder dystocia, still birth, hypertension, and obstetric complications [23]. Abnormal maternal glucose regulation occurs in 3% to 10% of pregnancies, and GDM accounts for 90% of cases of diabetes mellitus (DM) in pregnancy [4]. According to the Korean Health Insurance Database, the prevalence of GDM increased from 5.7% in 2009 to 9.5% in 2011 [5].
The pathogenesis of GDM has not been fully elucidated. The hallmark of GDM is increased insulin resistance. Insulin resistance is a physiologic metabolic change that is regulated during pregnancy to maintain glucose levels for the metabolic demands of the rapidly developing fetus. It is related to anti-insulin hormones secreted by the placenta, including human placental lactogen, prolactin, glucocorticoid, and progesterone [6]. It is well known that the risk of GDM increases among women who are overweight or obese compared with lean or normal-weight women. Therefore, mechanisms linking obesity to insulin resistance, such as type 2 diabetes mellitus (T2DM), are likely to play a role in the development of GDM. In recent years, most studies about this have focused on leptin, resistin, and adiponectin as potential mediators of insulin resistance [7891011121314]. These have been suggested to be implicated in the regulation of placental growth, development, and function and in fetal growth.
However, a few studies have reported on the role of adipokines and insulin resistance in GDM in the Korean population [1516]. Kim [17] reported the similarities and differences from other racial/ethnic groups of GDM in Korean women. GDM is increasing worldwide due in large part to the obesity epidemic. Although the frequency of GDM is relatively low among Korean women, the number of pregnant women with GDM is increasing and GDM remains a concern with advanced maternal age and obesity at pregnancy and excessive weight gain during pregnancy. We evaluated adipokines concentration and insulin resistance according to maternal age or obesity at pregnancy and weight change at diagnosed GDM in the pregnant women with GDM.
METHODS
Participants
In this cross-sectional study, 57 pregnant women with GDM were included between November 2007 and December 2010 at Daegu Catholic University Medical Center. A 50-g 1-hour glucose challenge test was performed at 24 to 28 weeks of gestation. Those patients who had abnormal response (postload plasma glucose ≥140 mg/dL) accordingly underwent a 100-g, 3-hour oral glucose tolerance test (OGTT). Women were diagnosed with GDM if at least two of four diagnostic criteria were met (fasting plasma glucose ≥95 mg/dL, 1-hour plasma glucose ≥180 mg/dL, 2-hour plasma glucose ≥155 mg/dL, or 3-hour plasma glucose ≥140 mg/dL) (Carpenter and Coustan criteria) [18]. Maternal data on age, pre-pregnancy weight and height, and family history of diabetes were acquired from the medical records. Maternal body mass index (BMI) was calculated as weight divided by the square of height (kg/m2). The subjects were classified into three groups according to (1) pre-pregnancy BMI (<25 kg/m2 vs. ≥25 kg/m2), (2) maternal age at pregnancy (<35 years old vs. ≥35 years old), and (3) weight change during pregnancy at screening for GDM (weight gain below, within, and in excess of the recommended range). The results were respectively compared in each group. The ideal weight range for pregnancy is based on maternal height and weight before pregnancy. The calculation is based on the guidelines for pregnancy weight gain issued by the Institute of Medicine (IOM) in May 2009 [19], which suggest that recommendations to patients be based on pre-pregnancy BMI. For BMI levels <18.5, 18.5 to 24.9, 25 to 29.9, and >30 kg/m2, weight gain ranges are suggested at 28 to 40, 25 to 35, 15 to 25, and 11 to 20 pounds, respectively, and the recommended rates of weight gain are 1 to 1.3, 0.8 to 1, 0.5 to 0.7, and 0.4 to 0.6 pounds/week. The study protocol was approved by the Institutional Review Board of Daegu Catholic University Medical Center (IRB number CR-16-071). Informed consent was exempted by the board due to the retrospective nature of the study.
Biochemical measurements
All laboratory measurements were performed in the morning following an overnight fast (10 to 12 hours) at the time of the 100-g OGTT between 24 and 28 weeks. Glycosylated hemoglobin (HbA1c) levels were measured by high-performance liquid chromatography (Bio-Rad Laboratories, Hercules, CA, USA). Total serum cholesterol, triglyceride, low density lipoprotein cholesterol, and high density lipoprotein cholesterol levels were measured by enzymatic methods using a Hitachi Modular Analytics (Roche, Tokyo, Japan). Serum insulin and c-peptide were measured by electrochemiluminescence immunoassay using Roche Modular (Roche, Basel, Switzerland). For the measurement of adiponectin, a commercially available sandwich immunoassay kit (Human Adiponectin ELISA Kit; Millipore, St. Charles, MO, USA) was used, with intra-assay variability of 7.3% and inter-assay variability of 4.2%. The sensitivity of it was less than 0.5 ng/mL. Leptin was measured by a sandwich immunoassay kit (Human Leptin ELISA Kit; Millipore). The intra-assay coefficient of variation was 4.7% and inter-assay coefficient of variation was 7%. Resistin was quantified using a sandwich enzyme immunoassay kit (Human Resistin Immunoassay; R&D Systems, Minneapolis, MN, USA). The homeostasis model assessment of insulin resistance (HOMA-IR) index was calculated according to the formula: HOMA-IR=fasting glucose (mmol/L)×fasting insulin (mU/mL)/22.519 [20]. β-Cell function and insulin sensitivity were assessed by HOMA2-%B and HOMA2-%S which were calculated using HOMA2 Computer Model (www.dtu.ox.ac.uk/homa).
Statistical analysis
The summary for basic characteristics was performed using descriptive analysis. The data were represented by mean±standard deviation (SD) for normally distributed values and medians (range) for nonparametric values. The qualitative variables were reported as frequency and percent. Comparisons of clinical parameters according to maternal factor were performed using two sample t-tests with normality or Mann-Whitney U test for nonparametric values. The categorical variables were compared by chi-square test. Differences among groups according to weight change during pregnancy at screening were analyzed by analysis of variance or the Kruskal-Wallis test for nonparametric values. Pearson's correlation coefficient test was applied to assess the correlation between adipokines and clinical parameters, and for non-parametric values, Spearman's correlation was performed. Multivariate analysis was performed using multiple linear regression analysis. All statistical analyses were performed using SPSS version 18.0 for Windows (SPSS Inc., Chicago, IL, USA). P<0.05 was considered statistically significant.
RESULTS
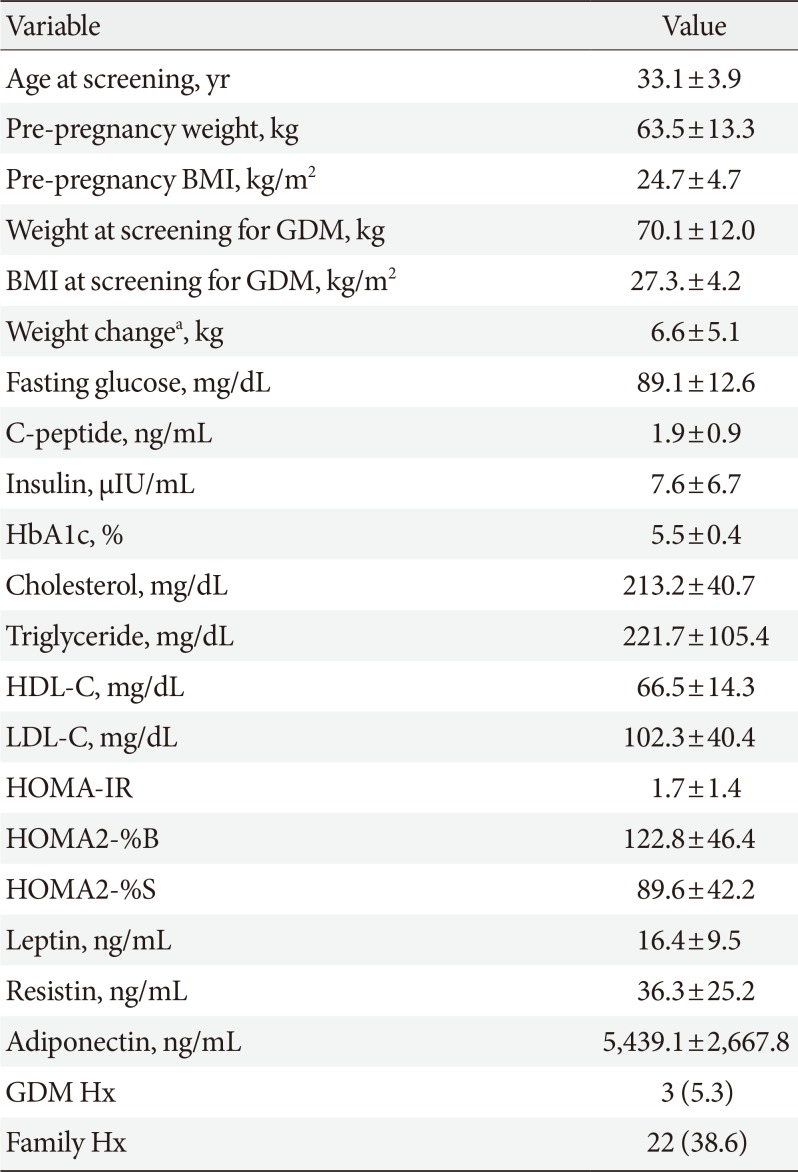
The clinical characteristics of the patients with GDM are summarized in Table 1. A total of 57 patents were evaluated in this study. Their mean age was 33.1±3.9 years. Mean pre-pregnancy weight and BMI were 63.5±13.3 kg and 24.7±4.7 kg/m2, respectively. Thirty-one patients (approximately 54%) were overweight or obese before pregnancy. Three patients (5.3%) had a history of prior GDM and 22 patients (38.6%) had a family history of DM.
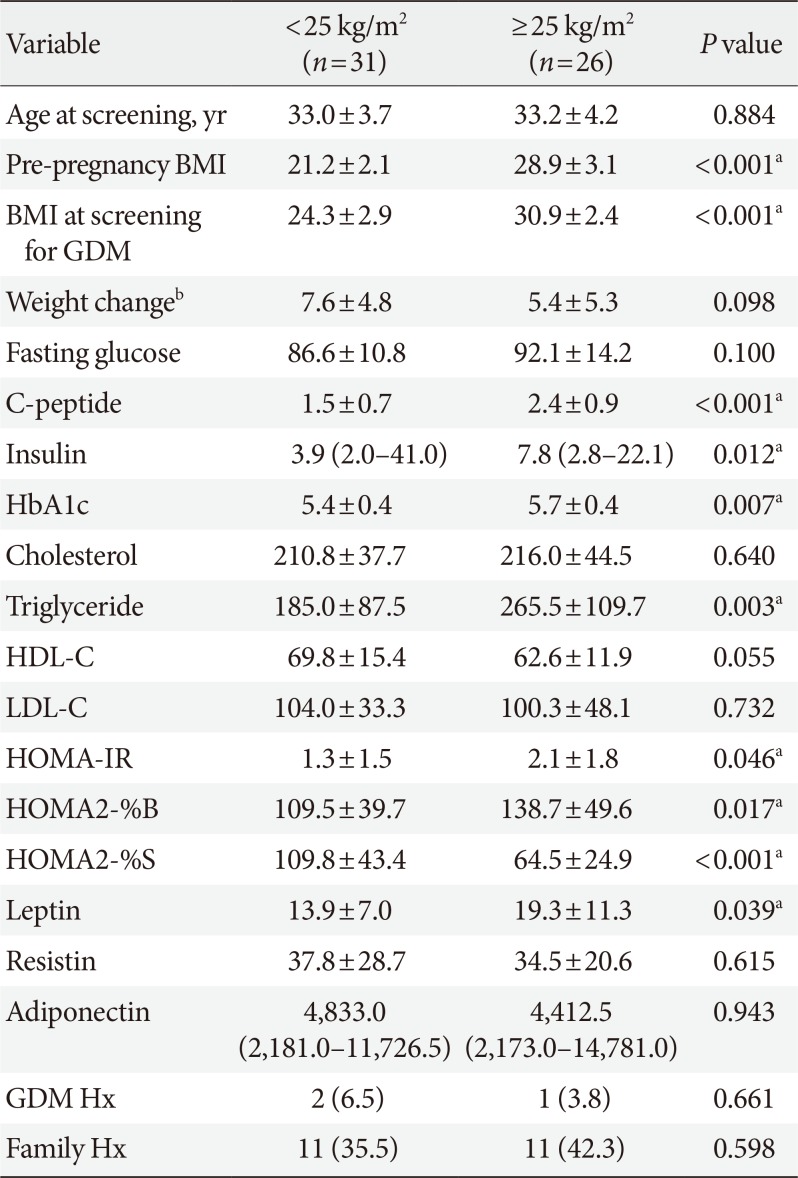
Comparisons of clinical parameters according to pre-pregnancy BMI, maternal age at pregnancy, and weight change during pregnancy at GDM screening are shown in Tables 2, 3, 4.

Comparisons of clinical parameters according to the weight change during pregnancy at screening for GDM
The clinical parameters such as C-peptide, insulin, HbA1c, triglyceride, and leptin were significantly increased in GDM patients with pre-pregnancy BMI ≥25 kg/m2 compared to those with pre-pregnancy BMI <25 kg/m2 (Table 2). HOMA-IR (1.3±1.5 vs. 2.1±1.8, P=0.046) and HOMA2-%B (109.5±39.7 vs. 138.7±49.6, P=0.017) were significantly increased in the group with pre-pregnancy BMI ≥25 kg/m2, while HOMA2-%S (109.8±43.4 vs. 64.3±24.9, P<0.001) was decreased. There were no significant differences in resistin and adiponectin between these two groups.
In comparisons according to maternal age at pregnancy, HOMA-IR and BMI were higher and adiponectin was lower in the GDM patients with age ≥35 years at pregnancy (Table 3). However, there were no statistically significant differences. In the group aged ≥35 years at pregnancy, a family history of DM was more frequent (56.5% vs. 26.5%, P=0.029).
When classified by weight change during pregnancy at screening, a higher BMI at screening was observed in the group with a weight change in excess of the recommended weight range (25.0±5.1, 27.8±3.3, and 29.9±2.3, P=0.025) (Table 4). Pre-pregnancy BMI was similar among the groups. Although there were no statistically significant differences, leptin was higher in GDM patients who gained above the recommended weight range. Adipokines demonstrated no significant differences among the groups.
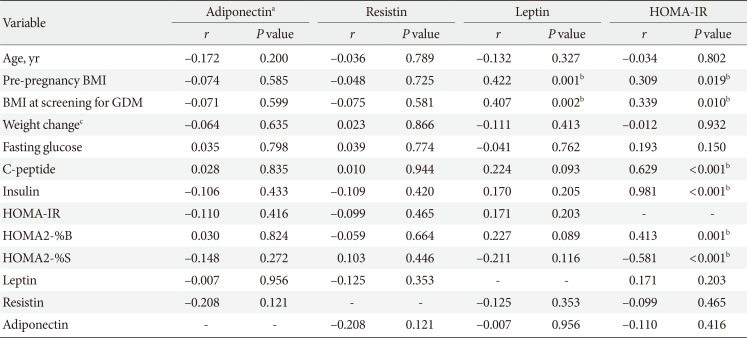
The correlations among metabolic parameters are shown in Table 5. Leptin and HOMA-IR were positively correlated with BMI at pregnancy as well as at screening for GDM. HOMA-IR was positively correlated with HOMA2-%B (r=0.413, P=0.001) and negatively correlated with HOMA2-%S (r=−0.581, P<0.001). There were no correlations between insulin resistance and adipokines such as adiponectin, leptin, and resistin.
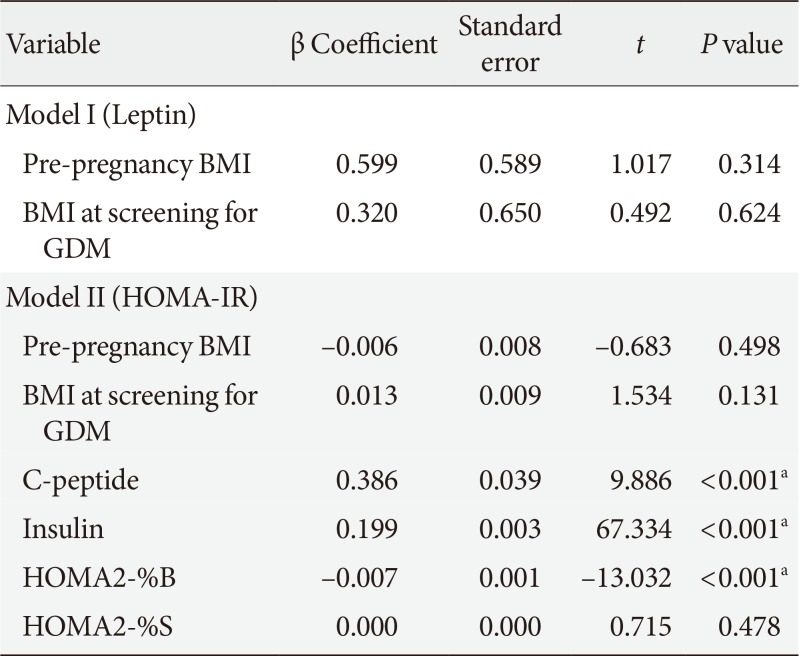
Multiple linear regression analyses were performed to assess relationships between maternal variables and each of the following variables for which correlation was significant: model I, leptin; model II, HOMA-IR (Table 6). HOMA2-%B was a negative influence of HOMA-IR (β coefficient=−0.007, P<0.001) after adjustment for the other variables.
DISCUSSION
In this study, we examined the features of adipokines and insulin resistance according to the known risk factors of GDM such as pre-pregnancy BMI, maternal age at pregnancy, and weight change during pregnancy at GDM screening in pregnant women with GDM. Leptin, HOMA-IR, and HOMA2-%B at diagnosed GDM were increased in the GDM with obesity (BMI ≥25 kg/m2) before pregnancy. They were positively correlated with BMI both before pregnancy and at screening for GDM. The correlations between adipokines and insulin resistance were not statistically significant. The effect of maternal age at pregnancy and weight change during pregnancy at GDM screening on adipokines and insulin resistance might be less pronounced than the effect of maternal obesity.
Metabolic changes occur during pregnancy. In early gestation, maternal fat is stored and insulin secretion increases, while insulin sensitivity remains unchanged or decreases and insulin resistance and facilitated lipolysis follow in late preg nancy [21]. Pregnancy has been characterized as a diabetogenic state because of the progressive increases in postprandial glucose and the insulin response in the late gestation that decreases up to 50% in insulin-mediate glucose disposal, as well as increases of 200% to 250% in insulin secretion to maintain euglycemia in the mother [212223]. These changes become worse in pregnant women who develop GDM.
Recently, many studies have investigated adkipokines such as adiponectin and leptin, which are secreted only by fat cells, as well as other adipocytokines like resistin and interleukin 6, which can be secreted also by stromal cells in adipose tissue. These are all related to regulation of insulin resistance. In addition, adiponectin, leptin, and resistin are all known to be produced within the intrauterine environment such as the placenta [242526]. Adiponectin is a protein hormone that modulates a number of metabolic processes, including glucose regulation and fatty acid oxidation [27]. Circulating adiponectin levels are reduced in patients with GDM as compared to pregnant controls [28]. It leads to aggravate insulin resistance as adiponectin has insulin-sensitizing effects. Leptin is a hormone that helps to regulate energy balance by inhibiting hunger. In obesity, a decreased sensitivity to leptin occurs and results in leptin resistance. Pregnancy is considered a leptin resistant state. Leptin levels reach two- or three-fold higher concentrations compared to the non-pregnant conditions with a peak occurring around 28 weeks of gestation and a decrease to pregravid concentrations observed immediately after delivery [29]. Leptin levels are known to be related to adipose tissue mass and correlated with body fat mass and BMI in both non-pregnant and pregnant women [3031]. Leptin is closely correlated with human choriogonadotrophin throughout pregnancy [32]. Although the results have been controversial, most studies have shown increased leptin in GDM [67913]. Resistin is an adipose-derived hormone similar to a cytokine whose physiologic role has been the subject of much controversy regarding its involvement with obesity and T2DM [33]. Data on circulating resistin in patients with GDM have been inconsistent. Resistin levels in pregnant women are elevated, decreased, or unchanged in the reports [28].
The changes of adipokines and insulin resistance during pregnancy depend on the first, second, or third trimester and result from profound changes in a woman's hormonal status and metabolism [21]. The ability to adjust the nutritional status during this period is very important for the growing fetus in pregnant women. GDM develops when the pancreatic β-cell reserve is insufficient to compensate for decreased insulin sensitivity during pregnancy [2834]. There are some studies of the comparisons of adipokines and insulin resistance between GDM and pregnancy with normal glucose tolerance or IGT in Korea [153536]. However, studies of adipokines and insulin resistance according to maternal factors among GDM patients are few. Oh et al. [15] reported that adiponectin levels were decreased and leptin levels were increased in pregnant women with normal glucose tolerance during 24 to 28 weeks of gestation. Pregnant women with IGT and GDM had significantly elevated resistin compared with those of normal glucose tolerance. In addition, the increased resistin levels were predictors for gestation glucose intolerance.
Risk factors for GDM include advanced gestational age, family history, excessive body weight before pregnancy, and being a nonwhite race such as Black, Hispanic, or Asian. In our study, HOMA-IR, HOMA2-%B, and leptin were significantly increased in GDM patients with obesity (BMI ≥25 kg/m2) before pregnancy (Table 2). HOMA2-%S was decreased. HOMA2-%B increases to compensate for insulin resistance in patients, although pancreatic β-cell reserve is not sufficient. In comparisons of maternal factors at pregnancy, a family history of DM was more frequent for the group aged ≥35 years. Late pregnancy of women with genetic predisposition was high risk for GDM. The IOM and the National Research Council released a report recommending new guidelines for weight gain during pregnancy [19]. It is related with the increase in the number of American women of childbearing age who are overweight and obese, although the relation of weight gain during pregnancy and GDM are controversial. In our study, there were no differences in adiponectin and insulin resistance in the comparisons according to the recommended weight range at GDM screening. At present, the excessive weight gain during pregnancy has been more common. Women who gain excessive weight during pregnancy find it difficult to return to their pre-pregnancy weight, while obese women who gain weight within the guidelines often are able to maintain a lower weight after the pregnancy [37]. The group with excess weight gain showed significantly increased BMI at GDM screening, although pre-pregnancy BMI was similar to the other group.
Leptin and HOMA-IR were positively correlated with BMI both before pregnancy and at screening for GDM in this study. Kautzky-Willer et al. [38] reported a positive correlation between leptin and body weight. Soheilykhah et al. [7] reported that leptin is significantly positively related to insulin and the HOMA index in women with GDM and IGT. Participants in that study were more obese (BMI 26.7±3.7 kg/m2) and had higher leptin levels than those of our study. Adiponectin is negatively correlated to HOMA-IR and there was no correlation found between adiponectin and pre-pregnancy BMI by Vitoratos et al. [8]. In our study, adipokines were not correlated with insulin resistance or insulin sensitivity. Various studies have shown circulating adiponectin levels reduced in patients with GDM compared to normal pregnant women independent of pre-pregnancy BMI and insulin sensitivity [3940]. To clarify the correlation between adiponectin and HOMA-IR in patients with GDM, the change of adipokines caused by insulin resistance related with GDM should be identified.
Our study has some limitations. First, this retrospective analysis was limited by the small sample size at a single center. A large-scale prospective study would overcome these limitations. Second, our study indirectly used of surrogate measures of insulin resistance and β-cell function. Third, when the subjects were classified according to weight change during pregnancy at screening for GDM, we used the recommended rates of weight gain of the IOM guidelines.
In summary, we evaluated the features of adipokines and insulin resistance according to the known maternal risk factors of GDM such as pre-pregnancy BMI, maternal age at pregnancy, and weight change during pregnancy at screening in pregnant women with GDM. HOMA-IR and leptin were increased in GDM patients with obesity at pregnancy. They were positively correlated with BMI before pregnancy and at screening for GDM. The effect of maternal age at pregnancy and weight change during pregnancy at GDM screening on adipokines and insulin resistance might be less pronounced than the effect of maternal obesity.
Although most women diagnosed with GDM return to normal glucose tolerance soon after delivery, some have IGT or T2DM. Leptin and HOMA-IR were increased in GDM patients with obesity before pregnancy and positively correlated with BMI both before pregnancy and at screening for GDM. It might be necessary to stratify GDM patients according to clinical characteristics and modify the strategy for management of GDM.
Notes
CONFLICTS OF INTEREST: No potential conflict of interest relevant to this article was reported.


