The Effect of 12 Weeks Aerobic, Resistance, and Combined Exercises on Omentin-1 Levels and Insulin Resistance among Type 2 Diabetic Middle-Aged Women
Article information

Abstract
Background
Recent studies have shown that omentin-1 derived from adipokines can affect physiological regulations and some metabolic dis-eases such as type 2 diabetes mellitus (T2DM).
Methods
The purpose of this study was to examine the impact of 12 weeks of aerobic (cycle ergometer), resistance, and combined exercises on omentin-1 level, glucose and insulin resistance indices in overweight middle age women with T2DM. In this study, 60 overweight middle age diabetic women were selected using simple random sampling and they were assigned to three groups of aerobic exercise (n=12), resistant exercise (n=12) and combined exercise (n=13), and one control group (n=15). Exercises were done in a three times per week sessions for a total of 12 weeks. Blood samples were collected before each exercise session and 24 hours after of the last session.
Results
Present study showed that fasting blood sugar decreased significantly in all intervention groups, while homeostasis model assessment of insulin resistance (HOMA-IR) decreased only in the aerobic and combined exercises groups. Furthermore, there was a significant increase in the omentin-1 level only in the combined exercise group.
Conclusion
Compared to aerobic and resistance exercises, 12 weeks of combined exercise was more efficient in improving HOMA-IR and increasing serum omentin-1 among women with T2DM.
INTRODUCTION
Nowadays, obesity, especially abdominal obesity, as well as increase in body fat layers are considered as one of the main problems globally [1]. A wide range of behavioral, genetic, biological, and environmental factors can lead to obesity [2]. Obesity is strongly associated with chronic cardiovascular disorders and type 2 diabetes mellitus (T2DM) during the middle-age and the old age [1]. Even though people with obesity, T2DM or metabolic syndromes may encounter variety of problems while doing exercises, but they are often advised to do exercise as a non-pharmacological treatment for losing weight [3]. A previous research has shown that a decrease in peripheral insulin resistance during exercise leads to increase in peripheral glucose uptake, while liver glucose production remains the same. A significant insulin resistance in muscle has been reported in T2DM [4]. In patients with this condition, an increase in glucose absorption which takes place during exercising shows that insulin resistance does not necessarily lead to prevention of blood glucose absorption in cells. Insulin resistance decreases the capability of insulin to stimulate the absorption and to save up glucose, as well as to decrease the glucose production by the liver [4].
Recently, it was discovered that the adipose tissue is an active endocrine tissue which secretes a large amount of active intermediates such as adipokine, which plays a significant role in energy homeostasis, in addition to, regulating the blood pressure, glucose and fat metabolisms [567]. Omentin-1, a recently-recognized adipokine which is expressed in the visceral adipose tissue, is synthesized and secreted within the adipose tissue vessels stem cells. The omentin-1 can play a role to increases glucose transfer in the adipose tissue carried out by insulin. Omentin-1 might play either a paracrine or an endocrine role in regulating the insulin sensitivity. Furthermore, omentin-1 is involved in regulating energy metabolism and distribution of body fat. Some scientists have suggested that, serum omentin-1 level decreases with obesity and insulin resistance. In fact, obesity and insulin resistance associated with this decreases, can reduce gene expression [8910]. Furthermore, a decrease in omentin-1 serum level can contribute to insulin resistance [9]. Indeed, insulin resistances which results from obesity can reduce omentin-1 gene expression [10].
Diabetes has been associated with a reduction in the omentin-1 level. Gursoy et al. [11], demonstrated that omentin-1 levels were considerably lower in those with T2DM in comparison with a healthy control group. They showed that insulin resistance greatly reduced omentin-1 levels. At the same time, Pan et al. [12], indicated that omentin-1 level increased after weight loss.
Another study has suggested that serum omentin-1 level was lower in patients with impaired glucose regulation and those with T2DM in comparison with normal glucose level participants [12]. It was further shown that omentin-1 level had a negative correlation with body mass index (BMI), fasting insulin, homeostasis model assessment of insulin resistance (HOMA-IR), and plasma glucose [13].
In addition, physical activities have been suggested to play a role in controlling the omentin-1 level. For instance, Saremi et al. [14], investigated the effects of 12 weeks of aerobic exercise (AE; five sessions per week) on 18 obese men. The results showed an increase in cytokine/adipokine level, as well as a decrease in insulin resistance [14].
With regard to our knowledge about the effect of physical activity, this study was conducted in order to distinguish between the effects of aerobic, resistant exercise (RE) and combined exercise (CE) on the plasma omentin-1, HOMA-IR and body composition in middle age overweight diabetic women. The primary hypothesis of the study was significant differences in the change of HOMA-IR from the baseline to the end of three interventions and the control group. The secondary hypothesis was a significant change in plasma omentin-1.
METHODS
This randomized controlled trial study was conducted from February to April 2013 (approval state of IR.SUMS.REC. 1395.192). The study population comprised of women with T2DM (using simple random sampling) who were visiting public clinic (Emam Reza Clinic) running by Shiraz University of Medical Sciences.
The inclusion criteria were: having been suffering from T2DM (fasting blood sugar ≥126 mg/dL and 2-hour post-prandial blood glucose ≥200 mg/dL) [15] for at least 2 years, being female, aged 45 to 60 years, not being diagnosed with any other diseases, patients were contacted by a phone call and were invited to participate into the study. During the phone call, after a brief explanation of the aims and protocol of the study, those interested were invited for the first visit during which they became fully aware of the study protocol and interventions.
All volunteers were examined by a general physician to assure that the intervention would not endanger patients. All participants gave their written informed consent. Group assignment: patients were divided into four groups each consisting of 15 participants. A group (control group) received no intervention and three groups underwent ‘AEs,’ ‘REs,’ group, and ‘CEs’ groups.
For those in AE group, each exercise session consisted of three phases of warm up, the main stage and a cool-down period. The warm-up phase comprised of 20 minutes of stretching and jogging. The main phase of the study was consisted of 25 minutes exercise in order to achieve 50% to 55% of maximum heart rate as measured by cycle ergometer. Running, exercise and stretching made up the cooling-down phase.
Each phase in the RE group had three sessions per week which consisted of three phases of warm-up, the main, and cooling-down. The warm-up involved 20 minutes of stretching exercises and jogging on the spot. The main phase consisted of three sets×eight repetitions of weight training including leg extension, prone leg curl, abdominal crunch, biceps, triceps, and seated calf. The exercise intensity was 50% to 55% of one repetition maximum (RM) or 1 RM. The cooling-down also consisted of running, free exercises and stretching.
The group with CEs had the same schedule of other groups for warm-up and cooling-down. The main phase consisted of aerobic training integrated with RE, with half the execution time and the same intensity of resistance and aerobic groups. The trainings programs were performed within three sessions per week for 12 weeks. Every 2 weeks, in all exercise groups training was increased by 5 minutes and the intensity by 5%. The average intensity of main stage in every exercise group was 5.5 metabolic equivalent of task (MET) in first week and increased to 7.1 MET at the end of the study.
Weight and height were measured and BMI was calculated using the following formula: BMI=weight (kg)/height (m2). In addition, body composition measurements (body fat percentage and skeletal muscle mass) were defined using body impedance analyzer (BOCA; MECA, Seoul, Korea) in sleeping position and normal hydration state. Moreover, before intervention, 5 mL blood samples were taken after 12 hours of fasting and the serum samples were separated using a centrifuge. The samples were frozen at -70° degrees centigrade until the time of serum analysis and omentin-1 and plasma glucose were then measured. Serum omentin-1 and fasting insulin concentrations were determined using enzyme-linked immunosorbent assay kits (Cristal day biotech, Shanghai, China) and (Monobind, Aachen, Germany). Fasting plasma glucose was measured using glucose kit (Pars Azmoon, Tehran, Iran) through the photometric method. Insulin resistance was determined through homeostasis model evaluation (HOMA-IR) and based on the following equation: HOMA-IR=[fasting glucose (mg/dL)×fasting insulin (mU/L)/405].
Test groups performed exercises for 12 weeks, while the control group did not. At the end of this period, blood samples were collected again as a post-test measurement of the dependent variables was performed. Primary criterion was the significant increase in serum omentin-1 concentration after 12 weeks training program. The sample size was calculated based on results of Wilms et al. [16], study.
STATA version 12 (STATA Corp., College Station, TX, USA) was used to analysis the data. Sample size was calculated to detect at least 1.5 units difference between groups in change of HOMA-IR from pre- to post- (12 weeks) measures with an assumed standard deviation of about the same size of difference (1.5 units), alpha value of 0.05 and a power of 80%. In order to compare the effects of each method of exercise on the absolute differences between pre and post-intervention measures of dependent variables, analysis of variance was used. Post hoc multiple comparison analysis (Tukey test) was applied to compare groups differences. Statistical analysis was conducted assuming two-sided 5% level of significance.
RESULTS
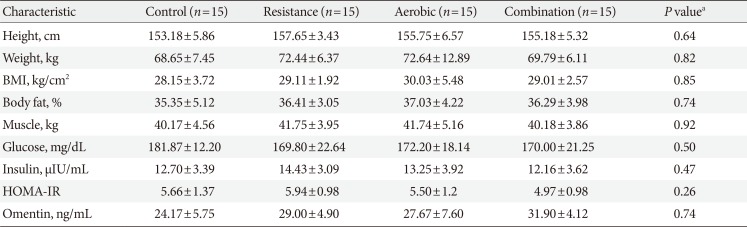
After completion of intervention, data of 52 participants (control group 15, AE group 12, RE group 12, and CE group 13) were analyzed (completion [response rate], 83%). Eight participants (17%) were excluded due to the fact that they either did not complete the exercises training or they refused to provide the post-test blood samples (Fig. 1). After excluding those participants, the results of statistical analyses showed that there were no significant differences in baseline measures of the study variables between the groups (Table 1).
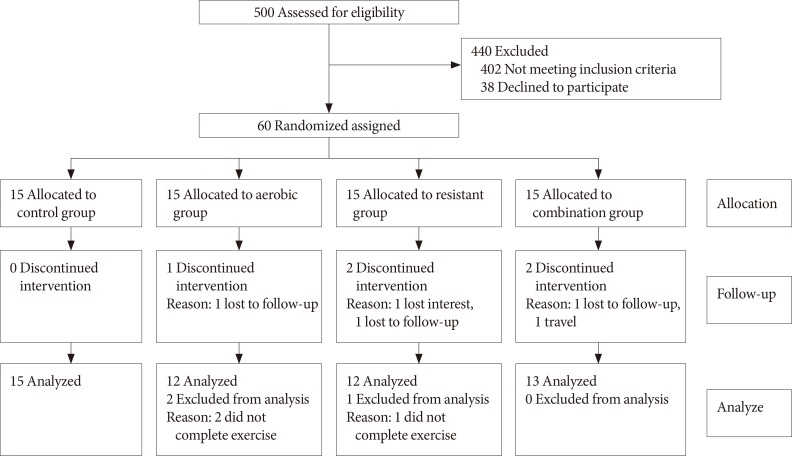
Study flow diagram.

Baseline characteristics of the participants
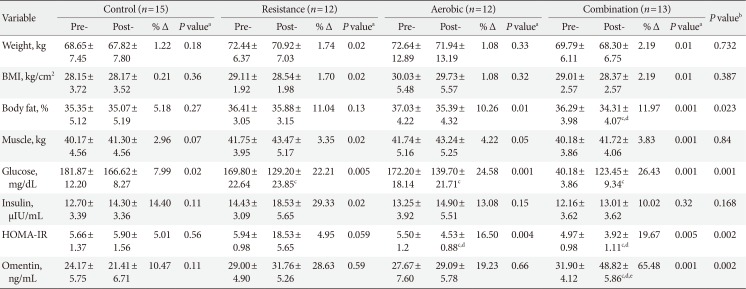
In comparison to the baseline measures, the interventions caused significant reduction in weight and BMI within RE and CE groups. However, these changes in the measures were not statistically significant when compared to the control group (Table 2). No significant change was found between the AE group and the control group regarding omentin-1 levels (Fig. 2), results of comparing changes of study variables (i.e., ΔHOMA-IR, or Δomentin level between groups) was shown in Table 2. It was also revealed that changes in omentin-1 were not significant when RE group was compared to the control group (P=0.76). However, change in omentin-1 level in the CE group was significantly higher after intervention was compared to the baseline measurements (21.00 to 48.82; P=0.001). Furthermore, the results of the study showed that after 12 weeks of training sessions, serum omentin-1 was significantly higher in the CE group in comparison to the other groups.

Laboratory values, anthropometric measures in groups at baseline and 12th week
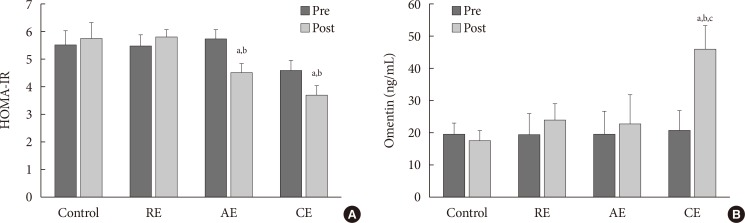
Changes of (A) homeostasis model assessment of insulin resistance (HOMA-IR) and (B) serum omentin-1 before and after 12 weeks training intervention based on analysis of variance. RE, resistance exercise; AE, aerobic exercise; CE, combined exercise. aP<0.05 compare with control, bP<0.05 compare with resistance, cP<0.05 comparison with aerobic.
Comparing to the baseline levels, serum glucose was decreased among all groups at the end of the study. However, comparing the intervention arms with the control group suggested a significant reduction in glucose concentration among the intervention groups. Regarding insulin resistance index, a significant difference was observed between aerobic and control groups (Fig. 2). In addition, after 12 weeks of AE and RE, HOMA-IR was decreased significantly among CE group compared to the control group, no significant difference was observed between resistance and the control group in this regard.
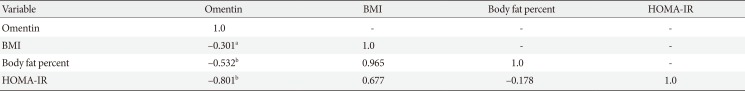
Results suggested that body fat percentage decreased in AE and CE groups after 12 weeks of exercise but this reduction was significant only in CE group. Finally, bivariate correlation between serum omentin-1, HOMA-IR and BMI showed that omentin-1 level is inversely associated to HOMA-IR (P=0.001), body fat percentage (P=0.004), and BMI (P=0.021) (Table 3).

The correlations between omentin and BMI (and HOMA-IR)
DISCUSSION
The present study suggested that glucose level decreases after 12 weeks of AE, RE, and CE. These changes were bigger among the participants in the CEs group. Also, compared to the controls, insulin resistance index decreased significantly in the aerobic and combined groups. Furthermore, the combined group had significant elevation in omentin-1 serum level.
In another study, it was shown that vigorous exercise is more effective in improving glycemic and lipid profiles than AE among patients with T2DM [17]. Other studies reported that CE (aerobic plus resistance) are more effective in reducing A1c and increasing insulin sensitivity [3].
Present study showed that the strongest effect of exercise on reducing insulin resistance was observed when the participants did both types of exercises. Jorge et al. [18], also reported similar findings. Accordingly, diabetic patients who did resistance and combined resistance and AEs experienced an increase in insulin receptor substrate 1 (IRS-1) expression.
Omentin-1 level in diabetics is lower than that of healthy individuals [13]. In a study by Pan et al. [12], changes in serum omentin-1 were measured in 46 patients with impaired glucose tolerance (IGT), 55 T2DM, and 50 participants with normal glucose tolerance (NGT). The results showed that serum omentin-1 level was lower in IGT and T2DM groups when compared to NGT group Abd-Elbaky et al. [19], reported that decrease in omentin-1 level was related to pathogenesis of T2DM. Bremer and Jialal [20] suggested that plasma level of omentin-1 among patients with metabolic syndrome was considerably lower than healthy individuals. These findings are in accordance with the results of present study in which changes in serum omentin-1 were negatively associated with insulin resistance.
It seems that exercise can lead to an increase in the omentin-1. In a similar study, the effect of 12 weeks of AE (five sessions a week) on 18 obese men was examined. It was shown that increase in omentin-1 had a positive effect on the omentin-1 levels of the participants via considerable reduction in weight [14]. In the present study, body fat percentage decreased significantly only in CE group. It has been previously pointed out that combination of aerobic and resistance training is more efficient in reduction of visceral fat than each exercise alone [2122]. In addition, as Moreno-Navarrete et al. [13] reported, decrease in visceral adipose tissue could lead to increase in omentin-1 gene expression. It could be the reason for the increase in serum omentin-1 in CE group.
In the present study, all of the training groups experienced significantly decrease in glucose level, but only AE and CE had reduced HOMA-IR after 12 weeks of exercise. Davidson et al. [23] in their study on 136 older obese participant which underwent aerobic, resistance, or combination training for 6 months have reported similar results. They observed improvement in HOMA-IR in aerobic and combination groups. It has been previously stated that reduction in visceral and abdominal fat is a key linkage between exercise and insulin resistance improvement [2425]. As this study showed, after 12 weeks of exercise body fat percentage reduced only in aerobic and combination groups; hence, it is may partly justified why we saw HOMA-IR reduction in AE and CE but not RE.
In conclusion, 12 weeks of aerobic and combination of AE and RE programs in diabetic women caused significant improvements in HOMA-IR. Moreover, significant increase in serum omentin-1 was observed with reduction of body fat in CE group. It seems that resistance and aerobic types of exercise can be used to improve insulin sensitivity and the omentin-1 level amongst diabetic patients.
ACKNOWLEDGMENTS
The present study was financially supported by Shiraz University of Medical Sciences, Shiraz, Iran (No: 95-01-59-12487).
We greatly appreciate the efforts of the patients who participated in this study and our colleagues at the Voluntary Counseling and Treatment Center (VCT) who supported our research. No sources of funding were used in this study. The authors declare no conflict of interest. The authors would like to thank Mr. H. Argasi at the Research Consultation Center (RCC) at Shiraz University of Medical Sciences for his invaluable assistance in editing this article.
Notes
CONFLICTS OF INTEREST: No potential conflict of interest relevant to this article was reported.