Myocardial Infarction, Stroke, and All-Cause Mortality according to Low-Density Lipoprotein Cholesterol Level in the Elderly, a Nationwide Study
Article information

Abstract
Background
We assessed the myocardial infarction (MI), stroke, and all-cause death risks during follow-up according to the low-density lipoprotein cholesterol (LDL-C) levels among older adults.
Methods
The Korean National Health Insurance Service datasets (2002 to 2020) were used for this population-based cohort study. The hazards of MI, stroke, and all-cause mortality during follow-up were analyzed according to LDL-C level in individuals aged ≥65 years without baseline cardiovascular diseases (n=1,391,616).
Results
During a mean 7.55 years, 52,753 MIs developed; 84,224 strokes occurred over a mean 7.47 years. After a mean 8.50 years, 233,963 died. A decrease in LDL-C was associated with lower hazards of MI and stroke. The decreased hazard of stroke in lower LDL-C was more pronounced in statin users, and individuals with diabetes or obesity. The hazard of all-cause death during follow-up showed an inverted J-shaped pattern according to the LDL-C levels. However, the paradoxically increased hazard of mortality during follow-up in lower LDL-C was attenuated in statin users and individuals with diabetes, hypertension, or obesity. In statin users, lower LDL-C was associated with a decreased hazard of mortality during follow-up.
Conclusion
Among the elderly, lower LDL-C was associated with decreased risks of MI and stroke. Lower LDL-C achieved by statins in the elderly was associated with a decreased risk of all-cause death during follow-up, suggesting that LDL-C paradox for the premature death risk in the elderly should not be applied to statin users. Intensive statin therapy should not be hesitated for older adults with cardiovascular risk factors including diabetes.
INTRODUCTION
Hypercholesterolemia is a well-established risk factor for atherosclerotic cardiovascular diseases (ASCVD) in adults [1]. Aggressively lowering low-density lipoprotein cholesterol (LDL-C) has been reported to further decrease ASCVD risk, proportionate to the achieved absolute reduction in LDL-C levels [2]. However, strategies to lower LDL-C levels and prevent ASCVD in the elderly, including lifestyle management and medications such as statins, have been mainly based on research findings in younger adults [1]. Furthermore, randomized controlled trials (RCTs) that evaluated the primary preventative effects of statins in older adults demonstrated inconsistent findings on the prevention of ASCVD [3–5], and did not show a difference in early all-cause mortality among statin versus control groups.
Observational studies on cholesterol levels and adverse outcomes including premature all-cause death, cardiovascular death, and recurrent cardiovascular events among older adults have shown conflicting results [6–12]. Several studies reported an inverse association of serum cholesterol levels with deteriorating health or all-cause mortality during follow-up in older adults [6,8–11]. However, Liang et al. [11] indicated that this inverse association between total cholesterol and all-cause mortality during follow-up in older adults originated from non-cardiovascular mortality, particularly among individuals not treated with cholesterol-lowering drugs. According to Strandberg et al. [12], serum total and LDL-C levels did not predict outcome, whereas low cholesterol absorption was associated with better survival and fewer recurrent cardiovascular events in home-dwelling individuals aged ≥75 years with ASCVD. In another longitudinal study, an elevated total cholesterol concentration predicted a higher risk for death from coronary heart disease (CHD) in older adults after adjusting for markers of poor health and risk factors for CHD [7].
Due to the less well-established evidence from RCTs of statin therapy as a primary prevention in the elderly compared to that in younger adults, and conflicting results from epidemiological studies on serum cholesterol levels and adverse outcomes in older adults, controversies have been raised on the aggressive lowering of LDL-C in older adults, especially in those without previous ASCVD. These inconsistencies among observational studies on the optimal serum cholesterol levels in the elderly need to be resolved with a large-scale population-based cohort study in the general elderly population with diverse LDL-C levels and including both statin users and non-users. Therefore, we compared the hazards of incident myocardial infarction (MI), stroke, and all-cause death during follow-up according to the LDL-C concentration among individuals without baseline ASCVDs and aged ≥65 years with or without statin therapy.
METHODS
Data sources
For this nationwide, longitudinal, population-based cohort study, we analyzed the Korean National Health Insurance Service (KNHIS) datasets from January 2002 to December 2019. Details on these datasets are provided in Supplementary methods [13–16]. The Institutional Review Board (IRB) of Korea University approved this study (2019GR0208). An informed consent exemption was granted by the IRB because the KNHIS provided the researchers with anonymous, de-identified data using anonymous identification numbers.
Study cohort
We included individuals who underwent ≥one health examination between 2009 and 2011 and were aged ≥65 years at baseline. The time point of the health examination between 2009 and 2011 was considered as baseline. We excluded individuals who had, at or before baseline, International Classification of Diseases-10th Revision (ICD-10) code claims for ischemic heart disease (I20–25), heart failure (I50), atrial fibrillation (I48.0–4 or I48.9), stroke (I63–64), subarachnoid hemorrhage (I60), intracerebral hemorrhage (I61), other non-traumatic intracranial hemorrhage (I62), any malignancy (C00–C97), and/or liver cirrhosis (K70.2–3, K71.7, K74.0–6). Furthermore, individuals with end-stage renal disease (defined according to previous studies [17,18]) at or before baseline, those with baseline triglyceride levels >400 mg/dL, or missing data in ≥one variable were excluded (Supplementary Fig. 1).
Outcomes and follow-up
The outcomes of interest were incident MI, stroke, and all-cause mortality during follow-up. We defined MI as ≥one claim under ICD-10 codes I21–I22 during hospitalization or ≥two claims under those codes [13,19,20], and stroke as ICD-10 codes I63–I64 during hospitalization with claims for brain magnetic resonance imaging or computed tomography [19, 20]. With respect to the outcomes of MI and stroke, the study population was followed up from baseline until the date of death, occurrence of outcome disease, or December 31, 2018, whichever came first. The datasets used for this study have been established until 2019 for the death information, although the other records have only been constructed up to 2018. Therefore, regarding the outcome of all-cause death, the study population was followed-up from baseline until the date of death, or December 31, 2019, whichever came first.
Measurements and definitions
Data on smoking history, alcohol consumption, and regular exercise were obtained using questionnaires. Definitions of heavy alcohol consumption, regular exercise, low-income status, body mass index (BMI), and statin use are summarized in Supplementary Table 1 [21,22]. Charlson Comorbidity Index (CCI) was determined by the established method [23] based on the diagnostic codes provided in a previous report [24]. Blood tests were performed after an overnight fast. The LDL-C levels were calculated based on total cholesterol, high-density lipoprotein cholesterol (HDL-C), and triglyceride levels according to the Friedewald formula [25]. These standardized health examinations are performed only in hospitals certified by the KNHIS. The presence of diabetes and dyslipidemia was determined following definitions in previous studies [18,20].
Statistical analyses
For statistical analyses, the SAS software version 9.4 (SAS Institute, Cary, NC, USA) was used. Two-sided P values <0.05 were considered significant. Participants were categorized into six groups according to their LDL-C level (mg/dL; LDL-C <55, 55≤ LDL-C <70, 70≤ LDL-C <100, 100≤ LDL-C <130, 130≤ LDL-C <160, 160≤ LDL-C) referring to treatment goals for LDL-C levels recommended by previous guidelines [26,27]. The baseline characteristics of the population were analyzed according to these six groups. Continuous variables are presented as the mean±standard deviation, and categorical variables are presented as the number (percentage). The incidence rates of outcomes were obtained from the number of incident cases divided by the total follow-up duration (person-years). The cumulative incidence rates of outcomes were compared according to the six groups of LDL-C level using Kaplan–Meier curves; the differences among the groups were assessed using a log-rank test. The hazard ratios (HRs) and 95% confidence intervals (CIs) for outcome incidence rates were calculated according to the six categories of LDL-C. The group with 100≤ LDL-C <130 mg/dL was set as a reference considering the distribution of LDL-C levels in our study population, median LDL-C values of general Korean population aged ≥65 years in a previous study [28], and target LDL-C goal for moderate risk group recommended by the Korean guideline [26]. To account for the changes in LDL-C level and statin use during the follow-up period, a time-dependent Cox regression analysis was performed calculating the HRs for outcomes. Model 1 was adjusted for age, sex, BMI, current smoking, heavy alcohol consumption, regular exercise, low-income status, diabetes, hypertension, and statin use. Model 2 was additionally adjusted for CCI, and triglyceride level was added in model 3. Model 4 was adjusted for the potential confounders included in model 3 and HDL-C level. Restricted cubic splines were also constructed for adjusted HRs and 95% CIs of outcomes according to LDL-C levels. The potential effect modification by statin use, age (<75 years vs. ≥75 years), sex, presence of diabetes, hypertension, and obesity was evaluated through the stratified analysis, and P for interaction was calculated. The presence of obesity was defined as BMI ≥25 kg/m2 according to the obesity guidelines for the Korean population [29].
Sensitivity analyses
The main analyses were rerun after stratifying the study population according to the triglyceride (≥150 mg/dL vs. <150 mg/dL) or HDL-C (≥40 mg/dL [in men], ≥50 mg/dL [in women] vs. lower) levels to further adjust for the potential effects of triglyceride or HDL-C levels. Sensitivity analysis was performed, after (1) restricting the study population to individuals aged ≥75 years considering that the benefits of LDL-C lowering therapy are less evaluated in this subpopulation than in those aged <75 years, and (2) excluding individuals who developed outcomes within 2 years from baseline.
RESULTS
Baseline characteristics
A total of 1,391,616 individuals aged ≥65 years were included (Supplementary Fig. 1). Among them, 171,702 (12.34%) had LDL-C ≥160 mg/dL, and 340,275 (24.45%) exhibited 130≤ LDL-C <160 mg/dL. The LDL-C was <55 mg/dL in only 29,211 (2.10%) participants, and the group of 55≤ LDL-C <70 mg/dL included only 56,783 (4.08%) participants. The baseline characteristics are summarized according to LDL-C categories (Table 1). As the LDL-C categories advanced, a decreasing trend was observed in CCI, and the proportion of males, current smokers, heavy alcohol consumers, statin users, and individuals with diabetes. A trend of slight increase in BMI was noted according to the advance in LDL-C categories.

Baseline characteristics according to the ranges of low-density lipoprotein cholesterol level
Incidence of MI and stroke according to LDL-C category
During a mean follow-up of 7.55±1.75 years (10,499,824.50 person-years), 52,753 MI cases developed (Table 2). After a mean follow-up of 7.47±1.83 years (10,398,538.22 person-years), 84,224 stroke cases occurred. The cumulative incidence of outcomes is shown according to LDL-C categories using Kaplan–Meier curves (Fig. 1). Individuals with LDL-C ≥160 mg/dL showed the highest cumulative incidence of MI while those with LDL-C <55 mg/dL exhibited the highest cumulative incidence of stroke. However, when the fully-adjusted HRs (95% CIs) were calculated according to the LDL-C categories through time-dependent Cox regression analyses (Table 2), a decrease in the LDL-C categories was associated with lower hazards of MI and stroke. When the fourth group (100≤ LDL-C <130 mg/dL) was set as a reference, the HRs for MI and stroke were the highest in the highest LDL-C category (LDL-C ≥160 mg/dL) (HR, 1.27; 95% CI, 1.24 to 1.31 for MI; and HR, 1.16; 95% CI, 1.13 to 1.18 for stroke). Compared to the reference (100≤ LDL-C <130 mg/dL), individuals with LDL-C <100 mg/dL demonstrated a lower hazard of MI and those with 55≤ LDL-C <100 mg/dL showed a lower hazard of stroke. Even individuals with LDL-C <55 mg/dL exhibited a lower hazard of MI than those in the reference group. We also summarized the results setting the LDL-C range with the lowest hazard as a reference (Supplementary Table 2). Similar relationships were observed when restricted cubic splines were used to treat LDL-C levels as continuous variables (Fig. 2).

Hazard ratios and 95% confidence intervals for the incidence of myocardial infarction, stroke, and all-cause death during follow-up according to the ranges of low-density lipoprotein cholesterol level
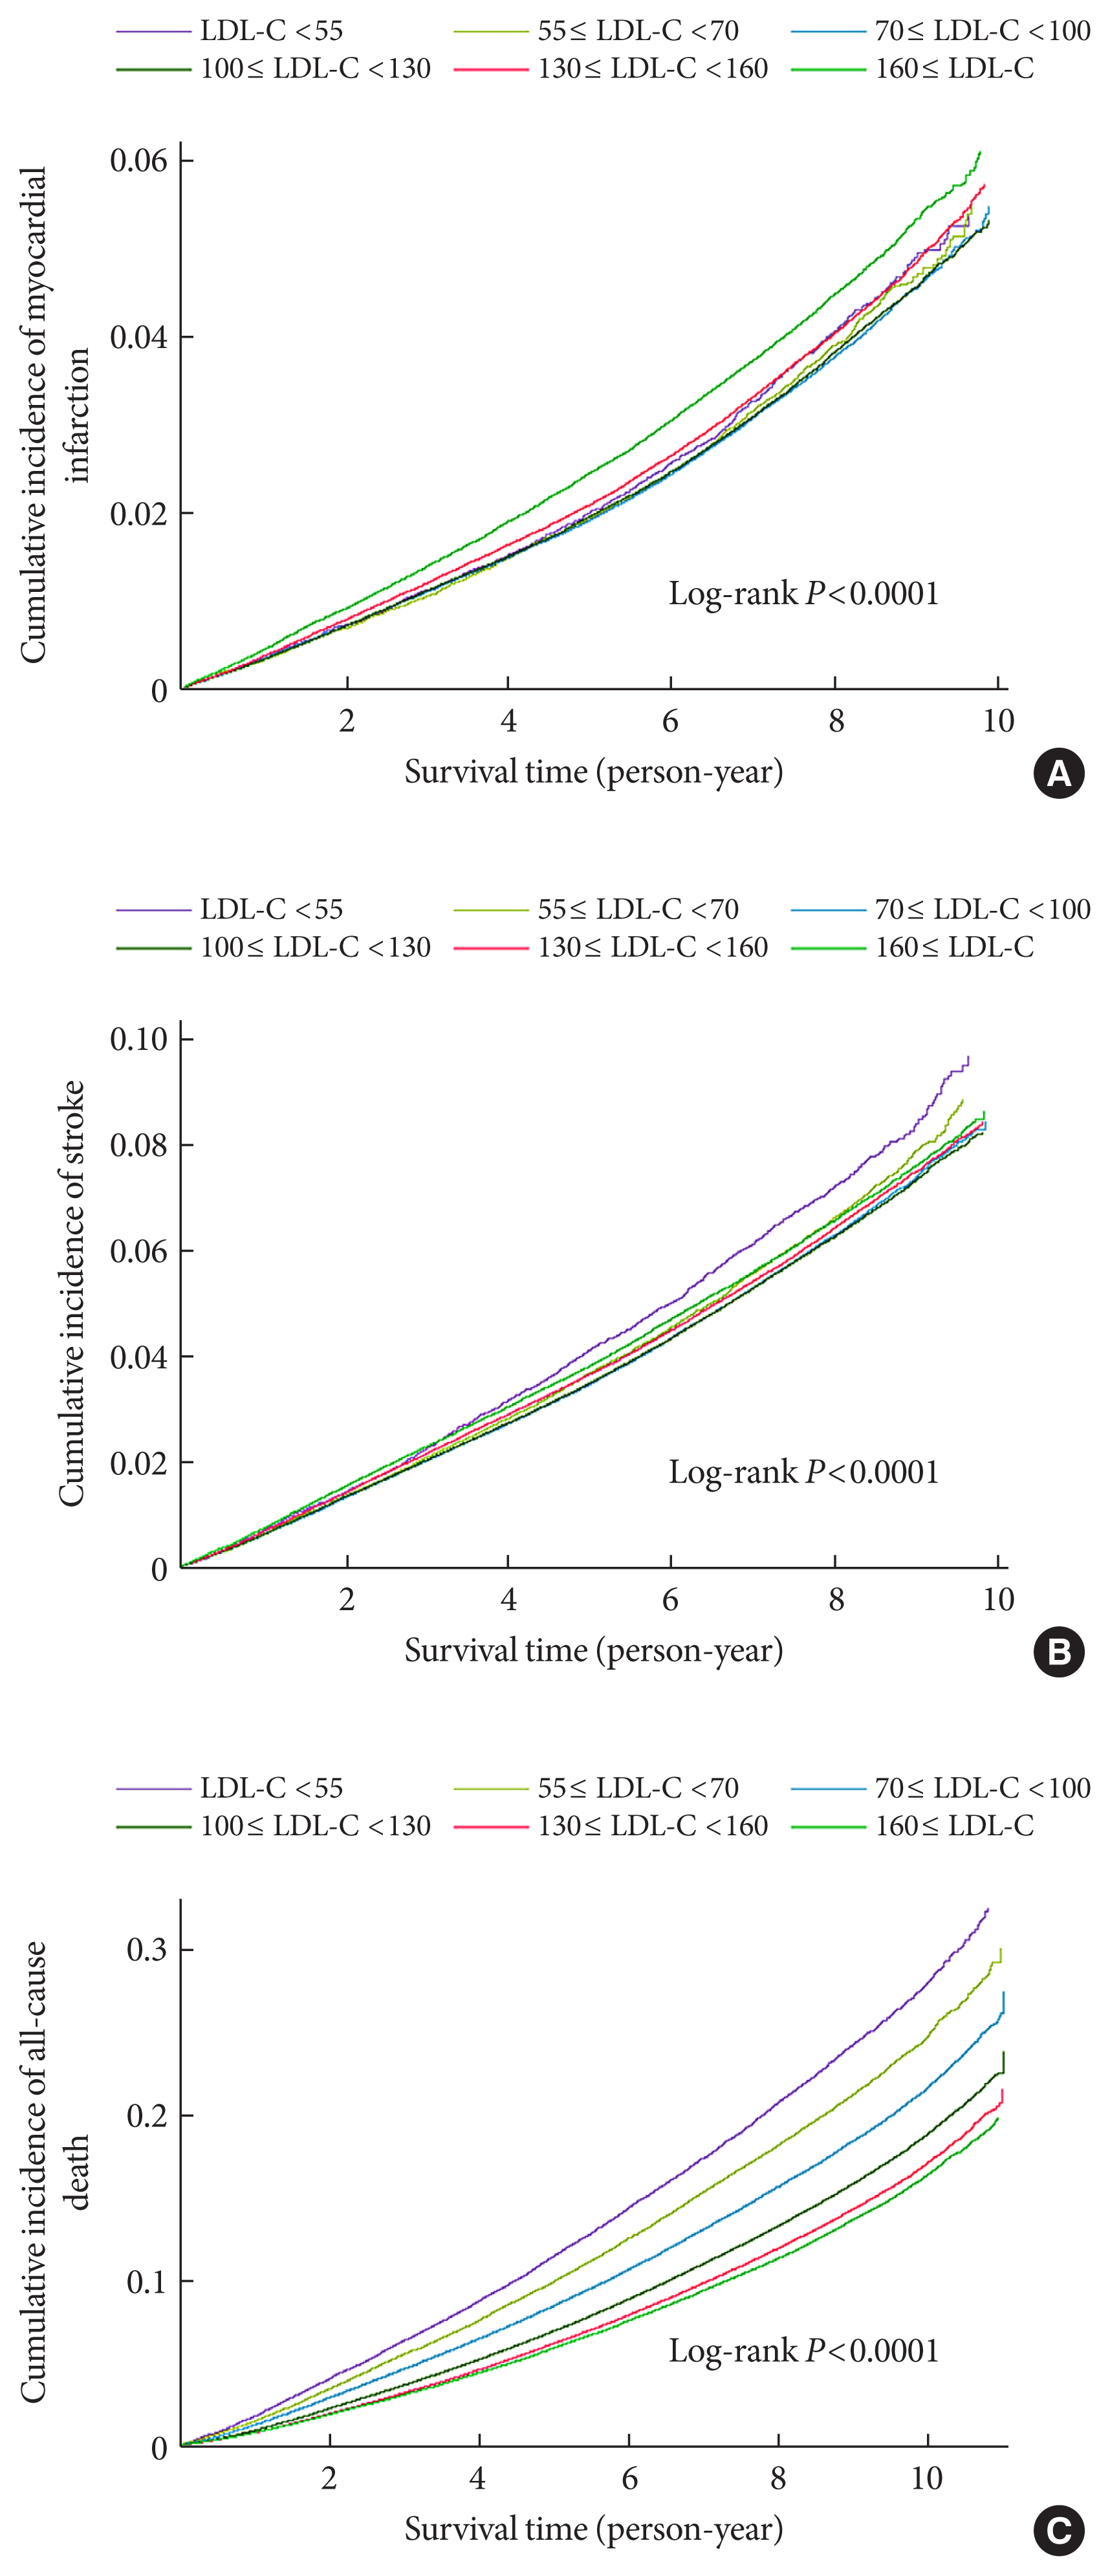
Kaplan–Meier estimates of cumulative incidence of (A) myocardial infarction, (B) stroke, and (C) all-cause death during follow-up according to the ranges of low-density lipoprotein cholesterol (LDL-C) levels.
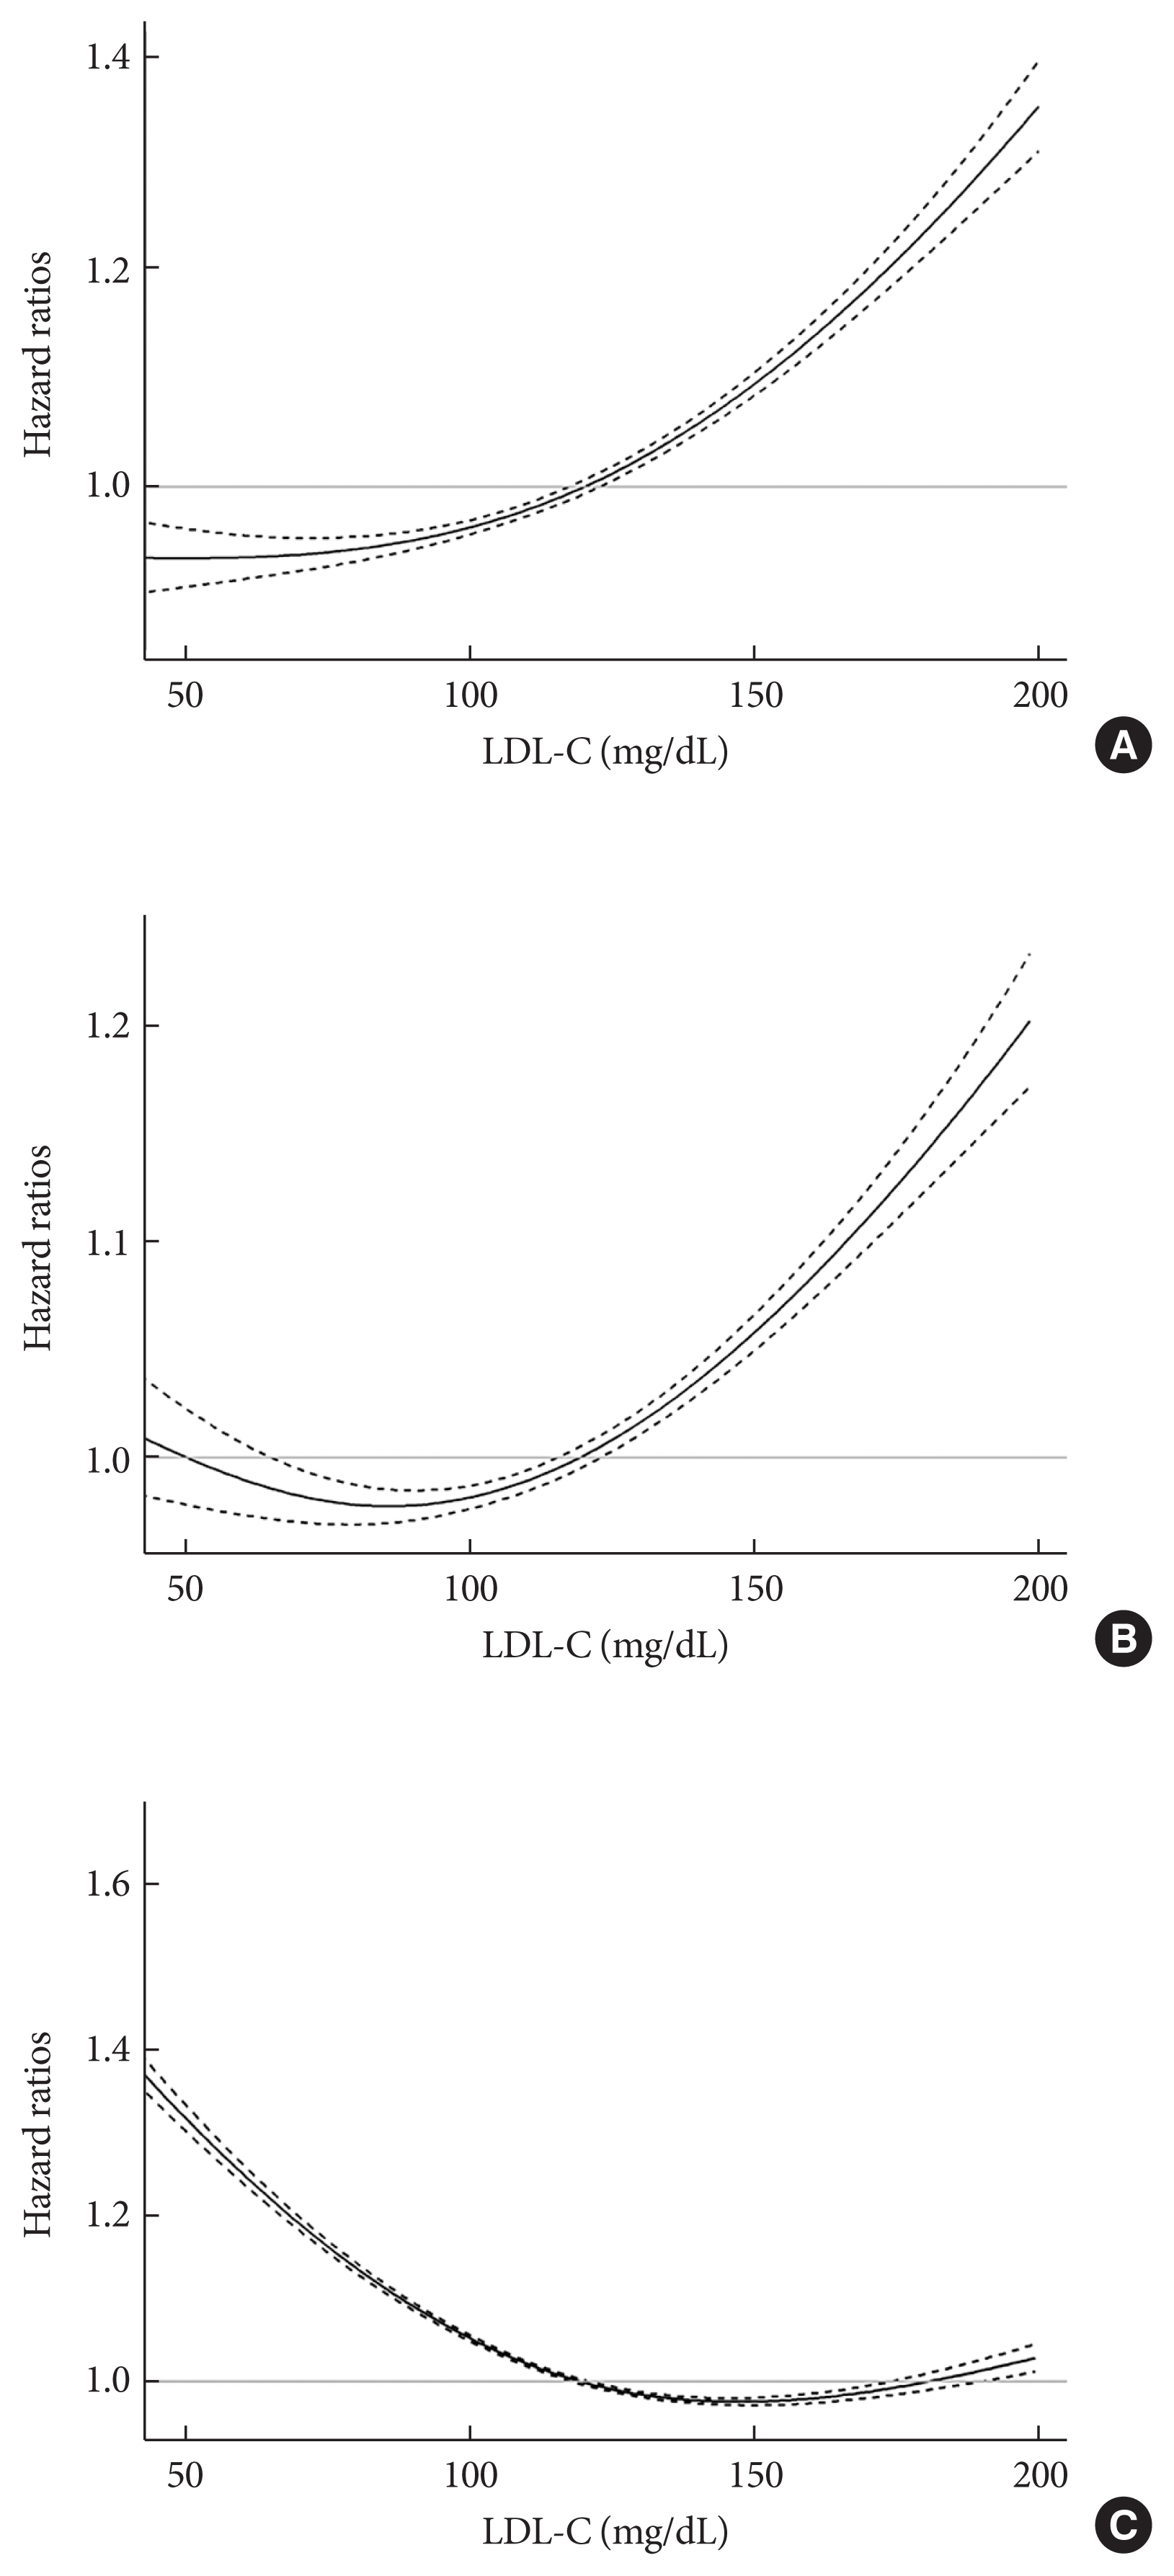
Hazard ratios for incident (A) myocardial infarction, (B) stroke, and (C) all-cause death during follow-up according to the low-density lipoprotein cholesterol (LDL-C) levels. Curves represent hazard ratios adjusted for age, sex, body mass index, current smoking, heavy alcohol consumption, regular exercise, low-income status, diabetes, hypertension, and statin use. Solid lines indicate hazard ratios and dashed line indicate 95% confidence intervals using restricted cubic spline regression.
All-cause death during follow-up according to LDL-C category
During a mean follow-up of 8.50±1.88 years (11,826,539.50 person-years), 233,963 deaths occurred (Table 2). The cumulative incidence of all-cause death during follow-up is presented according to LDL-C categories using Kaplan–Meier curves (Fig. 1). Individuals with lower categories of LDL-C exhibited a higher cumulative incidence of all-cause death during follow-up, with the highest cumulative incidence of all-cause death in the lowest LDL-C levels (LDL-C <55 mg/dL). When the fully-adjusted HRs (95% CIs) were calculated according to the LDL-C categories through time-dependent Cox regression analyses (Table 2 and Supplementary Table 2), the HR for all-cause death during follow-up showed an inverted J-shaped pattern according to the categories of LDL-C. When the group with 100≤ LDL-C <130 mg/dL was set as a reference, the HR of all-cause death during follow-up was the lowest in the reference group and group with 130≤ LDL-C <160 mg/dL (HR, 1.00; 95% CI, 0.98 to 1.01), and the highest in the lowest LDL-C group (LDL-C <55 mg/dL) (HR, 1.35; 95% CI, 1.32 to 1.38). Restricted cubic spline after treating LDL-C level as a continuous variable also demonstrated similar relationships (Fig. 2).
Subgroup analyses
The hazards of outcome according to the LDL-C categories were evaluated in subgroups stratified by statin use, age group (<75 years vs. ≥75 years), sex, presence of diabetes, hypertension, and obesity (Fig. 3 and Supplementary Fig. 2). In all subgroups, decreasing LDL-C categories were consistently associated with a lower hazard of MI. A decreased hazard of MI in the lowest categories of LDL-C was more prominent in individuals with diabetes (P for interaction=0.0367), or obesity (P for interaction <0.0001). With respect to the hazard of stroke, the decreased hazard in the categories of lower LDL-C levels were consistently observed in all subgroups. However, these associations were more pronounced in statin users (P for interaction=0.0061), and individuals with obesity (P for interaction=0.0002), or diabetes (P for interaction<0.0001). The paradoxically increased hazards of all-cause mortality during follow-up in the categories of lower LDL-C levels were prominent in statin non-users (Fig. 3), individuals without diabetes, those without hypertension, and non-obese people (Supplementary Fig. 2), and this paradoxical association was attenuated in statin users and in individuals with diabetes, hypertension, or obesity (all P for interaction<0.0001). Particularly, in statin users, lower categories of LDL-C levels (70≤ LDL-C <100 mg/dL) were associated with a decreased hazard of all-cause mortality during follow-up compared to the reference (100≤ LDL-C <130 mg/dL). Furthermore, the increased hazard of all-cause death during follow-up in the highest categories of LDL-C was pronounced in statin users, individuals with diabetes, and those with hypertension.
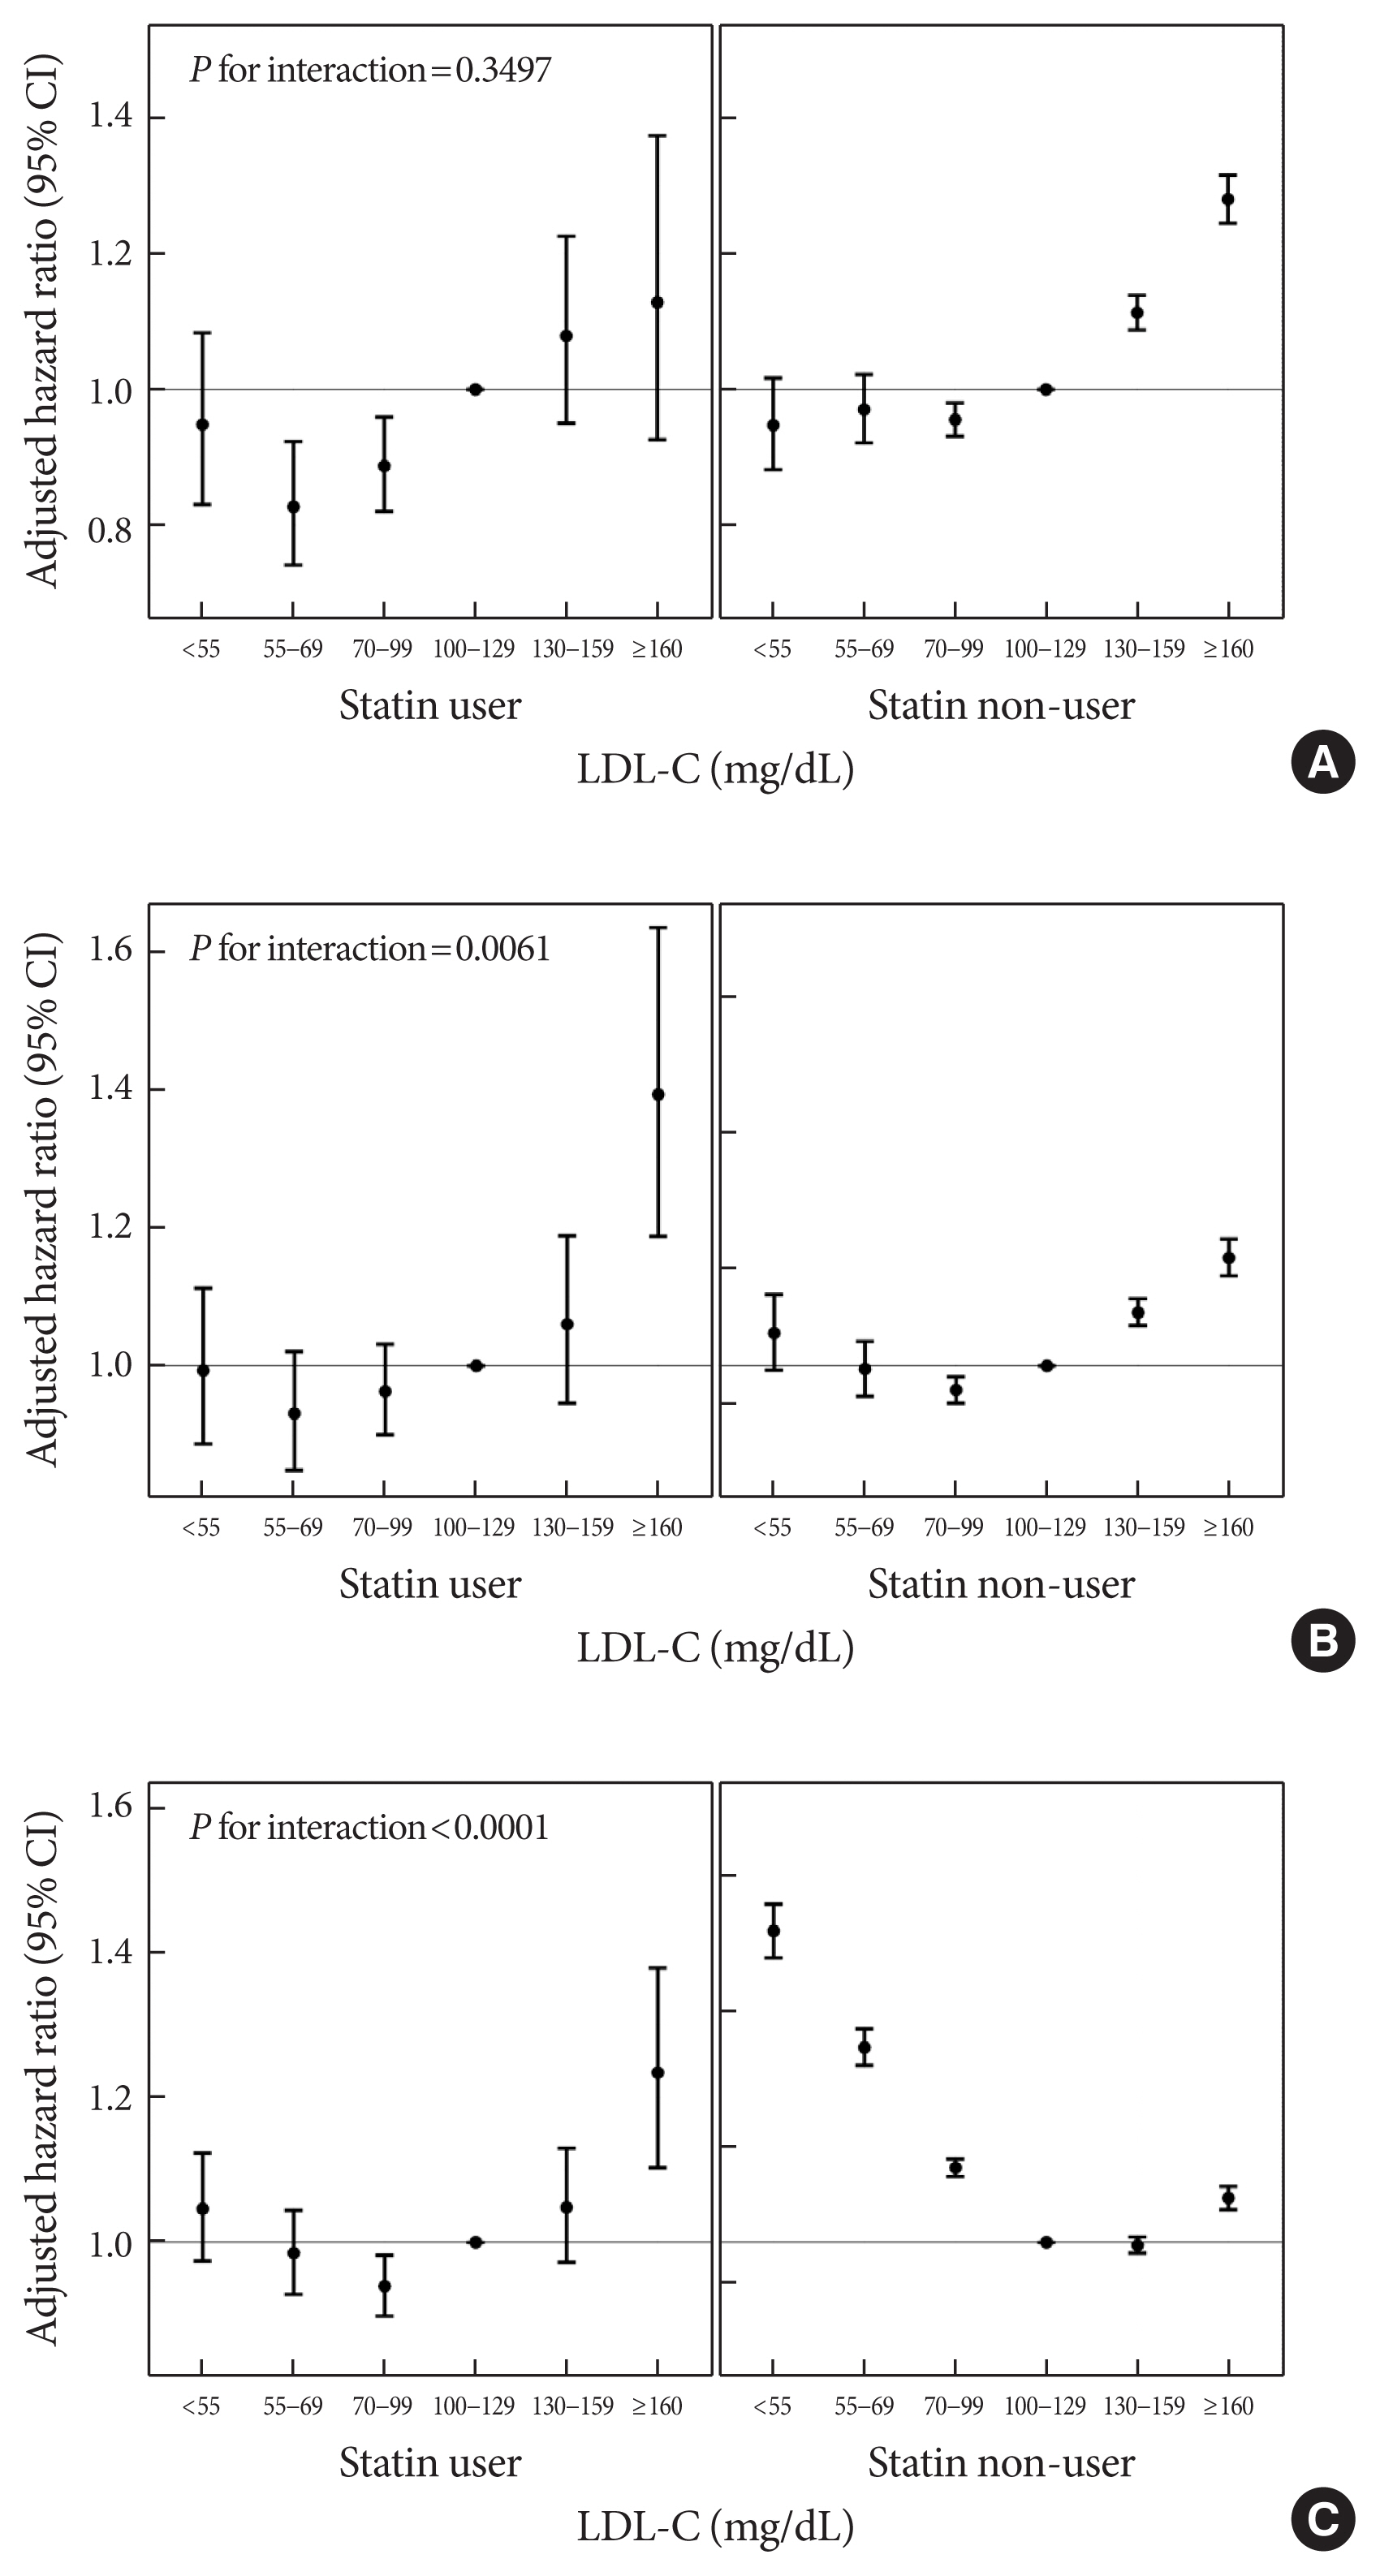
Adjusted hazard ratios and 95% confidence intervals (CIs) for the incidence of (A) myocardial infarction, (B) stroke, and (C) all-cause death during follow-up according to the ranges of low-density lipoprotein cholesterol (LDL-C) levels in subgroups stratified by statin use. Adjusted for age, sex, body mass index, current smoking, heavy alcohol consumption, regular exercise, low-income status, diabetes, hypertension, and statin use.
Sensitivity analyses
Stratified analyses according to the triglyceride (≥150 vs. <150 mg/dL) or HDL-C (≥40 mg/dL [in men], ≥50 mg/dL [in women] vs. lower) levels (Supplementary Tables 3–6), and sensitivity analysis restricting the study population to individuals aged ≥75 years (Supplementary Table 7) showed similar patterns of association although statistical significance was not secured in certain groups. Sensitivity analysis after excluding individuals who developed outcomes within 2 years from baseline (Supplementary Table 8) showed results consistent with those from the main analyses.
DISCUSSION
In this large-scale, nationwide, longitudinal study including 1,438,043 individuals aged ≥65 years without baseline ASCVDs, lower LDL-C levels were associated with decreased risks of incident MI and stroke. Although this association was consistently observed in all subgroups, especially for stroke, the protective effects of lower LDL-C levels were more pronounced in the elderly with obesity, or diabetes, and those using statins. Conversely, the hazard of all-cause death during follow-up was the lowest in those with 100≤ LDL-C <160 mg/dL, and below this range, the hazard increased as the LDL-C levels decreased, demonstrating an inverted J-shaped association between the LDL-C levels and the hazard of all-cause death during follow-up. However, this LDL-C paradox for the hazard of all-cause death during follow-up was attenuated in statin users and individuals with diabetes, hypertension, or obesity. In statin users, an advance in LDL-C categories was associated with increased hazards of all-cause death during follow-up.
After adjusting for potential confounders including smoking and alcohol history, regular exercise, BMI, diabetes, hypertension, and statin use, lower levels of LDL-C were associated with reduced hazards of incident MI and stroke also in older adults, and these findings were consistent across all subgroups. Particularly for the hazard of stroke, these associations were more pronounced in the elderly with obesity, or diabetes, and those with statin use. In terms of the hazard of MI, a significant interaction was observed according to the presence of diabetes or obesity. These results suggest that the aggressive lowering of LDL-C levels in the elderly might have greater benefits, especially for the prevention of stroke, among individuals with major cardiovascular risk factors. Although the risk of stroke was not examined, Bezin et al. [30] reported that a reduction in acute coronary syndrome or all-cause mortality by statin in the elderly was pronounced in those with modifiable cardiovascular risk factors (diabetes or cardiovascular medications) and those with history of CHD, and this benefit was attenuated and became unapparent in the elderly without cardiovascular risk factors treated in primary prevention.
In this elderly population, the divergence in outcome hazards according to LDL-C categories was slightly more pronounced when analyzed for incident MI rather than for stroke. Furthermore, findings were more robust across all subgroups with respect to the hazard of MI. These might be related to the etiologically heterogenous stroke subtypes, although we could not confirm this possibility due to the unavailability of data on stroke subtypes. A recent Mendelian randomization study on relative effects of LDL-C on ischemic stroke and CHD [31] demonstrated that genetic variants that confer lifelong LDL-C differences exhibited a weaker effect on ischemic stroke than on CHD, and this effect was particularly weak for cardioembolic stroke.
With respect to all-cause mortality during follow-up, the LDL-C paradox was observed among older adults. However, this paradox was attenuated in subgroups with diabetes, hypertension, or obesity (who are more likely to be treated with intensive statin therapy), and statin users. In contrast to the LDL-C paradox for the hazard of all-cause death during follow-up in the elderly not using statins, the advancing LDL-C categories were associated with an increased hazard of all-cause death during follow-up in the elderly using statins. These results suggest that the paradoxical association between low LDL-C and hazards of all-cause death during follow-up among the statin non-users aged ≥65 years may not originate from the causative role of low LDL-C itself. Rather, other unfavorable factors that can lead to decreased LDL-C levels, such as malnutrition, cachexia, infection, and/or chronic inflammation [32,33], may be contributing factors. Furthermore, reduced cholesterol absorption efficiency accompanied by inefficiently compensated cholesterol synthesis in the elderly [34] may impact this paradoxical association. However, low LDL-C levels achieved by statin use were associated with a decreased hazard of all-cause death during follow-up, indicating that the LDL-C paradox for the risk of all-cause mortality during follow-up in older adults should not be applied to those using statins. Low LDL-C levels achieved by the treatment for the prevention of cardiovascular disease in statin users may have different implications from those likely to be lowered by other unfavorable factors including malnutrition, cachexia, and/or chronic inflammation in statin non-users. Similarly, Liang et al. [11] reported that the inverse association between high total cholesterol and reduced all-cause mortality in older adults was mainly due to non-cardiovascular mortality, and this inverse association was evident only among those not treated with cholesterol-lowering medications. Furthermore, a beneficial effect of statin as a primary prevention for stroke and all-cause death has been demonstrated in a nationwide, nested case-control study conducted among adults aged ≥75 years [35]. Therefore, we speculate that even in the elderly without previous ASCVD, physicians should not hesitate to use intensive statin therapy for individuals with major cardiovascular risk factors.
Limitations of this study should be acknowledged. First, as an observational study, clarification of the causal relationships is unavoidably limited. However, we excluded individuals with claims for ischemic heart disease and/or stroke at or before baseline to minimize the potential reverse causality effect. Furthermore, sensitivity analysis after excluding individuals who developed outcomes within 2 years from baseline demonstrated consistent findings. Second, since the study population consisted of a single ethnicity (Koreans), extrapolation of our findings to populations with other ethnicities should be cautious. Third, statin use was defined based on the information for prescriptions, while the actual intake might vary from the prescription data. However, the actual exposure to medications has been reported to have good correlation with prescriptions [36,37], and the prescription data have been used widely in real-world observational studies exploring the effects of medication [38-40]. Fourth, with this KNHIS database, the specific cause of death could not be determined although cardiovascular mortality and non-cardiovascular mortality during follow-up may have varied patterns of association with LDL-C levels. Fifth, Friedewald-derived LDL-C estimates were used instead of directly measured LDL-C levels. Although Friedewald-derived estimates have been reported to have high correlation with directly measured values, LDL-C levels might be underestimated at high triglyceride or low HDL-C levels [41]. Considering that the two groups with LDL-C <70 mg/dL exhibited the highest triglyceride levels (Table 1), the protective effect of the lowest LDL-C categories might have been underestimated due to the misclassification of individuals with hypertriglyceridemia into the lower LDL-C categories. Lastly, since stroke was defined based on the information on diagnostic codes, hospitalization, and claims for brain imaging, we could not competely discriminate hemorrhagic stroke from ischemic stroke and could not differentiate etiological subtypes of strokes. Despite these limitations, our study has strengths. We used a nationwide cohort database validated and managed by the Korean government. Information on lifestyle, anthropometric, and laboratory measures for more than 1.39 million older adults (aged ≥65 years) were collected, which enabled us to adjust for various potential confounders.
In conclusion, consistent with previous studies in younger adults, this study demonstrated an association between decreased LDL-C levels and lower risks of incident MI and stroke in older adults aged ≥65 years. This association was more prominent in those with diabetes, obesity, or statin use. In terms of the risk of all-cause mortality during follow-up, the LDL-C paradox was observed among older adults aged ≥65 years. However, this paradox was attenuated in subgroups with diabetes, hypertension, obesity, or statin use. Furthermore, low LDL-C levels achieved by statin in older adults was associated with a decreased risk of all-cause death during follow-up, indicating that the LDL-C paradox for the risk of all-cause death during follow-up in older adults should not be extrapolated to statin users. Therefore, even in the elderly without previous ASCVD, intensive statin treatment should not be hesitated for individuals with major cardiovascular risk factors, who might have greater benefits through aggressive lowering of LDL-C levels.
SUPPLEMENTARY MATERIALS
Supplementary materials related to this article can be found online at https://doi.org/10.4093/dmj.2021.0225.
Details on the Korean National Health Insurance Service datasets
Definitions of ovariates
HRs and 95% CIs for the incidence of myocardial infarction, stroke, and all-cause death during follow-up according to the ranges of LDL-C level, setting the LDL-C range with the lowest hazard as a reference
HRs and 95% CIs for the incidence of myocardial infarction, stroke, and all-cause death during follow-up according to the ranges of LDL-C level among older adults with triglyceride level ≥150 mg/dL
HRs and 95% CIs for the incidence of myocardial infarction, stroke, and all-cause death during follow-up according to the ranges of LDL-C level among older adults with triglyceride level <150 mg/dL
HRs and 95% CIs for the incidence of myocardial infarction, stroke, and all-cause death during follow-up according to the ranges of LDL-C level among older adults with low HDL-C levela
HRs and 95% CIs for the incidence of myocardial infarction, stroke, and all-cause death during follow-up according to the ranges of LDL-C level among older adults without low HDL-C levela
HRs and 95% CIs for the incidence of myocardial infarction, stroke, and all-cause death during follow-up according to the ranges of LDL-C level among individuals aged ≥75 years
HRs and 95% CIs for the incidence of myocardial infarction, stroke, and all-cause death during follow-up according to the ranges of LDL-C level, sensitivity analysis after excluding individuals who developed outcomes within 2 years from baseline
Flow diagram of participant selection.
Adjusted hazard ratios and 95% confidence intervals (CIs) for the incidence of myocardial infarction, stroke, and all-cause death during follow-up according to the ranges of low-density lipoprotein cholesterol (LDL-C) levels in subgroups stratified by age group, sex, presence of diabetes, hypertension, and obesity. Adjusted for age, sex, body mass index, current smoking, heavy alcohol consumption, regular exercise, low-income status, diabetes, hypertension, and statin use.
ACKNOWLEDGMENTS
This work was performed using the database from the Korean National Health Insurance Service (KNHIS). The National Health Information Database constructed by the KNHIS (NHIS-2020-1-373 and NHIS-2021-1-553) was used, and the results do not necessarily represent the opinion of the KNHIS.
Notes
CONFLICTS OF INTEREST
Hye Jin Yoo has been associate editor of the Diabetes & Metabolism Journal since 2020. She was not involved in the review process of this article. Otherwise, there was no conflict of interest.
AUTHOR CONTRIBUTIONS
Conception or design: Y.B.L., K.M.C., S.H.B., G.J.C., H.J.Y.
Acquisition, analysis, or interpretation of data: M.K., E.N., S.Y.H., J.A.K., E.R., S.H.
Drafting the work or revising: Y.B.L., H.J.Y.
Final approval of the manuscript: Y.B.L., M.K., E.N., S.Y.H., J.A.K., E.R., S.H., K.M.C., S.H.B., G.J.C., H.J.Y.
FUNDING
Dr. Hye Jin Yoo was supported by the Basic Science Research Program through the National Research Foundation of Korea, funded by the Ministry of Education (R2106541) and by the Korea Medical Device Development Fund grant funded by the Korea government (the Ministry of Science and ICT, the Ministry of Trade, Industry and Energy, the Ministry of Health & Welfare, the Ministry of Food and Drug Safety) (Project Number: 9991007469, KMDF_PR_20200901_0233). This research was also supported by a grant of the Korea Health Technology R&D Project through the Korea Health Industry Development Institute (KHIDI), funded by the Ministry of Health & Welfare, Republic of Korea (grant number: HR20C0021). The funding sources had no role in the design or conduct of the study; collection, management, analysis, or interpretation of the data; preparation, review, or approval of the manuscript; or the decision to submit the manuscript for publication.