DA-1241, a Novel GPR119 Agonist, Improves Hyperglycaemia by Inhibiting Hepatic Gluconeogenesis and Enhancing Insulin Secretion in Diabetic Mice
Article information

Abstract
Background
We investigated the antidiabetic effects of DA-1241, a novel G protein-coupled receptor (GPR) 119 agonist, in vitro and in vivo.
Methods
DA-1241 was administrated to high-fat diet (HFD)-fed C57BL/6J mice for 12 weeks after hyperglycaemia developed. Oral/intraperitoneal glucose tolerance test and insulin tolerance test were performed. Serum insulin and glucagon-like peptide-1 (GLP-1) levels were measured during oral glucose tolerance test. Insulinoma cell line (INS-1E) cells and mouse islets were used to find whether DA-1241 directly stimulate insulin secretion in beta cell. HepG2 cells were used to evaluate the gluconeogenesis and autophagic process. Autophagic flux was evaluated by transfecting microtubule-associated protein 1 light chain 3-fused to green fluorescent protein and monomeric red fluorescent (mRFP-GFP-LC3) expression vector to HepG2 cells.
Results
Although DA-1241 treatment did not affect body weight gain and amount of food intake, fasting blood glucose level decreased along with increase in GLP-1 level. DA-1241 improved only oral glucose tolerance test and showed no effect in intraperitoneal glucose tolerance test. No significant effect was observed in insulin tolerance test. DA-1241 did not increase insulin secretion in INS-1E cell and mouse islets. DA-1241 reduced triglyceride content in the liver thereby improved fatty liver. Additionally, DA-1241 reduced gluconeogenic enzyme expression in HepG2 cells and mouse liver. DA-1241 reduced autophagic flow in HepG2 cells.
Conclusion
These findings suggested that DA-1241 augmented glucose-dependent insulin release via stimulation of GLP-1 secretion, and reduced hepatic gluconeogenesis, which might be associated with autophagic blockage, leading to improved glycaemic control.
INTRODUCTION
Type 2 diabetes mellitus (T2DM) is characterized by the insulin secretion defect and increased insulin resistance [1]. Hyperglycaemia results from a defect in insulin secretion (β-cell dysfunction), hepatic glucose overproduction and peripheral insulin resistance. These features comprise the major characteristics of T2DM [1]. To alleviate these problems, extensive efforts have been made to develop drugs to improve insulin sensitivity and increase insulin secretion from pancreatic β-cells [2]. Recently, the G protein-coupled receptor 119 (GPR119) has emerged as a new therapeutic target for T2DM [3–5]. GPR119 is expressed in pancreatic β-cells, intestinal L-cells, and other tissues, such as the liver [6–8]. Activation of GPR119 leads to enhanced insulin secretion and improved glycaemic control [2,7]. These features of GPR119 make it a potential therapeutic target for T2DM. Several GPR119 agonists have been discovered and entered early clinical trial phases; however, they failed in phase II owing to the loss of efficacy within short duration and tachyphylaxis [5,9]. Unlike other GPR119 agonists, DA-1241 showed long-standing antidiabetic effects in diabetic animal models, as shown in a previous study [10–12]. DA-1241 was reported to exhibit sustained glucose-lowering effects without tachyphylaxis; additionally, it was shown to improve glucose and lipid metabolism [10–12]. These features of DA-1241 made it a promising antidiabetic drug candidate for T2DM.
GPR119 is also expressed in the liver [6,8]; however, its expression level in the liver was relatively lower than that in the pancreas. Although the liver plays an important role in lipid metabolism [13], little has been known about the role of GPR119 in lipid and glucose metabolism in the liver. Hepatic fat accumulation is closely related to hepatic insulin resistance [14,15], the major characteristic of T2DM. A significant portion of the accumulated triglycerides (TG) is derived from hepatic de novo lipogenesis, which increases under conditions of insulin resistance (hyperinsulinaemia) and non-alcoholic fatty liver disease (NAFLD) [14].
It is well known that the liver is the major organ involved in gluconeogenesis [13,15]. During fasting, liver autophagy plays a vital role in blood glucose regulation [16–18]. Amino acids produced from autophagic protein degradation are converted into glucose via gluconeogenesis to maintain the normal plasma glucose levels during fasting [16]. However, hepatic glucose overproduction owing to sustained gluconeogenesis is tightly associated with insulin resistance, a major pathogenic feature of T2DM [19]. The decline in the production of amino acids by autophagy is associated with a decrease in gluconeogenesis [16,18].
Therefore, in this study, we investigated the effects of DA-1241 on insulin secretion from pancreatic β-cells, serum glucagon-like peptide-1 (GLP-1) levels, and liver gluconeogenesis coupled with autophagy in vitro and in vivo. In addition, we evaluated the effects of DA-1241 on fatty liver disease and lipid profile.
METHODS
Cell culture and treatment
HepG2 cells were cultured in Dulbecco’s modified Eagle’s medium (DMEM; SH30243.01, Thermo Scientific, Waltham, MA, USA) supplemented with 10% fetal bovine serum (FBS) (Thermo Scientific, SH30071.03) and 1% penicillin-streptomycin (PS) (Thermo Scientific, SV30010). Prior to experiments, cells were starved for 24 hours in glucose- and serum-free media. Cells were treated with DA-1241 (1,000 nM) for 24 hours, and bafilomycin A1 (20 nM) (B1793, Sigma-Aldrich, St. Louis, St. Louis, MO, USA) was added for 2 hours at the end of time point. DA-1241 was obtained from Dong-A ST. Co. Ltd., Seoul, Korea. Insulinoma cell line (INS-1E) cells were cultured in Roswell Park Memorial Institute (RPMI) 1640 (Thermo Scientific, SH30027.01) medium supplemented with 10% FBS, 1% PS, and 50 μM β-mercaptoethanol. Prior to the assay, cells were preincubated in Krebs-Ringer bicarbonate buffer (KRBH) (30 mM HEPES, 10 mM NaHCO3, 120 mM NaCl, 4 mM KH2PO4, 1 mM MgSO4, 1 mM CaCl, and 0.2% bovine serum albumin, adjusted to pH 7.4) containing 1 mM glucose for 1 hour. All cells were incubated at 37°C in a humidified atmosphere containing 5% CO2.
Western blot analysis
Cells and tissues were lysed in radioimmunoprecipitation assay (RIPA) buffer, containing of 20 mM Tris-HCI (pH 7.5), 150 mM NaCI, 1 mM Na2 EDTA (ethylenediaminetetraacetic acid), 1 mM EGTA (egtazic acid), 1% NP-40 (ethoxylated nonylphenol), 1% sodium deoxycholate, 2.5 mM sodium pyrophosphate, 1 mM beta-glycerophosphate, 1 mM Na3Vo4, 1 μg/mL leupeptin (BRI-9010-010M, Tech & Innovation Co. Ltd., Chuncheon, Korea), and protease inhibitor and phosphatase cocktail (Thermo Scientific, 78440). Protein samples were separated using 10% and 15% polyacrylamide gels and transferred to polyvinylidene fluoride membranes (PVH00010, Millipore, Burlington, MA, USA). The membranes were incubated with the primary antibodies to measure the expression of the following proteins: glucose 6-phosphatase (G6Pase; ab83690, Abcam, Cambridge, UK), phosphoenolpyruvate carboxykinase (PEPCK; Abcam, ab28455), LC3 (Sigma, L7543) and p62 (sc-28359, Santa Cruz, Santa Cruz, CA, USA), and GFP (Abcam, ab13970). Horseradish peroxidase (HRP)-linked anti-mouse immunoglobulin G (IgG; 7076S, Cell signaling, Danvers, MA, USA) and anti-rabbit IgG (Cell signaling, 7074S) were used as secondary antibodies.
Analysis of autophagy flux by fluorescence microscopy
HepG2 cells were transfected with microtubule-associated protein 1 light chain 3-fused to green fluorescent protein and monomeric red fluorescent (mRFP-GFP-LC3) plasmid using Lipofectamine 2000 (1166-027, Invitrogen, Waltham, MA, USA) for 48 hours. Then, cells were fixed in 4% paraformaldehyde (PFA) in phosphate buffer (pH 7.4) for 10 minutes. After fixation, cells were washed with phosphate-buffered saline (three times for 5 minutes) and observed under LSM 700 confocal microscope.
Animal experiments
Four-week-old male C57BL/6J mice were housed under controlled conditions (21°C±2°C, 60%±10% humidity, 12-hour light/12-hour dark cycle). Following acclimatisation, 5-week-old mice were supplemented with high-fat diet (HFD; 60% kcal fat, D12492, Research Diets Inc., New Brunswick, NJ, USA) (n=45) for 8 weeks prior to drug administration. Normal control mice (same age) were fed with normal chow diet (NC) (n=4). After 8 weeks, HFD-induced diabetic mice (blood glucose levels ≥250 mg/dL) were selected and randomised into two groups, HFD (n=10) and HFD+DA-1241 (120 mg/kg) (n=24) groups. Treatment was continued for 12 weeks. Blood glucose levels, body weight, and food intake were monitored weekly. After 12 weeks, mice were anaesthetised with tiletamine-zolazepam (Zoletil, 50 mg/kg; Virbac, Carros, France). Blood samples were collected and stored at −20°C, and liver tissues were isolated, immediately frozen in liquid nitrogen, and stored at −80°C until further analysis. All animal experiments were approved by the Institutional Animal Care and Use Committee at Yonsei University College of Medicine (2016-31-0512) and performed in accordance with relevant guidelines and regulations.
Glucose and insulin tolerance tests and total GLP-1 level measurement
For the oral glucose tolerance test (OGTT), overnight fasted mice were administered 40% glucose (2 g/kg body weight) via oral gavage. Blood glucose levels were measured at 0, 30, 60, 90, and 120 minutes during OGTT. Blood was collected into microcentrifuge tubes, and serum was separated by centrifugation. Serum insulin levels were assessed using a mouse insulin enzyme-linked immunosorbent assay (ELISA) kit (Morinaga Institute of Biological Science Inc., Yokohama, Japan). For total GLP-1 level measurement, blood samples at 0 and 15 minutes time points during the OGTT were collected into tubes containing dipeptidyl peptidase 4 inhibitor (1 mM) (sitagliptin phosphate monohydrate, 1757-1G, BioVision, Milpitas, CA, USA), and serum total GLP-1 level was measured using a GLP-1 total ELISA kit (Cat. #EZGLP1T-36K, Millipore). Insulin tolerance tests (ITTs) were carried out after 4-hour fasting. Insulin (0.75 U/kg) (Sigma-Aldrich, 9177C) was injected insulin intraperitoneally, and blood glucose levels were measured as previously described. In the intraperitoneal glucose tolerance test (GTT), overnight fasted mice were administered glucose intraperitoneally, and blood glucose levels were measured as previously described.
Insulin release assay
Following preincubation as described above, INS-1E cells were washed twice with KRBH and incubated with DA-1241 (1,000 nM) in KRBH containing 2.8 or 16.7 mM glucose for 1 hour. After incubation, the supernatant was centrifuged at 3,000 rpm for 3 minutes, and aliquot of the supernatant was stored at −20°C for analysis. Mouse pancreatic islets were isolated as previously described [20]. Islets were preincubated in low (2.8 mM) glucose for 30 minutes and then, incubated in high (16.7 mM) glucose. Media was collected at 0, 15, 30, 60, and 90 minutes. after high concentration of glucose challenge in both control group and DA-1241 (1,000 nM) treated group. Insulin secretion was measured using a mouse insulin ELISA kit.
Serum lipid profile and fatty liver analysis
Serum samples were sent to RaonBio (Yongin, Korea) for assessment of total TG and cholesterol levels. Hepatic TG contents were measured using a TG quantification kit (Abcam, ab65336).
H&E staining
Tissues were fixed in 4% PFA, embedded in paraffin, and stained with H&E. Lipid accumulation was analysed by an electron microscope.
Statistical analysis
All data were expressed as the mean±standard error of the mean. Statistical analyses were performed using GraphPad Prism version 5 (GraphPad Software, San Diego, CA, USA). Differences between two groups were analysed by Student’s t-test. One-way or two-way analysis of variance (ANOVA) followed by Bonferroni’s post hoc comparison test was used for multiple group comparisons. P values <0.05 were considered statistically significant.
RESULTS
Effects of DA-1241 on glucose tolerance in HFD-fed mice
The scheme of diet and treatment duration is shown in Supplementary Fig. 1. As shown in Fig. 1A-C, body weight gain and food intake were not different between the HFD and DA-1241 groups. Although random blood glucose level was not significantly different between the two groups (Fig. 1D), fasting blood glucose was significantly lower in the DA-1241 group than that in the HFD group (P<0.01) (Fig. 1E).

Basal metabolic rate characterization. During the study period, body weight, random blood glucose levels, and food intake were monitored weekly. (A) Body weight. (B) Body weight after 12 weeks of study period. There was no significant difference in body weight among groups. (C) Food intake. (D) Average random blood glucose level. (E) Fasting blood glucose level after 12 weeks of study period. Random blood glucose level was not different among groups; however, fasting blood glucose level was considerably reduced in the DA-1241 group. Data are presented as the mean±standard error of the mean. aP<0.01, compared with high-fat (HF) group (chow, n=4; HF, n=10; DA-1241, n=24), bP<0.001.
OGTT showed improved glucose tolerance in the DA-1241 group, compared to that in the HFD group (P<0.01) (Fig. 2A and B). However, intraperitoneal GTT revealed that there was no significant difference in the area under the curve (AUC) between the two groups (P=0.306) (Fig. 2C and D). In addition, insulin tolerance was not different between the HFD and DA-1241 groups (P=0.599) (Fig. 2E and F).
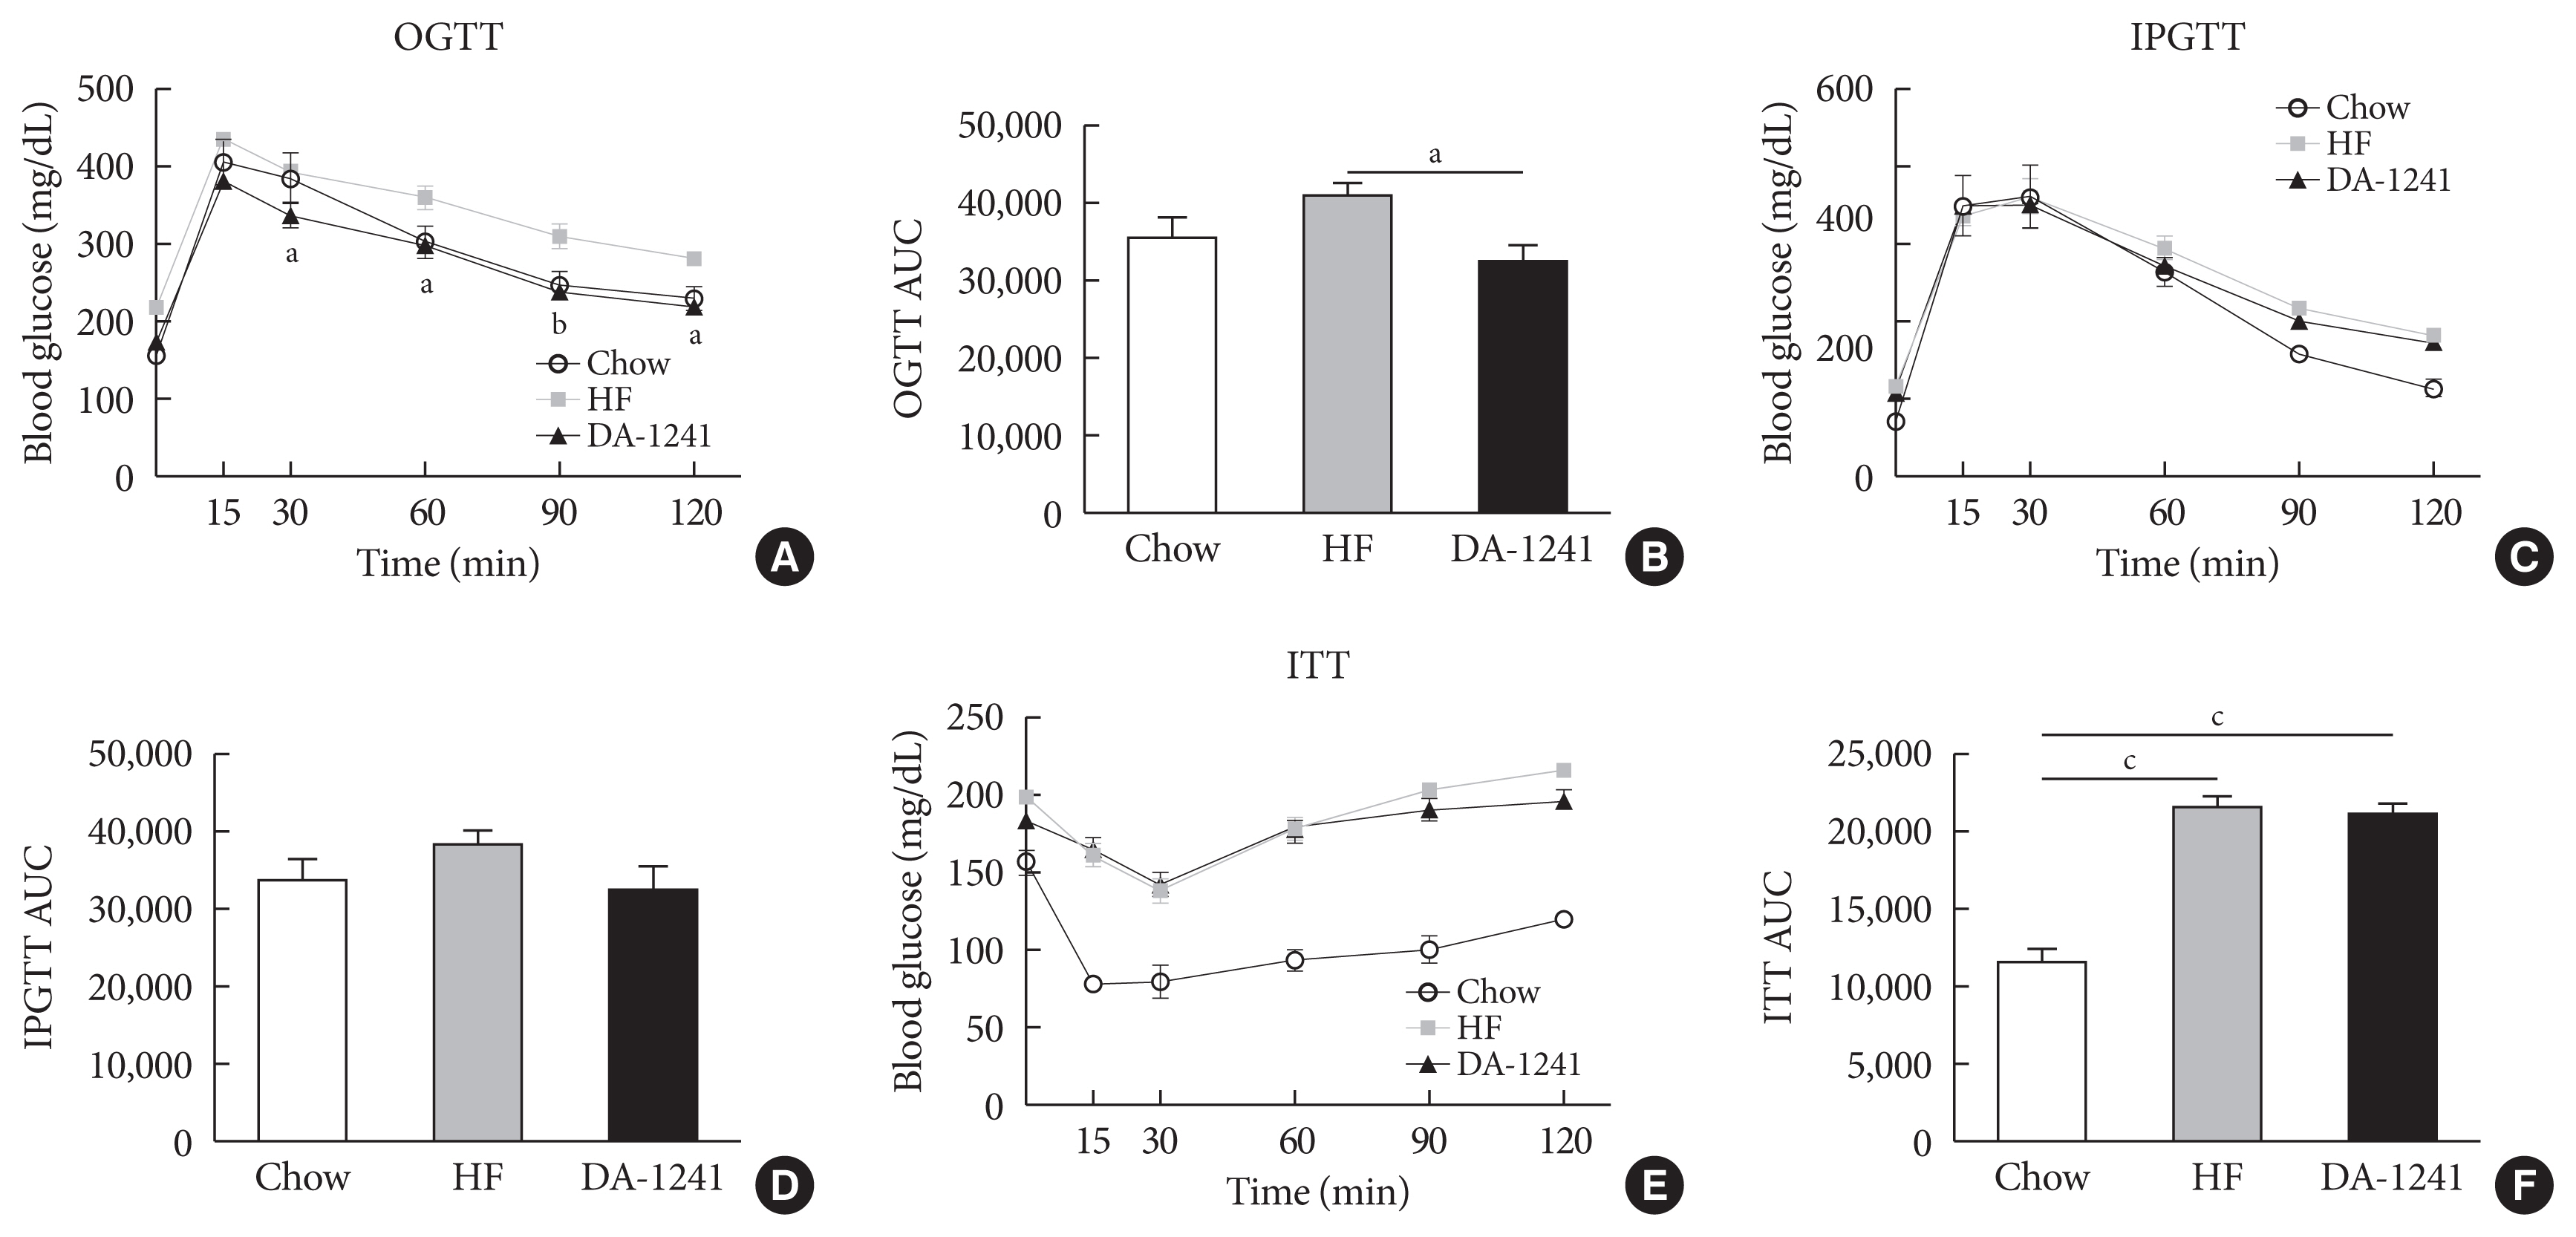
Effects of DA-1241 on glucose tolerance and insulin tolerance tests (ITTs) in high-fat (HF) diet-fed mice. (A, B) Blood glucose excursion and area under the curve (AUC) during oral glucose tolerance test (OGTT) at week 8. DA-1241 improved glucose tolerance with a substantial decrease in AUC during OGTT. (C, D) Blood glucose excursion and AUC during intraperitoneal glucose tolerance test (IPGTT) at week 11. (E, F) Glucose levels and AUC during ITT at week 10. No significant differences in AUC of intraperitoneal GTT and ITT were observed between the HF diet and DA-1241 groups. Data are presented as the mean±standard error of the mean. aP<0.05, bP<0.01, compared with HF group (chow, n=4; HF, n=10; DA-1241, n=24), cP<0.001.
Effects of DA-1241 on serum GLP-1 and insulin levels during OGTT
Serum insulin levels increased in both the HFD and DA-1241 groups compared to the levels in the chow group (Fig. 3A and B). The extent of increase in serum insulin level 30 minutes after oral glucose challenge was significantly higher in the DA-1241 group than that in the HFD group (P<0.05) (Fig. 3B). To represent insulin resistance, we have assessed homeostatic model assessment for insulin resistance (HOMA-IR) from HOMA-IR=glucose (mg/dL)×insulin (μIU/mL)/405 [21]. DA-1241 increased the insulinogenic index, compared to that in the HFD group (Supplementary Fig. 2A). Matsuda index, a whole body insulin sensitivity index [22], revealed that insulin resistance was not different between the DA-1241 and HF groups (Supplementary Fig. 2B). To determine whether the improvement in insulin secretion was attributed to direct insulin secretory response from the pancreatic β-cells, we investigated the effects of DA-1241 on insulin secretion in INS-1E cells. In glucose-stimulated insulin secretion (GSIS) assays, DA-1241 did not increase insulin secretion under high-glucose (16.7 mM) or in low-glucose conditions in INS-1E cells (Fig. 3C). In addition, we evaluated GSIS in isolated mouse pancreatic islets. DA-1241 did not show augmented insulin secretion in mouse islets in response to glucose challenge (Fig. 3D). The levels of serum total GLP-1 were measured during the OGTT. DA-1241 group exhibited higher total GLP-1 level than that in the HFD group (P<0.01) (Fig. 3E).
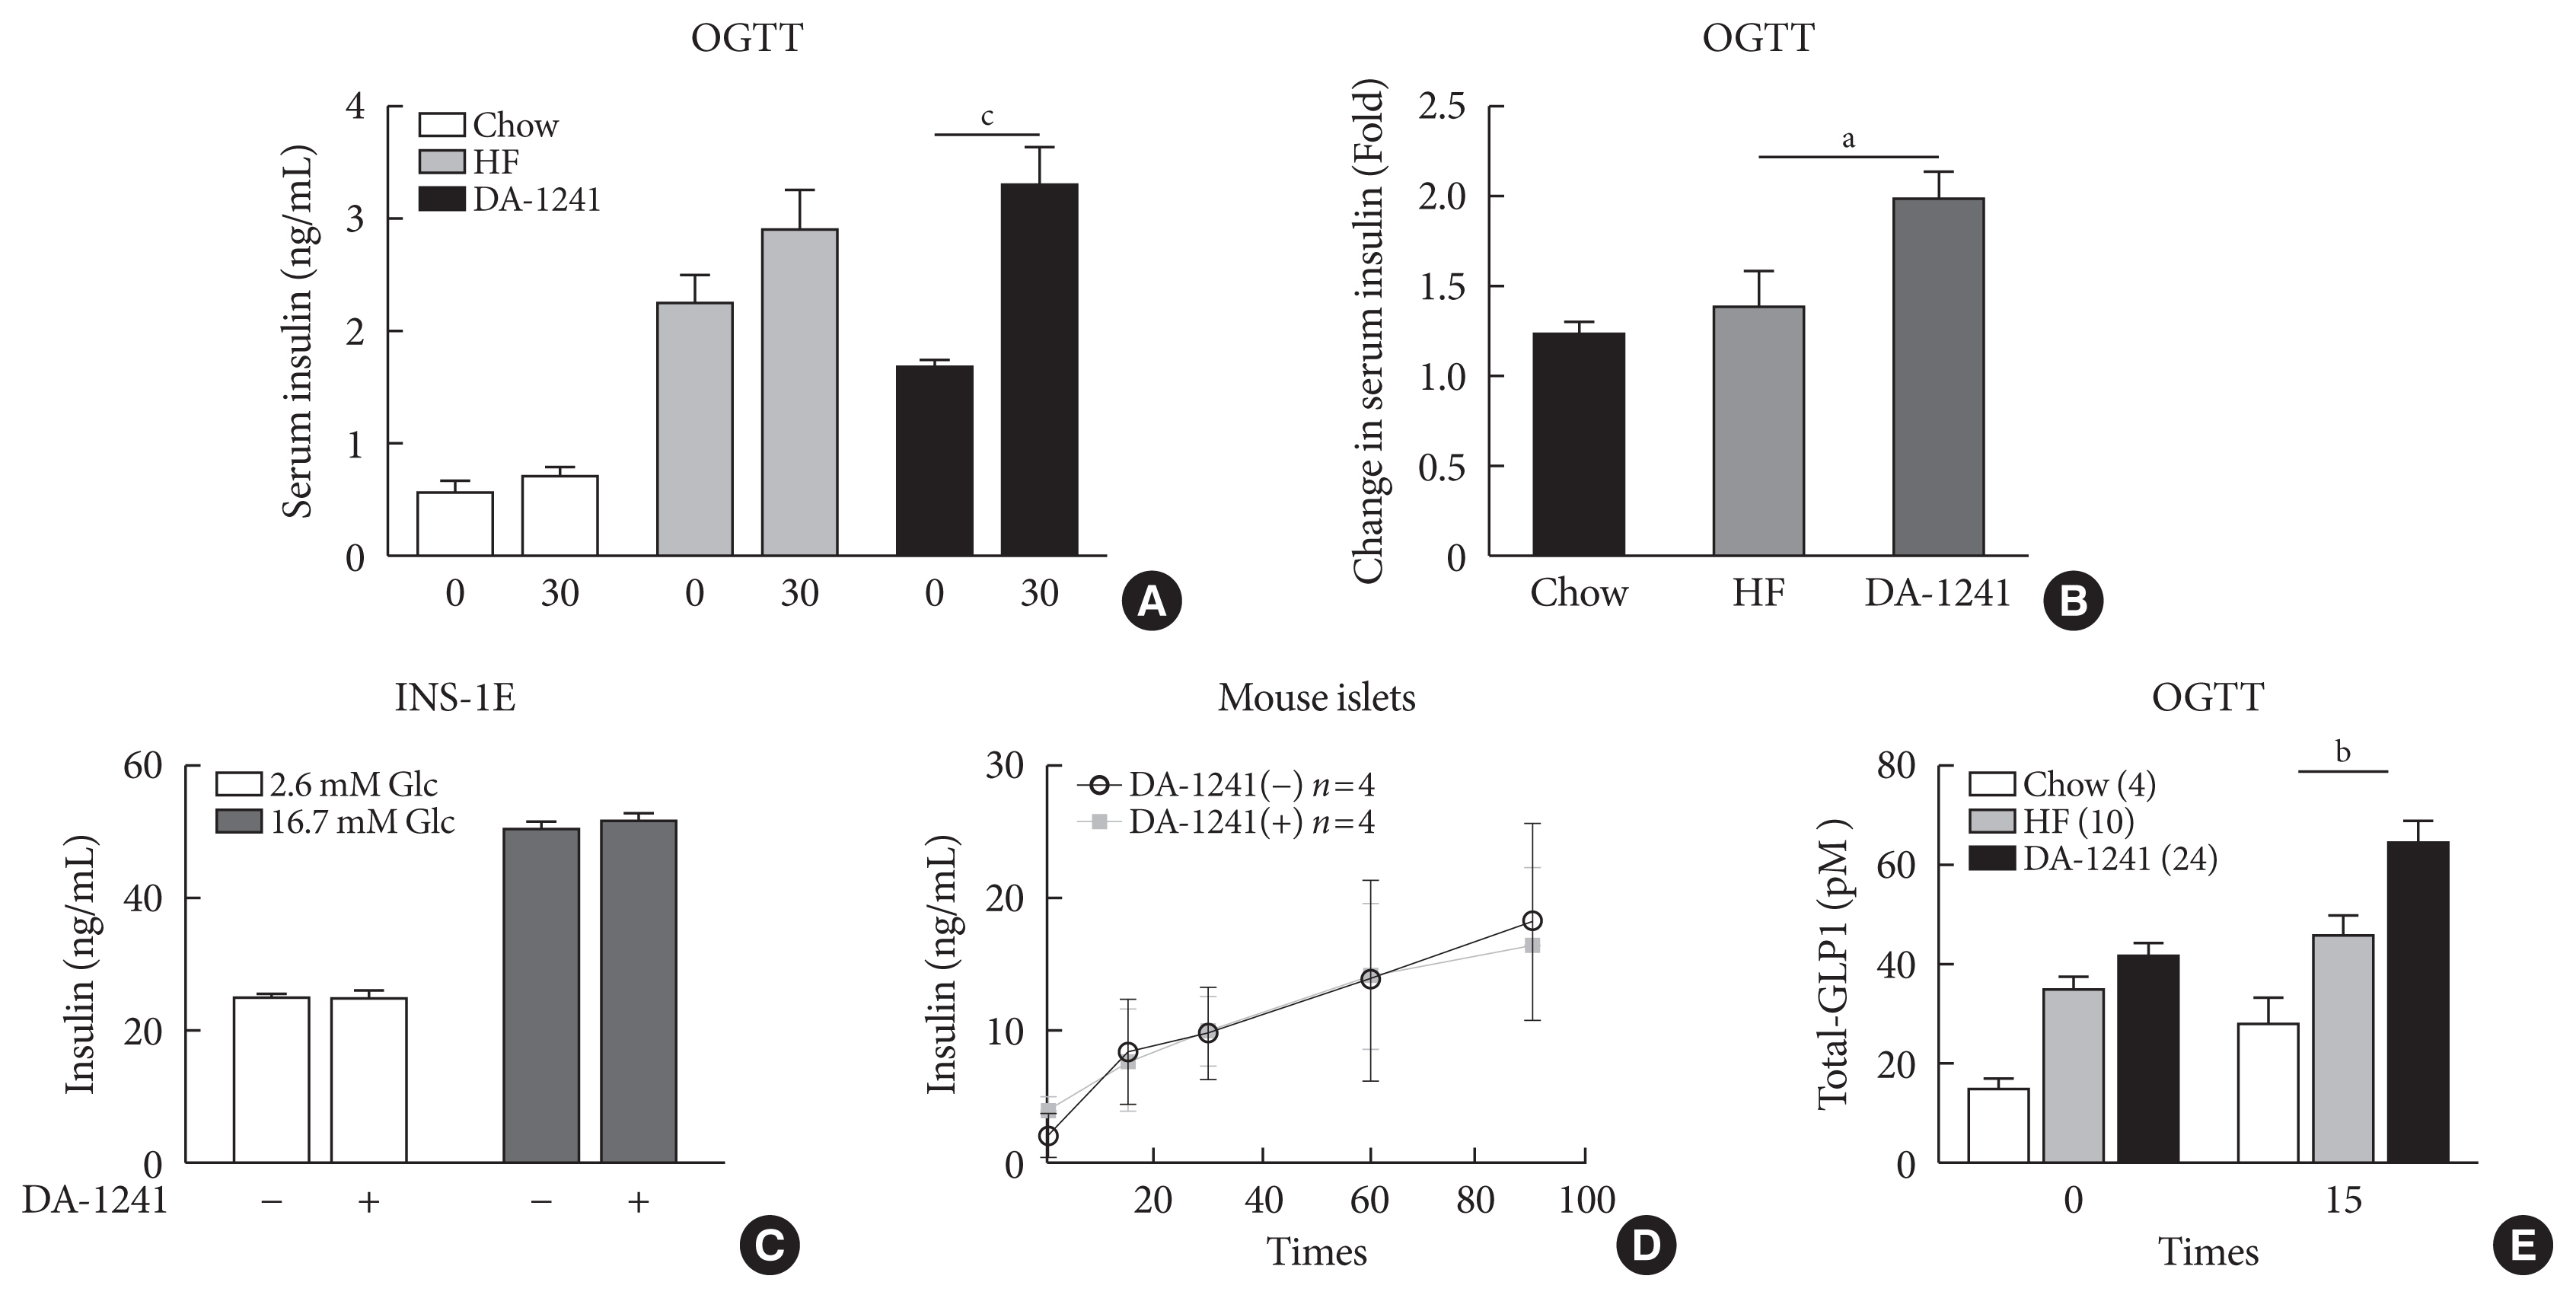
Measurement of insulin secretion and serum total glucagon-like peptide-1 (GLP-1) levels. (A) Serum insulin levels were determined at 0 and 30 minutes during oral glucose tolerance test (OGTT) at week 8. (B) Change in serum insulin levels during OGTT. The DA-1241 group exhibited enhanced insulin levels. (C) Insulin levels in insulinoma cell line (INS-1E) cells after incubation with DA-1241 for 1 hour under low- and high-glucose conditions. Measurements were carried out in triplicate. DA-1241 did not enhance insulin secretion from INS-1E cells in response to high glucose concentrations. (D) Islets were preincubated in low- (2.8 mM) glucose for 30 minutes and then, incubated in high (16.7 mM) glucose. Insulin levels in mouse islets after incubation with DA-1241 (1,000 nM) under high glucose conditions. Insulin group of five islets. (E) Serum total GLP-1 levels increased after DA-1241 treatment. Serum total GLP-1 levels were determined at 0 and 15 minutes during OGTT at week 8. Data are presented as the mean±standard error of the mean. aP<0.05, bP<0.01, compared with HF group (chow, n=4; high-fat [HF], n=10; DA-1241, n=24), cP<0.001.
Effects of DA-1241 on fatty liver and serum lipid profile
Liver tissues were collected from overnight-fasted mice after the 12-week study period. Liver sections were analysed by hematoxylin and eosin (H&E) staining. As shown in Fig. 4A, DA-1241 considerably diminished lipid accumulation, whereas the HFD group showed marked lipid accumulation. Hepatic TG contents decreased in the DA-1241 group to levels similar to those in the NC group (P<0.05) (Fig. 4B). DA-1241 group showed significant reduction of serum cholesterol levels, compared to those in the HFD group (P<0.01) (Fig. 4C). Serum TG contents were not different among the three groups (P=0.463) (Fig. 4D). We showed that DA-1241 improved fatty liver without changes in body weight (Fig. 1A and B).
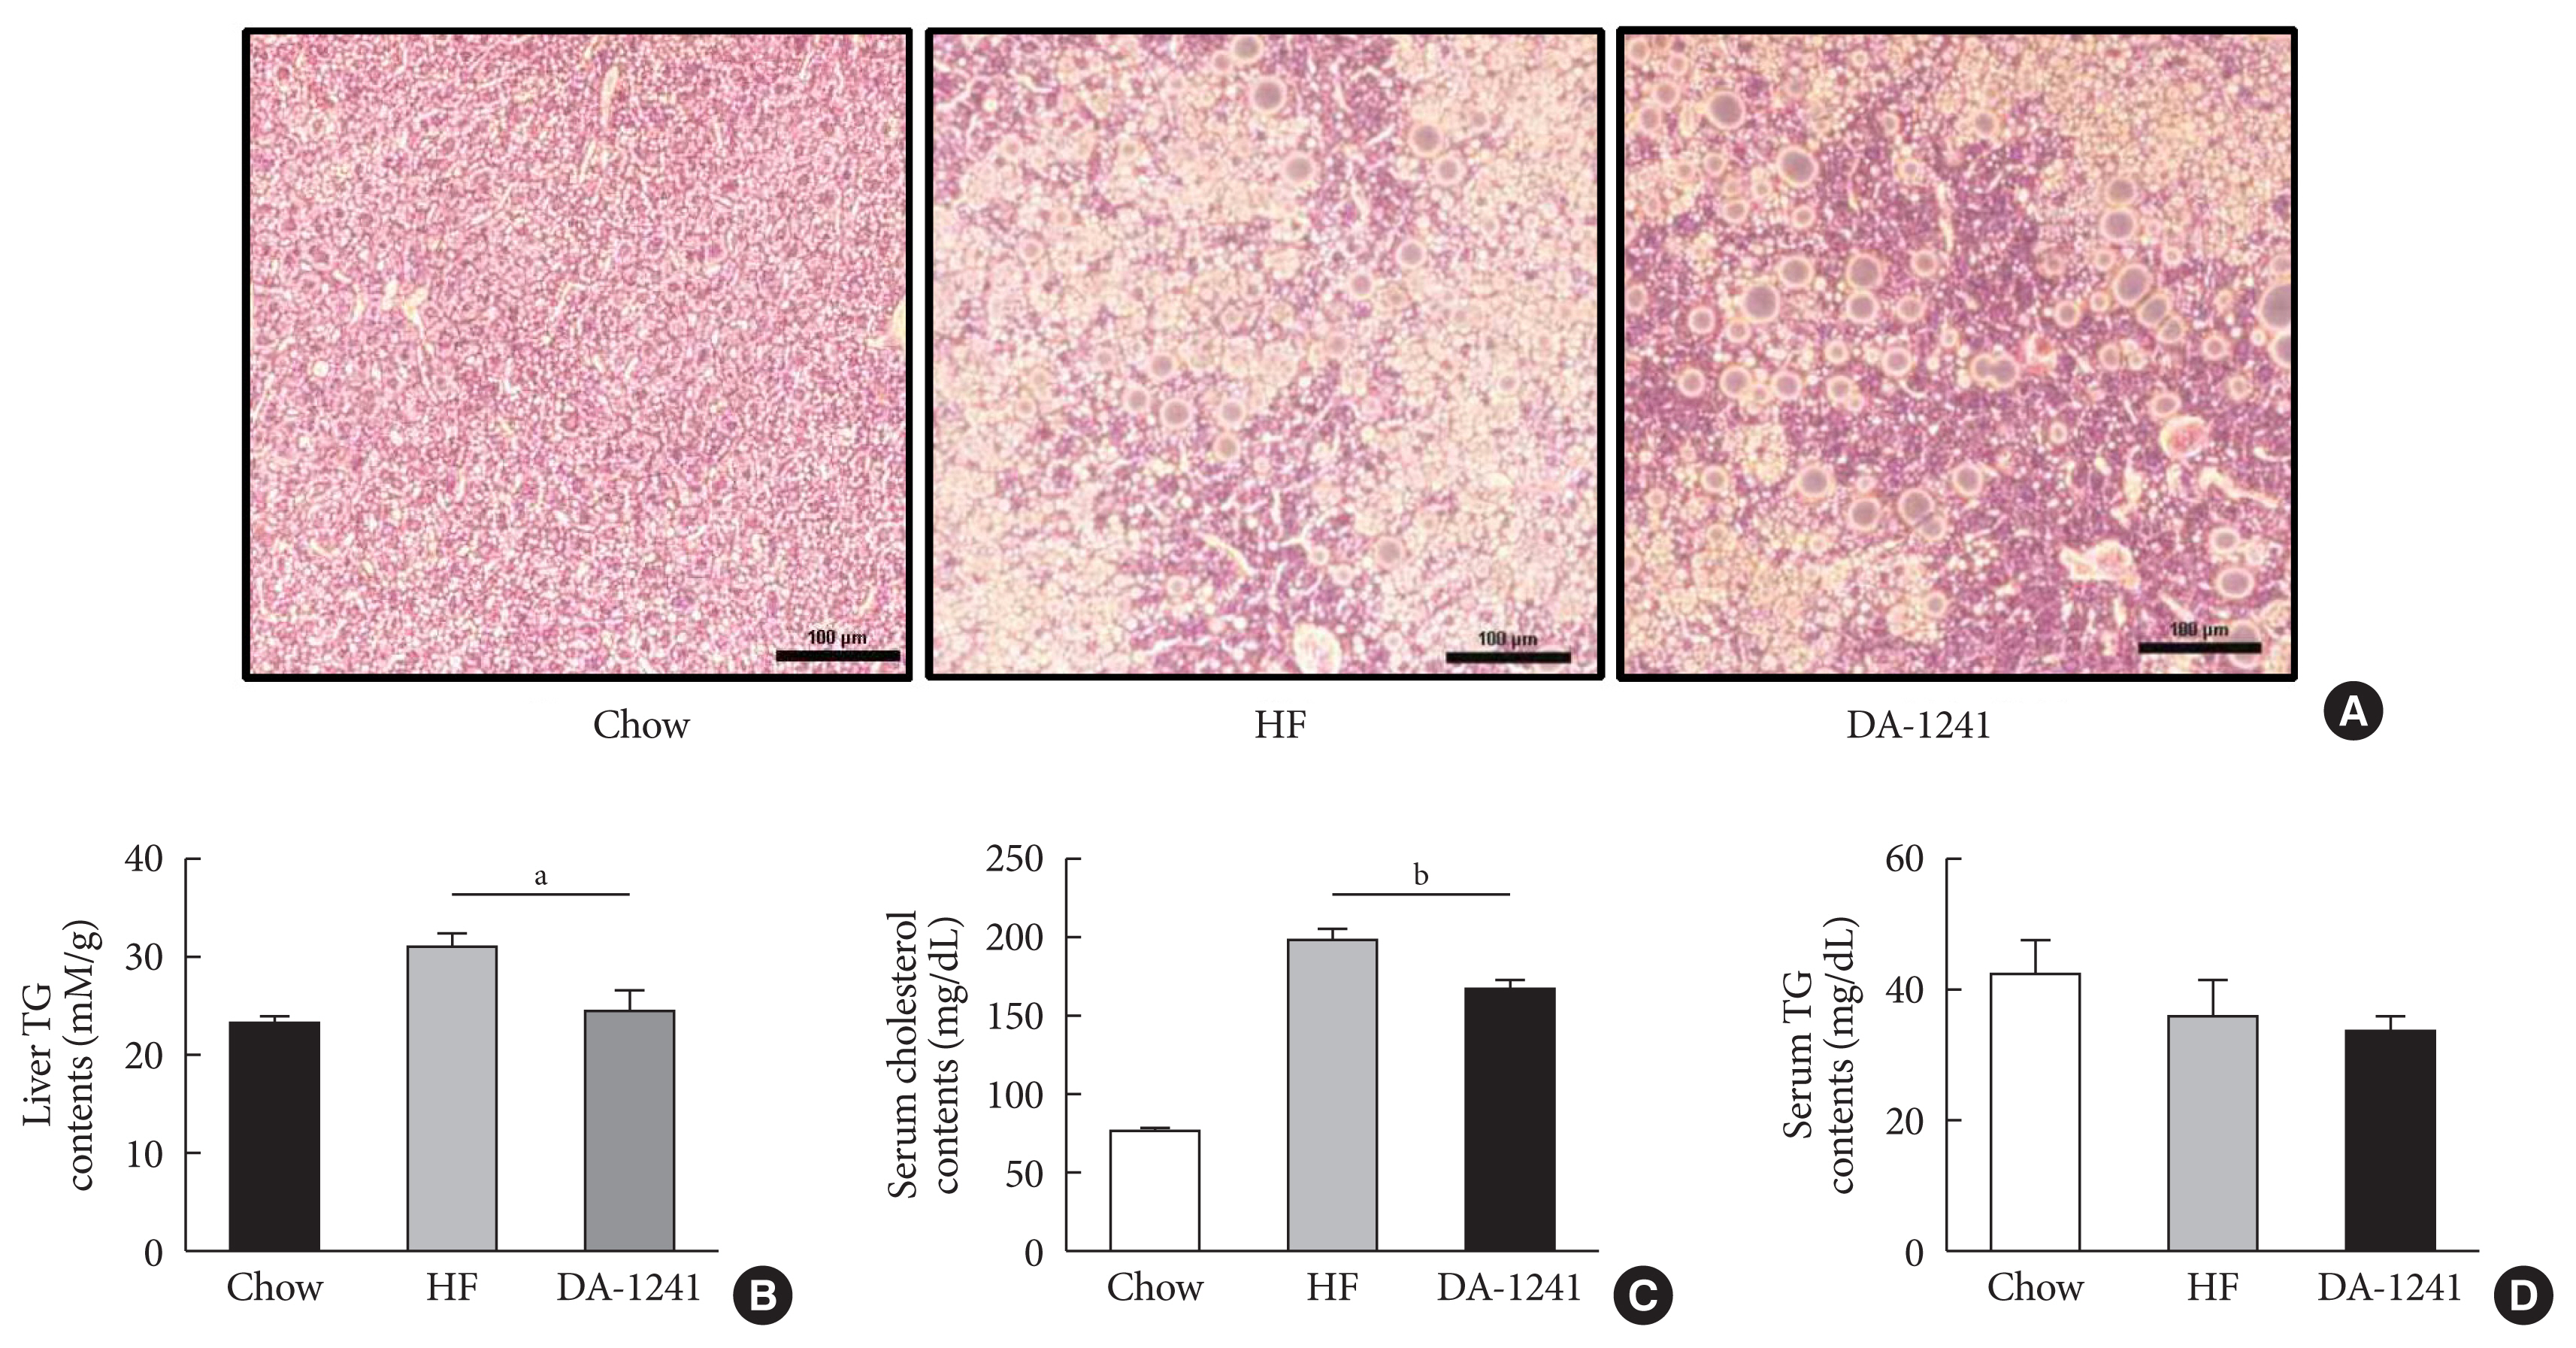
Effects of DA-1241 on fatty liver and serum lipid profile. Blood samples and liver tissues were collected from overnight-fasted mice after 12 weeks of study period. (A) Liver sections were analysed by H&E staining. Images were obtained using an electron microscope at 20× magnification. Hepatic lipid accumulation was markedly diminished in the DA-1241 group. (B) Liver triglyceride (TG), (C) serum cholesterol, and (D) serum TG contents were measured after 12 weeks of study period. The DA-1241 group showed a considerable decrease in liver TG and serum total cholesterol, but not in serum TG levels. Data are presented as the mean±standard error of the mean. aP<0.05, bP<0.01, compared with HF group (chow, n=4; high-fat [HF], n=10; DA-1241, n=24).
Effects of DA-1241 on gluconeogenic enzyme expression and autophagy flow
HepG2 cells were treated with DA-1241 for 24 hours under starved conditions. As shown in Fig. 5A, the expression of G6Pase and PEPCK, the rate-limiting enzymes in gluconeogenesis [13] decreased in DA-1241-treated cells. We measured protein level of PEPCK and G6Pase in the liver tissue of chow treated mice, HFD treated mice, and HFD+DA-1241 treated mice. G6PC and PEPCK protein expression increased with HFD, DA-1241 treatment attenuated the protein expression of both gluconeogenic enzymes (Fig. 5B).
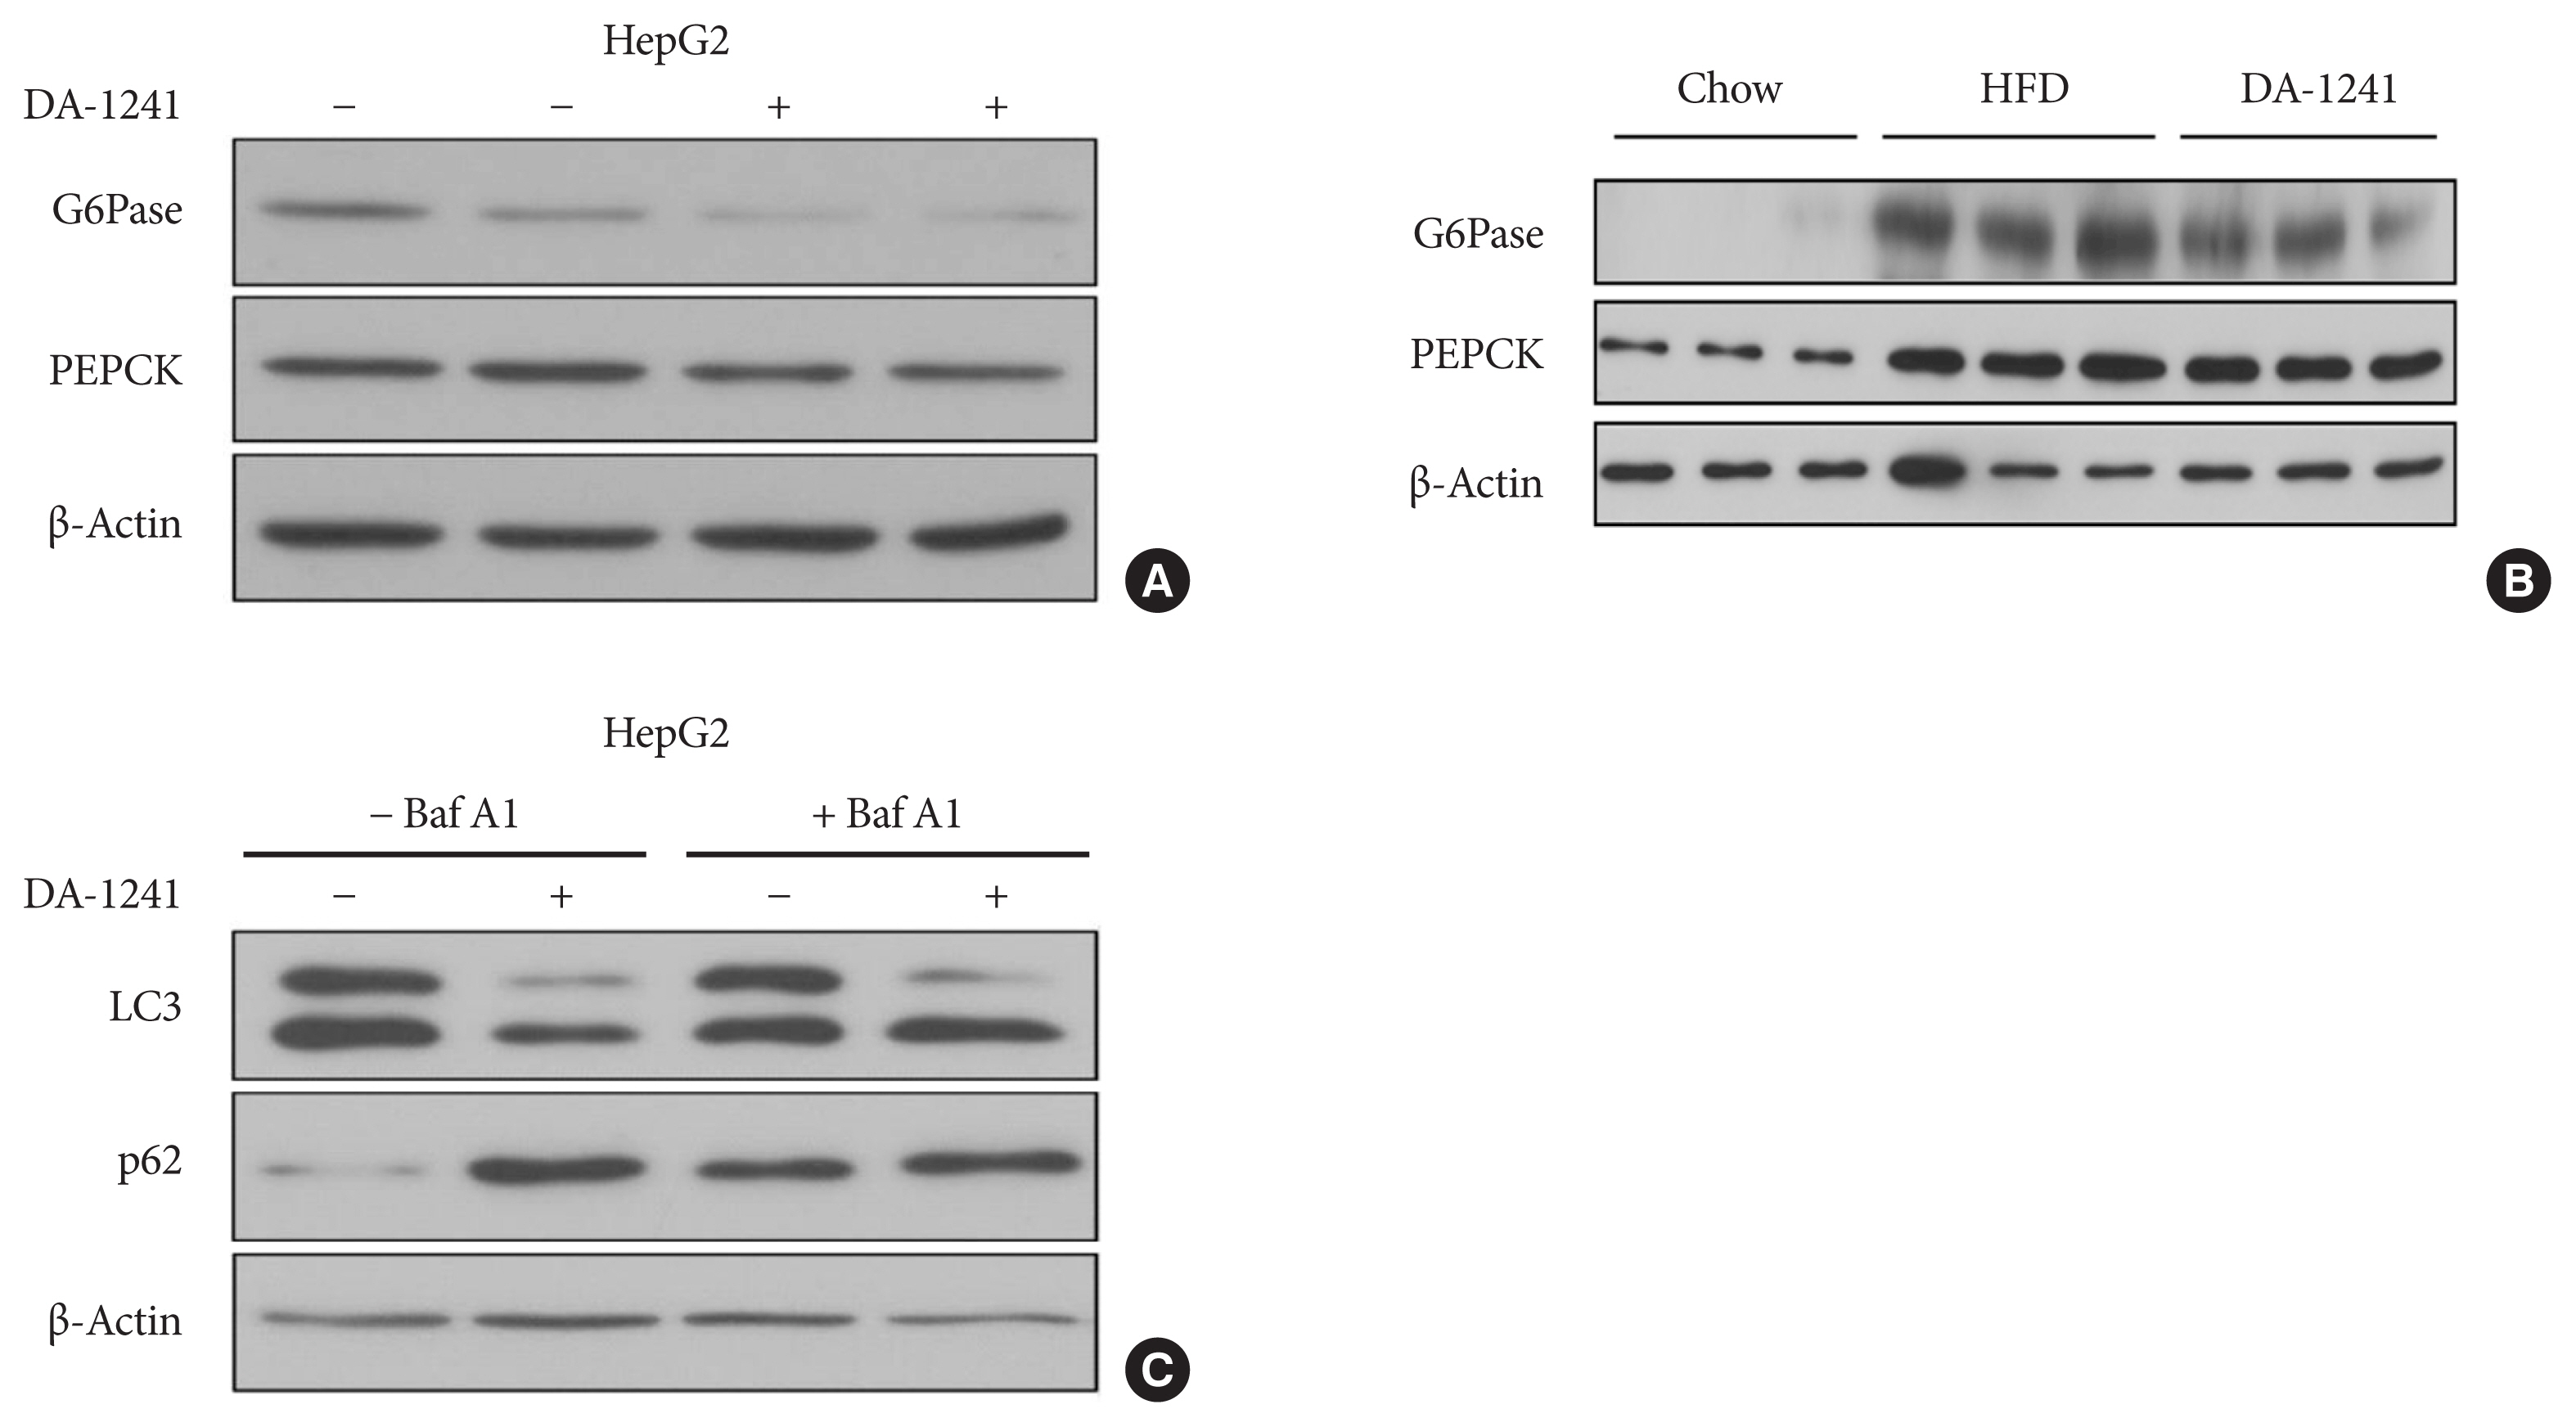
Effects of DA-1241 on gluconeogenic and autophagic enzyme expression. (A) Protein expression levels of glucose 6-phosphatase (G6Pase) and phosphoenolpyruvate carboxykinase (PEPCK) in HepG2 cells treated with DA-1241 (1,000 nM) for 24 hours under starvation conditions. DA-1241 reduced G6Pase and PEPCK expression in HepG2 cells. (B) Protein expression levels of G6Pase and PEPCK in liver tissue of chow, high-fat diet (HFD), and HFD-DA 1241 group. DA-1241 treatment reduced G6pase and PEPCK compared to HFD group. (C) Protein levels of LC3 and p62 in HepG2 cells treated with DA-1241 (1,000 nM) for 24 hours in the presence or absence of bafilomycin A1 (20 nM) for 2 hours. DA-1241 reduced LC3 levels and enhanced p62 levels in HepG2 cells.
To investigate the effects of DA-1241 treatment on autophagic flux, we measured the protein levels of LC3-II and p62 in the absence and presence of bafilomycin A1, an autophagy blocker [23], in HepG2 cells by Western blot analysis. LC3-I to II conversion increased after DA-1241 treatment, which was augmented by bafilomycin A1 pre-treatment (Fig. 5C). However, p62 expression increased after DA-1241 treatment (Fig. 5C).
To monitor autophagic flux in vitro, HepG2 cells were transfected with mRFP-GFP-LC3 expression vector. An increase in the number of red puncta reflects autophagic flux [24]. Autophagy-induced cells showed an increase in the number of yellow puncta, compared to cells under normal conditions (white bar) (Fig. 6A and B). In the absence of bafilomycin A1, the number of red puncta was markedly lower in DA-1241-treated cells than that in the control cells, indicating that DA-1241 reduced autophagic flux in HepG2 cells (Fig. 6A and C). Bafilomycin A1 treatment resulted in an increase in the number of yellow puncta (Fig. 6B) with a decrease in the number of red puncta (Fig. 6C), regardless of DA-1241 treatment.
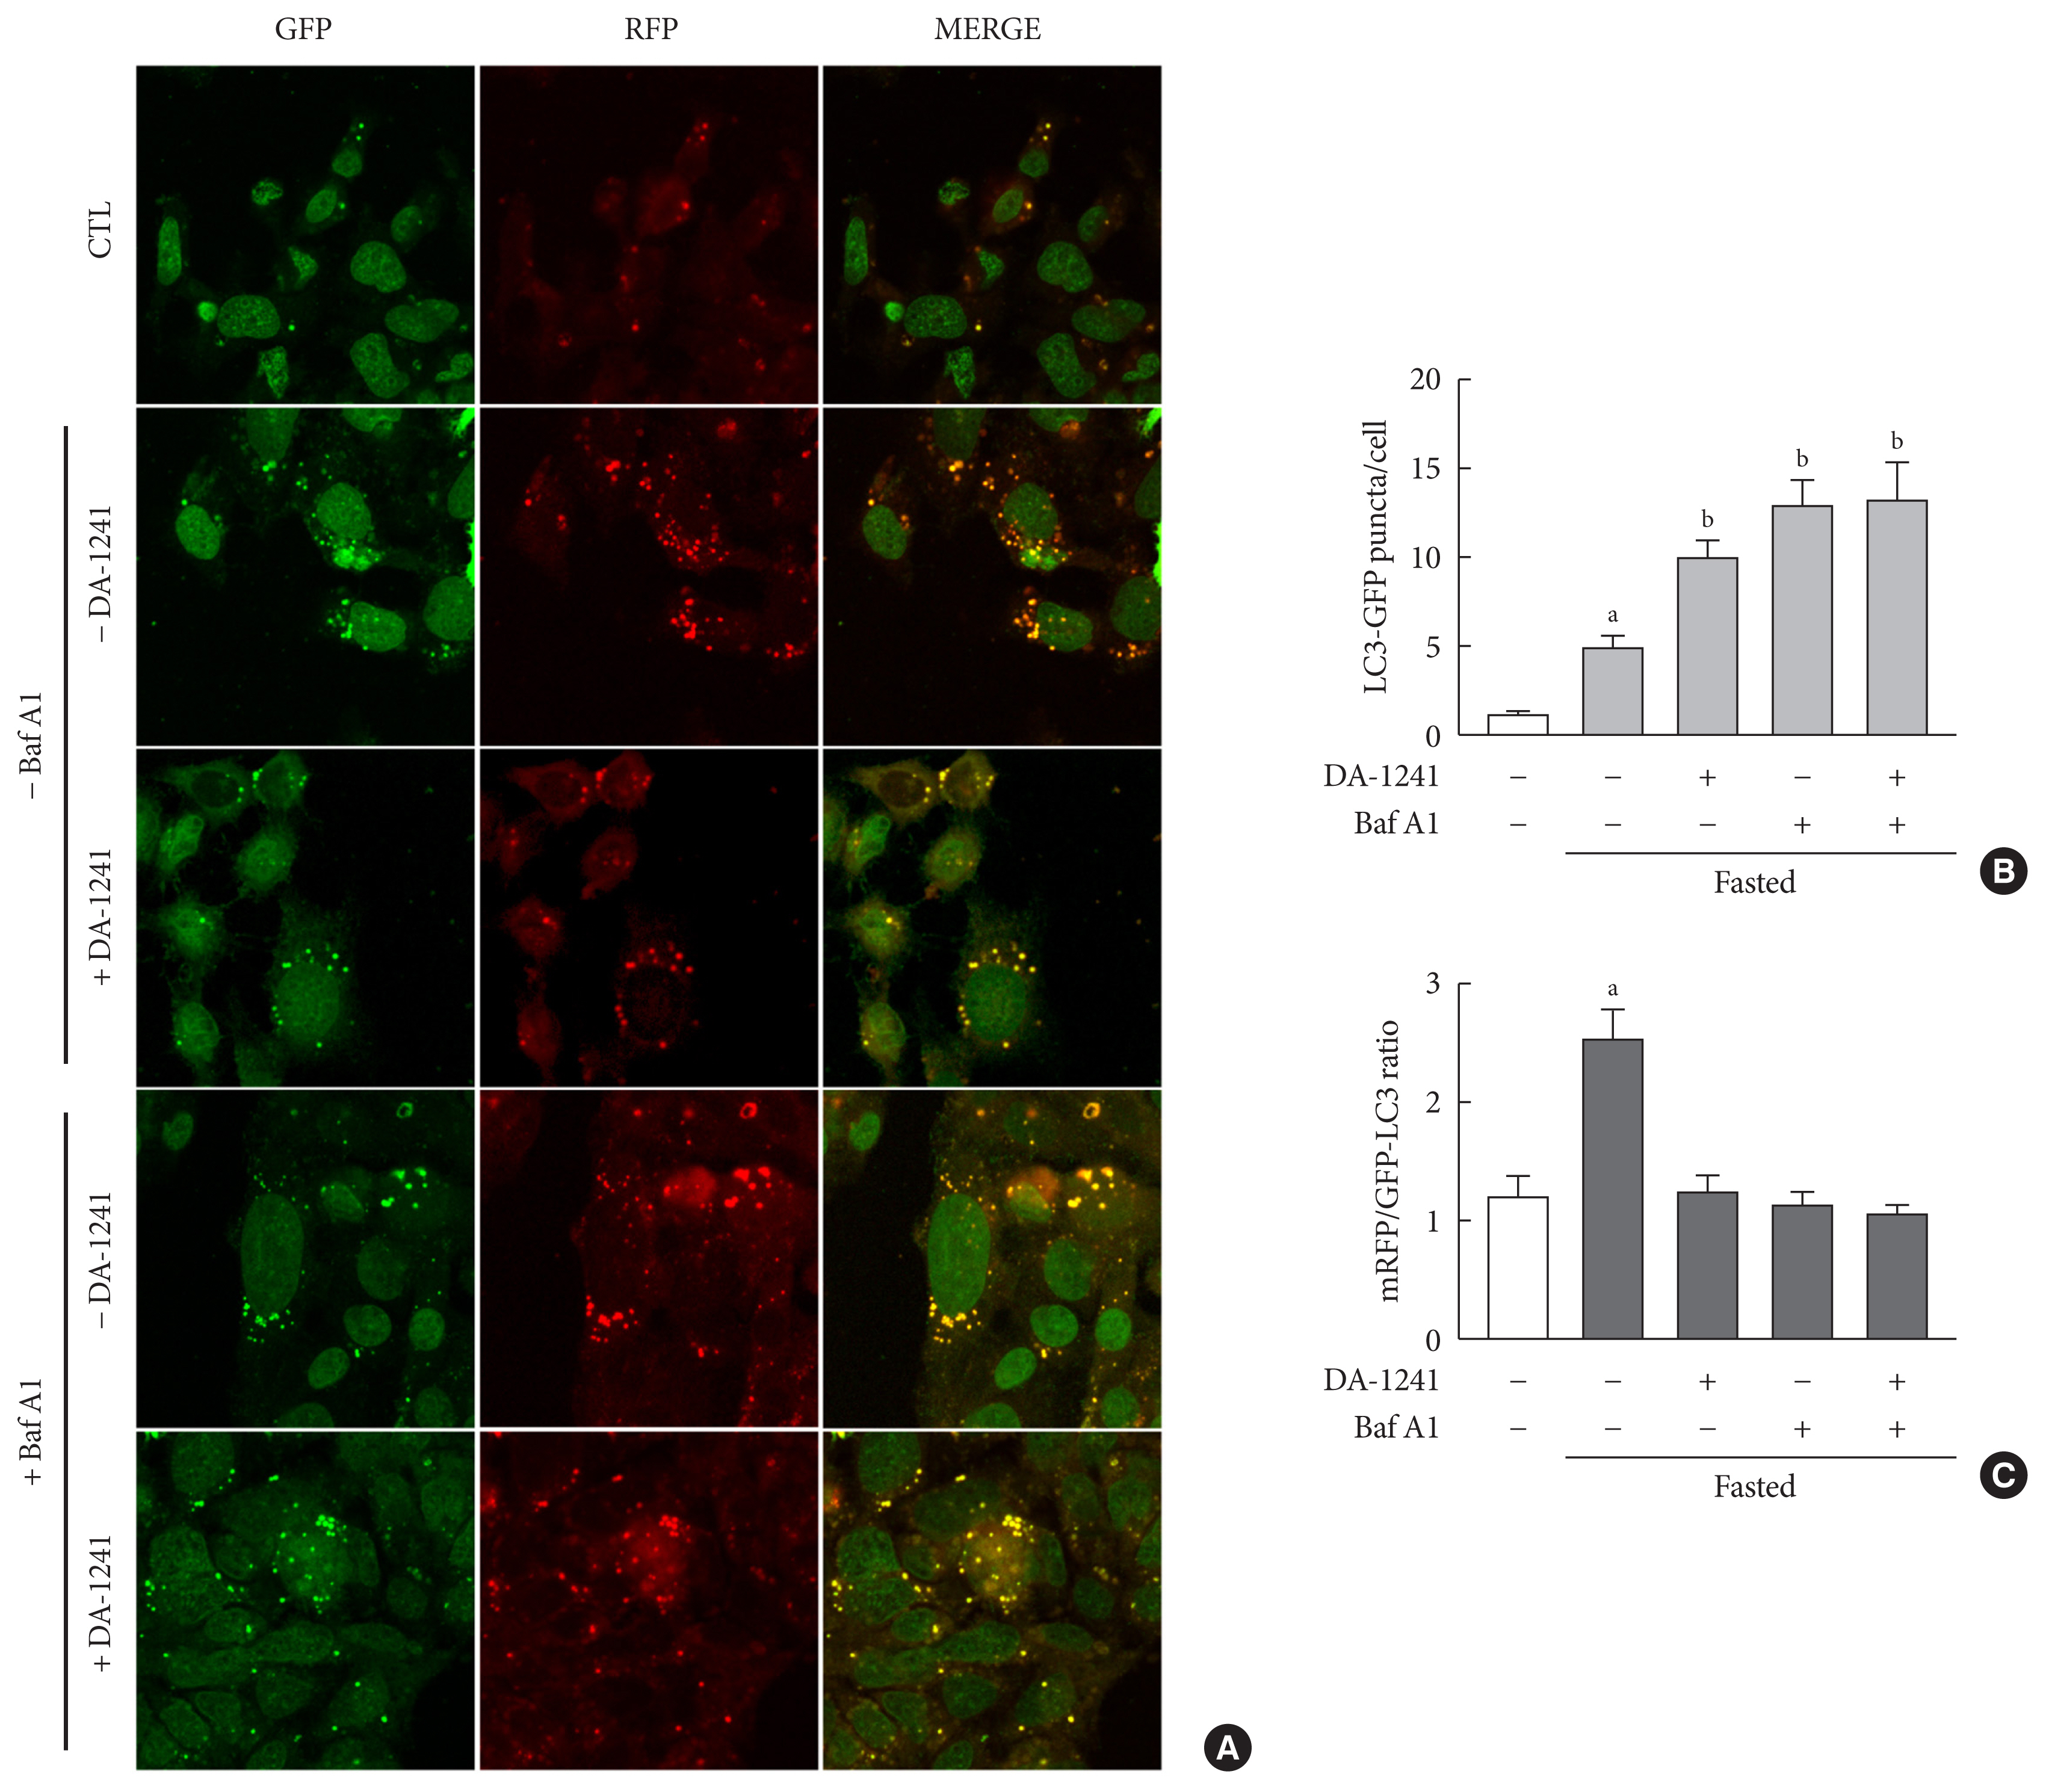
Monitoring of autophagic flux in HepG2 cells. HepG2 cells were transfected with microtubule-associated protein 1 light chain 3-fused to green fluorescent protein and monomeric red fluorescent (mRFP-GFP-LC3) expression vector. Then, HepG2 cells were treated with DA-1241 (1,000 nM) for 24 hours, and bafilomycin A1 (20 nM) was added for 2 hours. Cells under normal conditions were used as a control. (A) Images were obtained using a confocal microscope at 40× magnification. (B) Quantification of the number of LC3 and (C) mRFP/GFP-LC3 ratio. DA-1241 increased LC3 puncta (yellow) and decreased mRFP puncta (red) in HepG2 cells. Data are presented as the mean±standard error of the mean. aP<0.01, bP<0.001, compared with control (CTL) (white bars) (n=6).
DISCUSSION
GPR119 is expressed in the pancreatic β-cells, intestinal L-cells, and other tissues, such as the liver; however, its expression in the liver was relatively lower than that in the pancreas [6–8,25]. Some studies reported that GPR119 directly augmented insulin secretion from β-cells [7,26], and other studies showed that GRP119 activation indirectly induced glucose-dependent insulin secretion through the release of incretin hormone [7,27,28].
The glucose-lowering effects of GPR119 agonists were verified in several studies [7,8,29]. In addition, GPR119-deficient mice showed loss of the antihyperglycaemic effects of GPR119 agonist in GTT [7]. To evaluate the sustained glucose-lowering effects of DA-1241, DA-1241 was administered for 12 weeks in HFD-induced diabetic mice. Results of GTT revealed that DA-1241 improved glycaemic control with an improvement in insulin secretion. These glucose-lowering effects lasted for 12 weeks.
To test whether DA-1241 augmented glucose-stimulated insulin release directly from pancreatic β-cells, we performed GSIS assays in INS-1E, rat β-cell lines [30]. Although previous studies showed that GPR119 directly increased insulin secretion from pancreatic β-cell lines [6,26,31], in this study, DA-1241 did not exhibit any direct effects on insulin secretion from INS-1E cells. Our findings are in line with the results of some prior studies, showing the synthetic GPR119 agonists did not augmented glucose-dependent insulin secretion from INS-1 cells [32]. However, various studies showed that GPR119 agonists increased cyclic adenosine monophosphate (cAMP) levels and enhanced insulin secretion from HIT-T15 cells, a hamster β-cell line, or mouse insulinoma (MIN6) cells.
Therefore, it is possible that the effect of DA-1241 on insulin secretion is different according to beta lines. Additionally, several studies showed that GPR119 agonists increased insulin secretion from pancreatic islets [7,33], whereas one study reported conflicting results [34]. Thus, it cannot be ruled out that primary mouse β-cells can be responsive to DA-1241.
GPR119 agonists have been shown to enhance insulin secretion in a glucose-dependent manner through GLP-1 release [8,29,34]. Therefore, we hypothesised that DA-1241 might stimulate GLP-1 secretion and regulate glucose homeostasis. Consistent with previous findings, DA-1241 substantially enhanced serum GLP-1 levels during OGTT. Since GLP-1 decreases blood glucose levels in a nutrient-dependent manner [35], this effect of GPR119 agonists could minimise the risk of hypoglycaemia. A previous study demonstrated that intraperitoneal GTT and ITT were not different between Gpr119−/− and Gpr119+/+ mice [34]. Consistently, we observed no significant difference in intraperitoneal GTT and ITT between HFD-fed mice and DA-1241-treated mice. Therefore, we suggested that antihyperglycaemic effects of DA-1241 might be attributed to improved GLP-1 secretion upon oral glucose challenge.
GLP-1 not only indirectly enhances GSIS from β-cells but also protects β-cell mass via inhibition of apoptosis [35]. Moreover, GLP-1 is involved in the regulation of appetite [35,36]. Activated GLP-1 inhibits gastric emptying and food intake [35], which might partly contribute to its glucose-lowering effects. Because GPR119 agonists exhibited GLP-1 mimetic effects, they can be promising antidiabetic drug candidates for T2DM. It was reported that oleoylethanolamide, an endogenous ligand of GPR119, reduced food intake via activation of GPR119 receptor [37]. Although our study showed that DA-1241 substantially increased GLP-1 levels, GLP-1 secretion did not significantly affect food consumption. This findings might be explained by the differences in the signaling pathways activated by endogenous and synthetic GPR119 agonists [38]. However, the underlying mechanisms remain unclear.
GLP-1 increases cAMP levels and subsequently stimulates cAMP-activated protein kinase (AMPK) and inhibits sterol regulatory element-binding protein 1C (SREBP-1C), leading to inhibition of hepatic lipogenesis [39,40]. A recent study verified the expression of GPR119 mRNA and protein in human and mouse hepatocytes [41], and showed that MBX2982, a GPR119 agonist, attenuated hepatic steatosis via stimulation of AMPK phosphorylation, which suppressed the expression of SREBP-1C and consequently inhibited lipogenesis in the liver [41–43]. Because the liver plays a vital role in lipid metabolism [13], we studied the long-term effects of DA-1241 treatment on lipid profile in HFD-induced diabetic mice. In line with the results of lipid accumulation assays, chronic administration of DA-1241 reduced hepatic TG contents, which might be related to SREBP-1C-mediated lipogenic enzyme inhibition [42]. DA-1241 also considerably decreased total cholesterol levels, which is beneficial for NAFLD [44]. However, DA-1241 had a little effect on total TG levels. Similarly, APD668, a GPR119 agonist, reduced hepatic TG and total cholesterol levels, but not plasma TG levels, suggesting that ADP668 decreased postprandial TG levels, without affecting TG synthesis [39].
It has been reported that liver autophagy contributes to restoring blood glucose level via gluconeogenesis [16–18]. Liver-specific Atg7-deficient mice showed substantially reduced blood glucose levels under starvation conditions [16]. In HepG2 cells, starvation-induced autophagy was blocked by chloroquine (CQ), an autophagy blocker, and the expression of G6Pase and PEPCK was suppressed by CQ treatment [18]. Based on the results of previous studies, we examined whether DA-1241-induced autophagy blockade could affect gluconeogenesis in the liver. In our study, gluconeogenic enzyme expression was downregulated owing to the blockade of autophagic flux in cells and mice treated with DA-1241. Collectively, we suggested that autophagy blockade by DA-1241 partly contributed to the reduction of gluconeogenic enzyme expression in the liver. Furthermore, liver-specific Atg7-knockout mice (Atg7Δhep mice) exhibited improved glucose homeostasis and reduced fatty acid and triacylglycerol synthesis-related gene expression, with diminished hepatic lipid accumulation [45]. Although further studies are needed to clarify the role of autophagy in lipid metabolism [46–48], our findings presented new perspective of the effects of autophagy blockade by GPR119 agonists on glucose homeostasis and lipid metabolism, implying that DA-1241 might be a novel antidiabetic drug candidate.
Herein, we evaluated the antidiabetic effects of DA-1241 in vitro and in vivo. DA-1241 improved glucose tolerance without reduction of body weight. These glucose-lowering effects lasted for 12 weeks. Although DA-1241 augmented insulin secretion, it did not exhibit direct effects on insulin release from pancreatic β-cell lines. However, this could be explained that primary β-cells might be more responsive to DA-1241 than pancreatic β-cell lines. DA-1241 considerably enhanced GLP-1 secretion; however, it did not alter food intake.
Taken together, our study suggested that DA-1241, a novel GPR119 agonist, resulted in improved glycaemic control by increasing glucose-dependent insulin release via improvement of GLP-1 secretion, rather than directly affecting the pancreatic β-cells. Additionally, it reduced hepatic gluconeogenesis, which might be associated with autophagic blockade.
SUPPLEMENTARY MATERIALS
Supplementary materials related to this article can be found online at https://doi.org/10.4093/dmj.2021.0056.
Study design of diet and treatment duration. Five-week-old male C57BL/6J mice (n=45) were administered 60% high-fat (HF) diet (HFD) for 8 weeks prior to treatment. Normal control mice (same age) were fed with normal chow diet (n=4). After 8 weeks, HFD-induced diabetic mice (blood glucose levels ≥250 mg/dL) (n=34) were selected and randomly divided into 60% HFD (n=10) and 60% HFD+DA-1241 (120 mg/kg) (n=24) groups.
Assessment of insulin resistance and sensitivity. (A) Homeostatic model assessment for insulin resistance (HOMA-IR) index was calculated with the product of fasting plasma glucose×fasting plasma insulin. (B) Matsuda index was calculated from glucose and insulin concentrations in the fasting state and during oral glucose tolerance test (Chow, n=4; HF, n=10; DA-1241, n=24). HF, high-fat.
Notes
CONFLICTS OF INTEREST
No potential conflict of interest relevant to this article was reported.
AUTHOR CONTRIBUTIONS
Conception or design: Y.K., E.S.K.
Acquisition, analysis, or interpretation of data: Y.K., S.W.L., H.W., R.H.K., H.K.P., H.L., E.S.K.
Drafting the work or revising: Y.K., S.W.L., E.S.K.
Final approval of the manuscript: E.S.K.
FUNDING
This work was supported by a research grant of the Bio & Medical Technology Development Program of the NRF, Korea, MSIP (2019R1A2C2007514).
ACKNOWLEDGMENTS
None