Longitudinal Change in Myocardial Function and Clinical Parameters in Middle-Aged Subjects: A 3-Year Follow-up Study
Article information

Abstract
Background
Metabolic syndrome (MetS) is closely associated with the aging process. However, changes in metabolic conditions and cardiac function that occur in middle aged population remain unclear. We evaluated longitudinal changes in metabolic parameters and cardiac function during a 3-year period in subjects with suspected MetS.
Methods
We studied 191 participants with suspected MetS at baseline and after 3 years. Anthropometric parameters, including waist circumference (WC), and metabolic parameters, including fasting blood glucose and lipid profile were measured. Conventional echocardiography with two-dimensional speckle tracking was performed.
Results
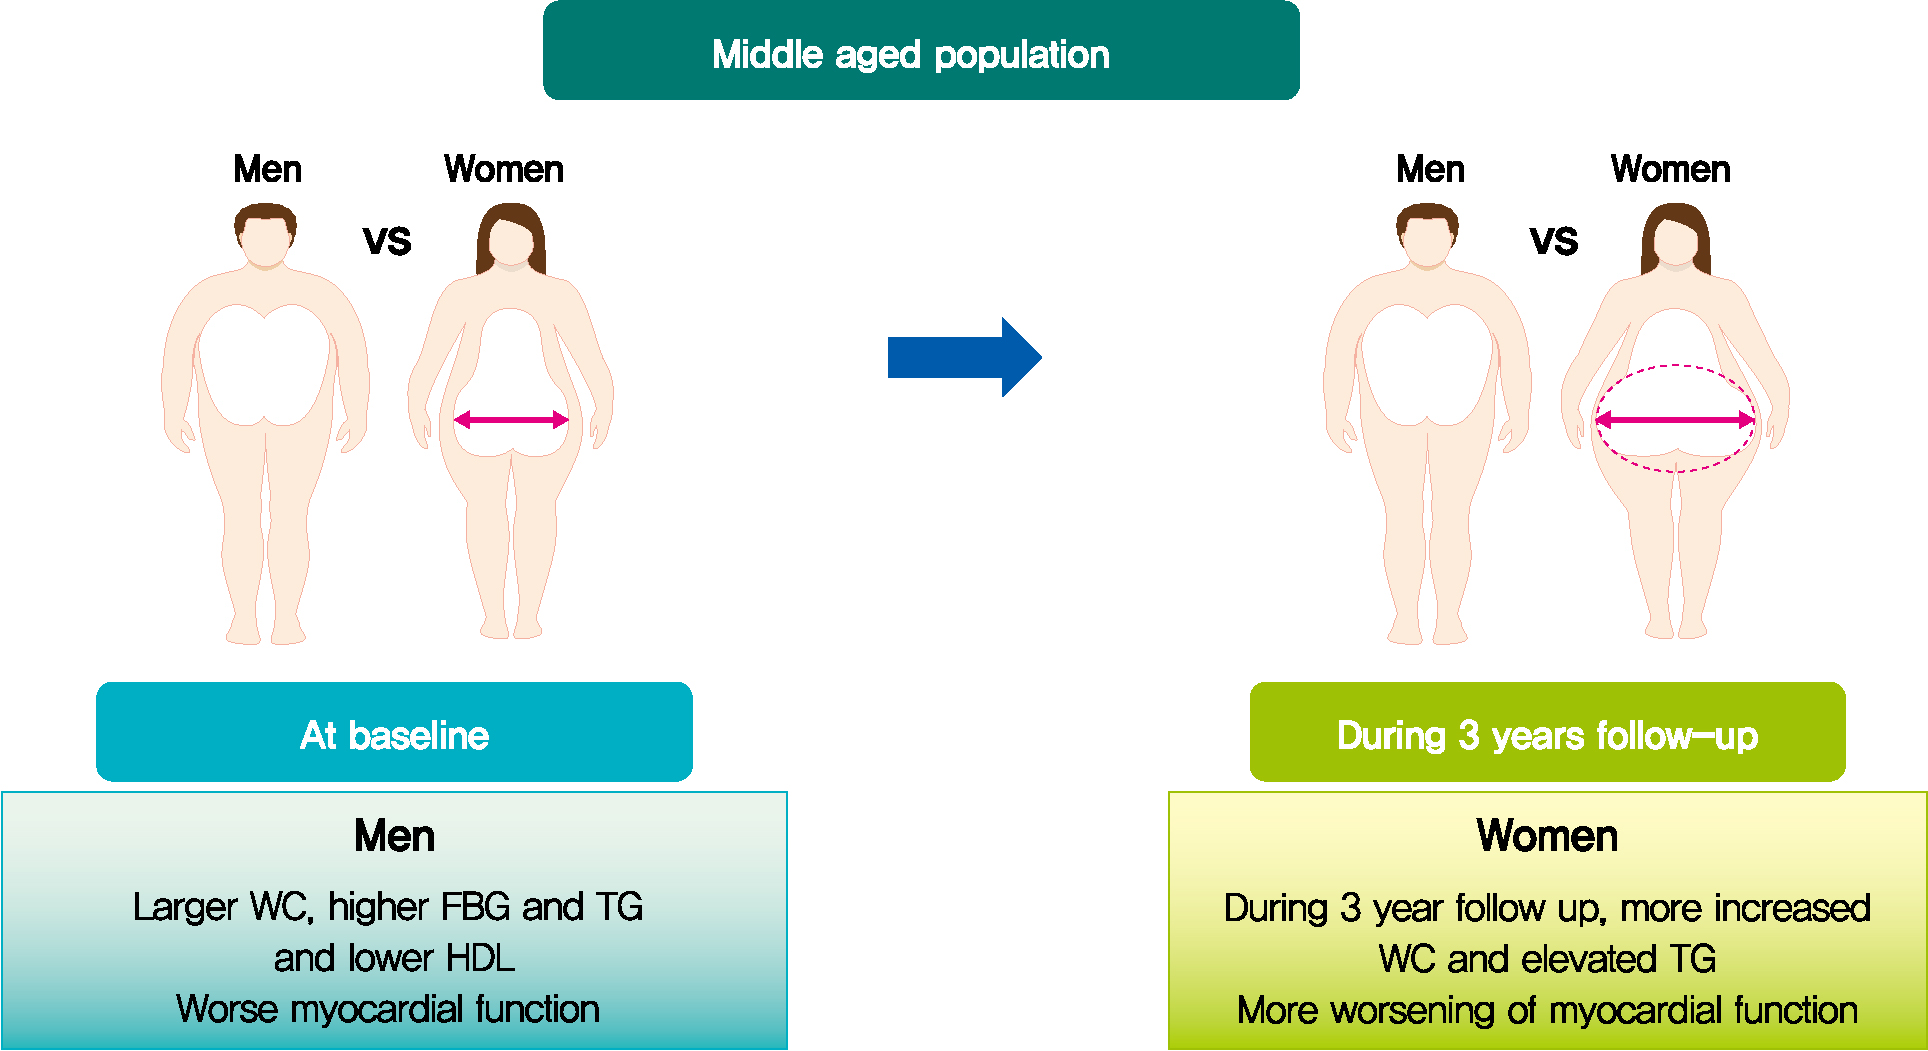
Mean age was 56.2±4.4 years, and there were 97 women (50.8%). Men had increased WC and triglycerides (TG) (WC 91.2±6.8 cm vs. 84.0±8.0 cm, P<0.001; TG 184.4±116.3 mg/dL vs. 128.2±53.6 mg/dL, P<0.001), and reduced global longitudinal strain (GLS) (–15.4%±2.1% vs. –17.1%±2.0%, P<0.001) compared to women. After 3.4 years, values of WC and TG did not change in men but increased in women (all P<0.05). The absolute value of left ventricular (LV) GLS did not change in men but was reduced in women (P=0.011). Change in TG was independently associated with worsening of LV GLS only in women (standardized β, –0.309; 95% confidence interval, –0.130 to –0.009; P=0.025).
Conclusion
In middle aged population, a vulnerable period for metabolic disturbance, cardiac remodeling tended to progress, which was prominent in women. Progression of adiposity and dyslipidemia after menopause may accelerate subclinical cardiac remodeling in middle-aged women. Lifestyle modification and medical interventions may help prevent further cardiac dysfunction in these subjects.
INTRODUCTION
The burden of metabolic syndrome (MetS) increases over the life course and metabolic disturbances are closely associated with cardiac remodeling [1-4]. Each metabolic component, such as hypertension, insulin resistance, dyslipidemia, and adiposity, is considered a fundamental determinant of cardiac concentric remodeling and dysfunction [5,6]. During the aging process, subclinical cardiac dysfunction appears early in the course of heart failure. Therefore, recent heart failure guidelines emphasize early detection of subclinical cardiac dysfunction and management of metabolic risk factors which can lead to overt heart failure [7,8].
Longitudinal community-based studies have identified that hypertension, insulin resistance and obesity are important factors for cardiac concentric remodeling and dysfunction [2,3,5,9,10]. However, these studies focused on long-term follow-up from adolescence or early adulthood. The prevalence of MetS differs by age and sex, and in particular, increases rapidly in individuals between the ages of 50 to 60 [1,11]. After menopause, sexual dimorphism in hormone, glucose, and lipid metabolism accelerates the progression of cardiometabolic diseases in middle-aged women [12]. MetS is more common in men than women until 50 years of age, while this sex difference is attenuated during aging [11]. Given the increased burden of metabolic components during the transition period between 50 and 60 years of age, it is important to understand the impact of dysmetabolic changes on cardiac remodeling, which characterizes the early stage of overt heart failure [7,13].
Therefore, we evaluated the longitudinal changes in metabolic parameters and its association with cardiac remodeling during a 3-year period in middle-aged subjects with suspected MetS.
METHODS
Study population
The Seoul Metabolic Syndrome study is a prospective cohort study to evaluate the characteristics and outcomes of subjects with suspected MetS. Participants were enrolled from 25 public health care centers in the Seoul metropolitan area. Detailed study protocols have been reported in previous studies [14,15]. This study is registered at www.clinicaltrials.gov (NCT02077530). A total of 191 consecutive participants who underwent conventional and two-dimensional speckle (2DS) echocardiography at baseline and after 3 years were enrolled in this study. Subjects with angina pectoris, myocardial infarction, any coronary revascularization procedure, or previous history of stroke were excluded. At baseline and follow-up, demographic data, concomitant medications, and previous medical history were evaluated, and a physical examination was performed. Data including body mass index (BMI), waist circumference (WC), and systolic and diastolic blood pressure (SBP and DBP) were measured at baseline and at the 3-year follow-up. Blood samples were collected from each subject after an 8-hour fast at baseline and follow-up. Total cholesterol, high-density lipoprotein (HDL) cholesterol, low-density lipoprotein (LDL) cholesterol, triglycerides (TG), and fasting blood glucose (FBG) values were obtained, along with written informed consent from all participants. The Institutional Review Board of Korea University Anam Hospital approved the current study (IRB NO. ED13087).
Echocardiographic study
All subjects underwent both conventional and 2DS echocardiography by using a commercially available echocardiographic system (Vivid-E9 with an M5Sc transducer; Vingmed-General Electric, Horten, Norway). Echocardiographic views were obtained based on the previously reported protocol [16]. Chamber size and function were measured by using 2D echocardiography images. Left ventricular end diastolic volume (LVEDV), left ventricular end systolic volume (LVESV), and left ventricular ejection fraction (LV EF) were measured and calculated using the biplane Simpson’s method from the apical 4- and 2-chamber view. Regional wall thickness (RWT), left atrial volume index (LAVI), and left atrial mass index (LVMI) were calculated using the formula recommended by the American Society of Echocardiography [16]. Early diastolic velocity of mitral inflow (E) was derived using pulsed-wave Doppler in the apical four-chamber view. Systolic and early diastolic velocities (s´ and e´) of the septal and lateral mitral annulus were evaluated using the pulsed-wave tissue Doppler image [17].
A 2DS echocardiography was performed for each participant based on the recommended guidelines of the American Society of Echocardiography [16]. Images of three consecutive cardiac beats were derived while holding the breath. The second-harmonic B-mode images of 4-, 2-, and 3- chamber apical views of the left ventricular (LV) were derived and stored in digital cineloop images. The LV global longitudinal strain (GLS) was analyzed using EchoPac-PC version 201.67.0 (GE Healthcare, Chicago, IL, USA) and was defined as the mean value of longitudinal peak negative strain from 18 apical segments.
Statistical analysis
Continuous variables are presented as mean±standard deviation. Categorical variables are expressed as frequencies (percentages). A chi-square test or Student’s t-test was used to compare differences in clinical, laboratory, and echocardiographic variables between men and women. A paired t-test was performed to evaluate longitudinal changes in the parameters at baseline and follow-up. The correlation between changes in metabolic components and LV GLS was evaluated by correlation analysis. Multiple linear regression analysis was performed to investigate the association between the metabolic parameters and myocardial function (GLS) after adjustment for age, BMI, WC, SBP, DBP, FBG, total cholesterol, TG, LDL, and HDL levels. SPSS version 25.0 (IBM, Armonk, NY, USA) was used to perform the statistical analysis. Two-sided P values <0.05 were considered statistically significant.
RESULTS
Baseline clinical, laboratory, and echocardiographic characteristics
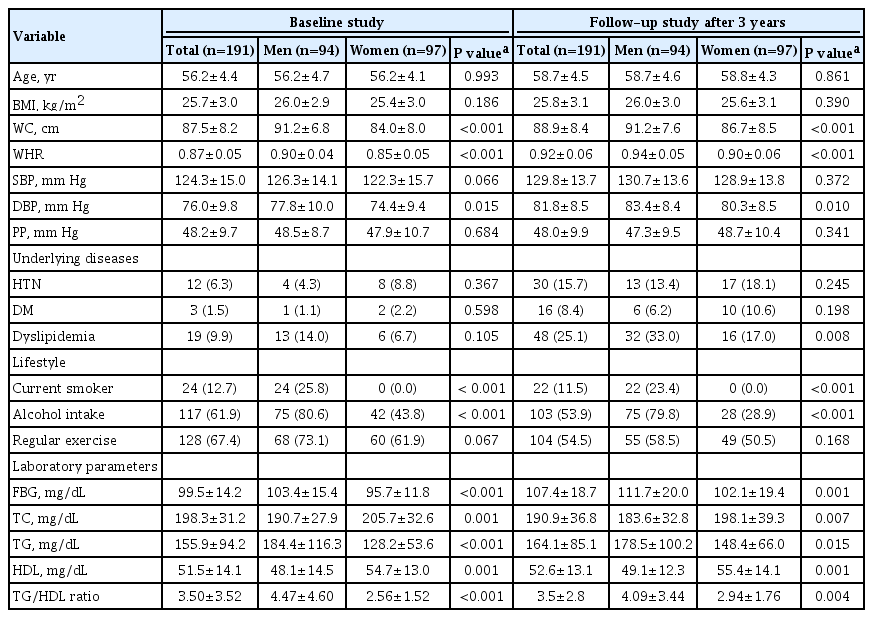
Table 1 presents the baseline characteristics of the study population. Among 191 subjects, the mean age was 56.2±4.4 years, and there were 97 women in the study (50.8%). At baseline, mean BMI, WC, SBP, and DBP were 25.7±3.0 kg/m2, 87.5±8.2 cm, 124.3±15.0 mm Hg, and 76.0±9.8 mm Hg. Mean FBG, TG, and HDL were 99.5±14.2, 155.9±94.2, and 51.5±14.1 mg/dL. Twelve (6.3%) and three (1.5%) subjects were taking antihypertensive and oral hypoglycemic medications, respectively, while 19 (9.9%) subjects were taking statins.
Clinical and laboratory parameters
Mean age, BMI, and SBP were comparable between the sexes, while WC and DBP were increased in men compared to women. The prevalence of underlying cardiovascular diseases was also comparable between men and women. Metabolic laboratory values, including FBG, TG, and HDL, were consistently more impaired, in men than women.
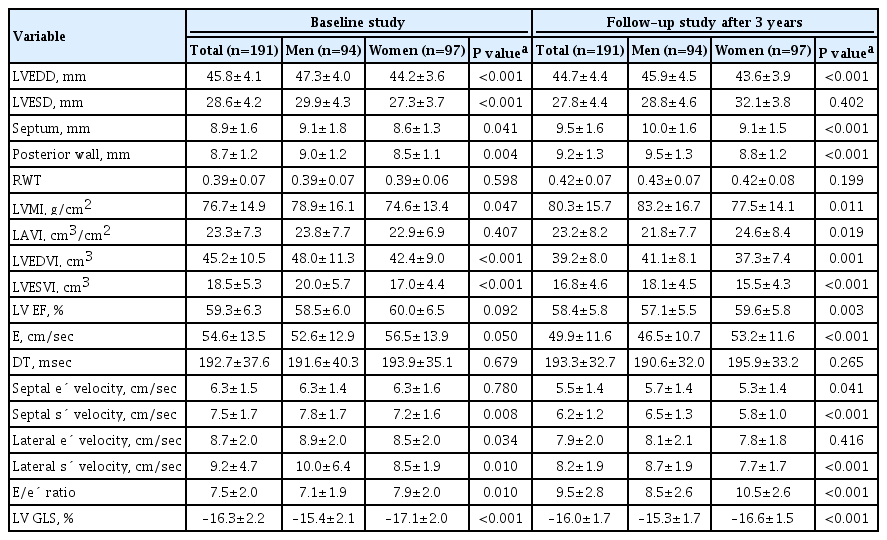
Table 2 shows the echocardiographic parameters. The mean LVMI, LV EF, and LV GLS were 76.7±14.9 g/cm2, 59.3%±6.3%, and –16.3%±2.2%, respectively. The LVMI, LVEDV, and LVESV were higher in men than in women; however, the LAVI and LV EF were not different between the sexes. Women had higher E/e´, but the difference in e´ velocity between the sexes was not significant. The LV GLS was more impaired in men.
Echocardiographic parameters
Longitudinal changes in clinical and laboratory parameters
The median follow-up was 3.4 years (5th to 95th percentile, 3.1 to 3.7). At follow-up, the mean age of the study population was 58.7±4.5 years. Table 1 also shows the clinical and laboratory characteristics at the 3-year follow-up. From baseline to follow-up, BMI, WC, and TG level did not change over time. In contrast, SBP, DBP, FBG, and HDL level increased significantly by 5.6±14.6 mm Hg, 5.8±8.4 mm Hg, 7.8±16.3 mg/dL, and 1.1±11.3 mg/dL, respectively (all P<0.05) (Fig. 1). In the subgroup analysis by sex, the WC, and TG level significantly increased by 2.7±5.4 cm and 21.7±68.5 mg/dL, respectively, only in women (all P<0.05), not in men. However, the WC and TG level was higher in men compared to women at follow-up.
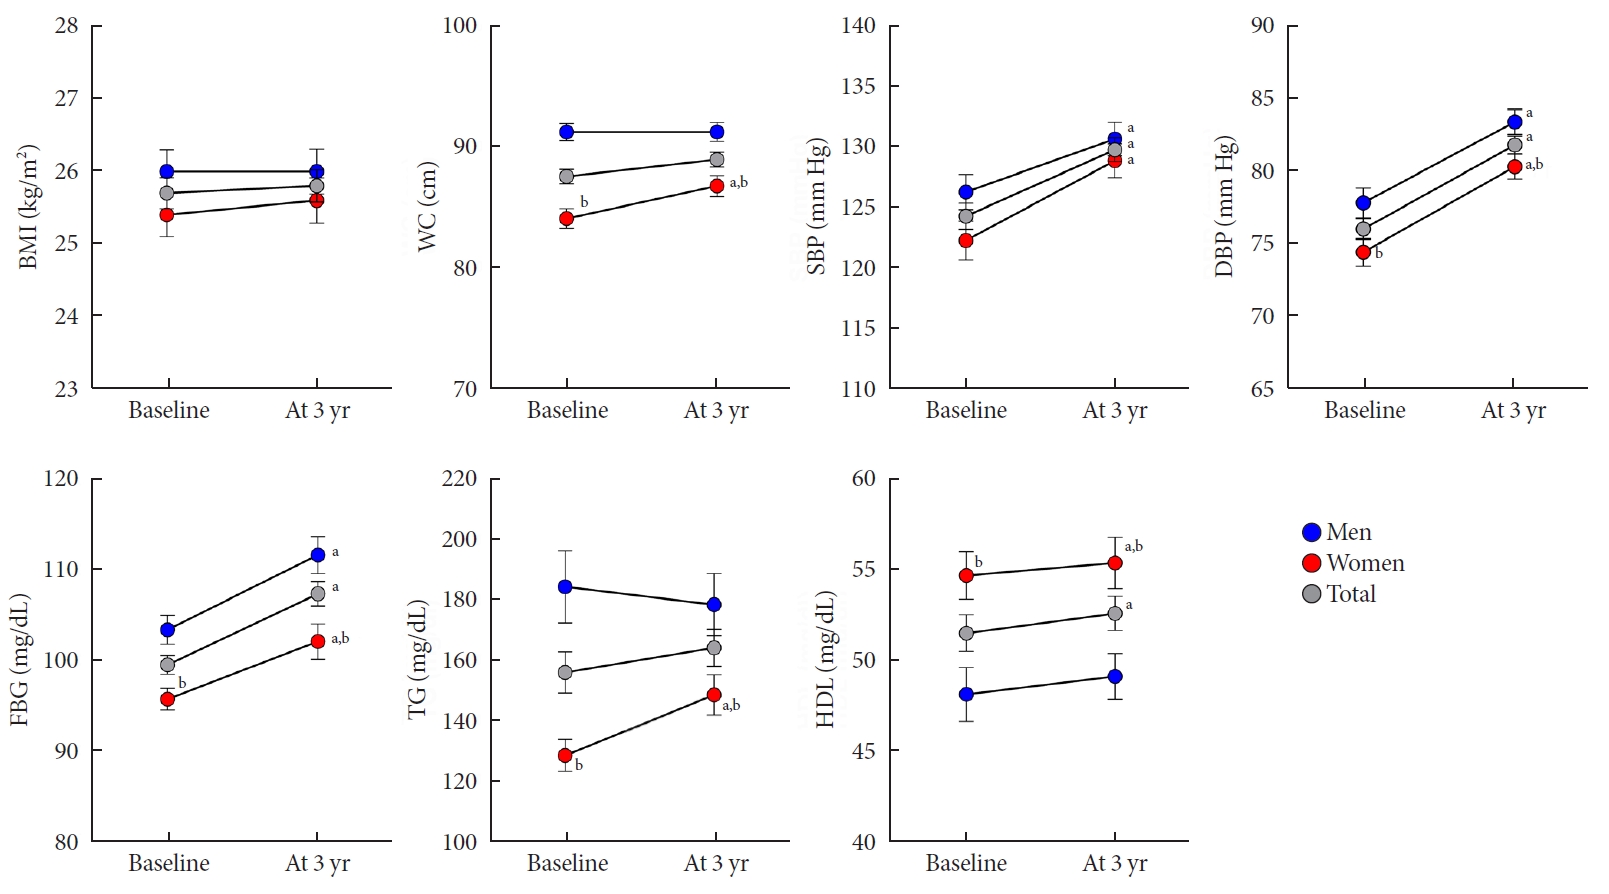
Changes in clinical and laboratory parameters in men and women. Error bars indicate standard error of the mean. BMI, body mass index; WC, waist circumference; SBP, systolic blood pressure; DBP, diastolic blood pressure; FBG, fasting blood glucose; TG, triglyceride; HDL, high-density lipoprotein. aP<0.05 vs. baseline, bP<0.05 vs. men.
Longitudinal changes in cardiac geometry and functional parameters
A comparison of echocardiographic parameters related to cardiac structure and functional remodeling at baseline and follow-up was performed. Cardiac structural remodeling over the 3-year period is characterized by a concentric pattern of increasing RWT and LVMI, and decreasing LVEDV and LVESV (all P<0.05) (Fig. 2). However, no change in the LAVI was observed for all subjects. In both men and women, RWT and LVMI increased, and LVEDV and LVESV decreased over the 3-year period.
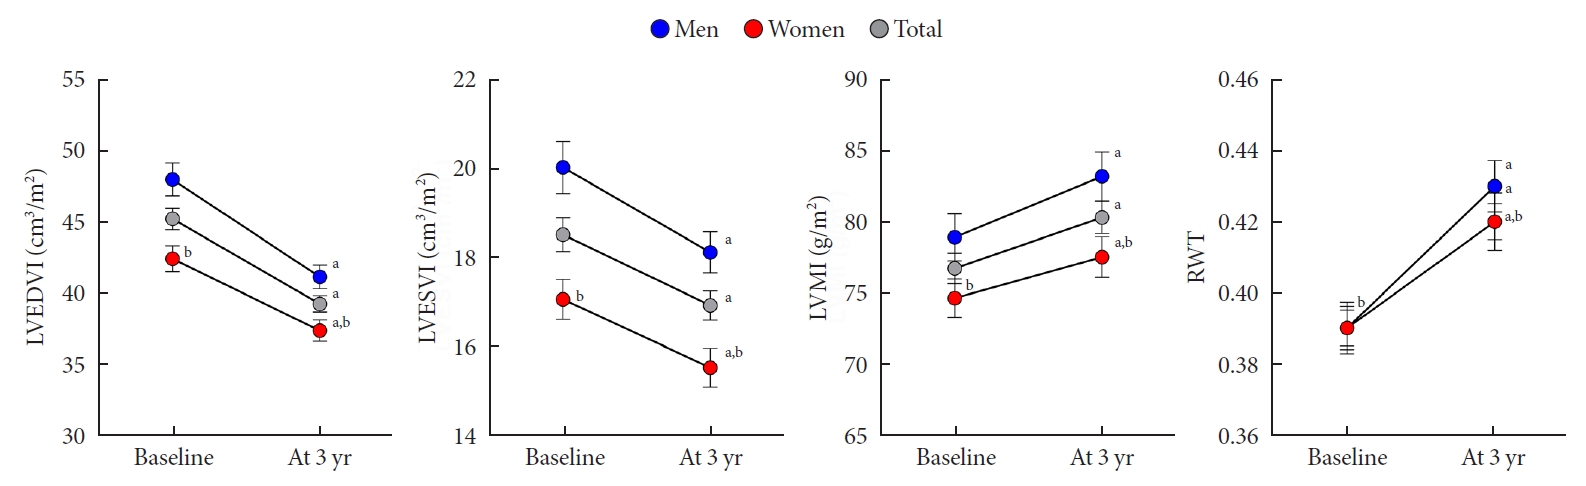
Changes in cardiac geometry in men and women. Error bars indicate standard error of the mean. LVEDVI, left ventricular end diastolic volume index; LVESVI, left ventricular end systolic volume index; LVMI, left ventricular mass index; RWT, regional wall thickness. aP<0.05 vs. baseline, bP<0.05 vs. men.
Systolic functional parameters represented by s´ velocity, LV EF, and GLS and diastolic functional parameters represented by e´ and E/e´ ratio tended to be deteriorated throughout the 3-year period (Fig. 3). The s´ velocity, LV EF, the absolute value of LV GLS, and e´ velocity decreased by –1.4±1.6 cm/sec, –2.0%±5.3%, 0.8%±2.4%, and –0.8±1.6 cm/sec, respectively (all P<0.05). The E/e´ ratio increased by 2.1%±2.5%, respectively (P<0.05). In both men and women, all cardiac functional parameters, except the LV GLS, tended to be deteriorated (all P<0.05). The subtle parameter of myocardial deformation, represented by the absolute value of LV GLS, did not change in men; however, this value was significantly reduced in women (P=0.011). Nevertheless, the LV GLS was more impaired in men than in women at follow-up (–15.3±1.7 vs. –16.6±1.5, P<0.001).
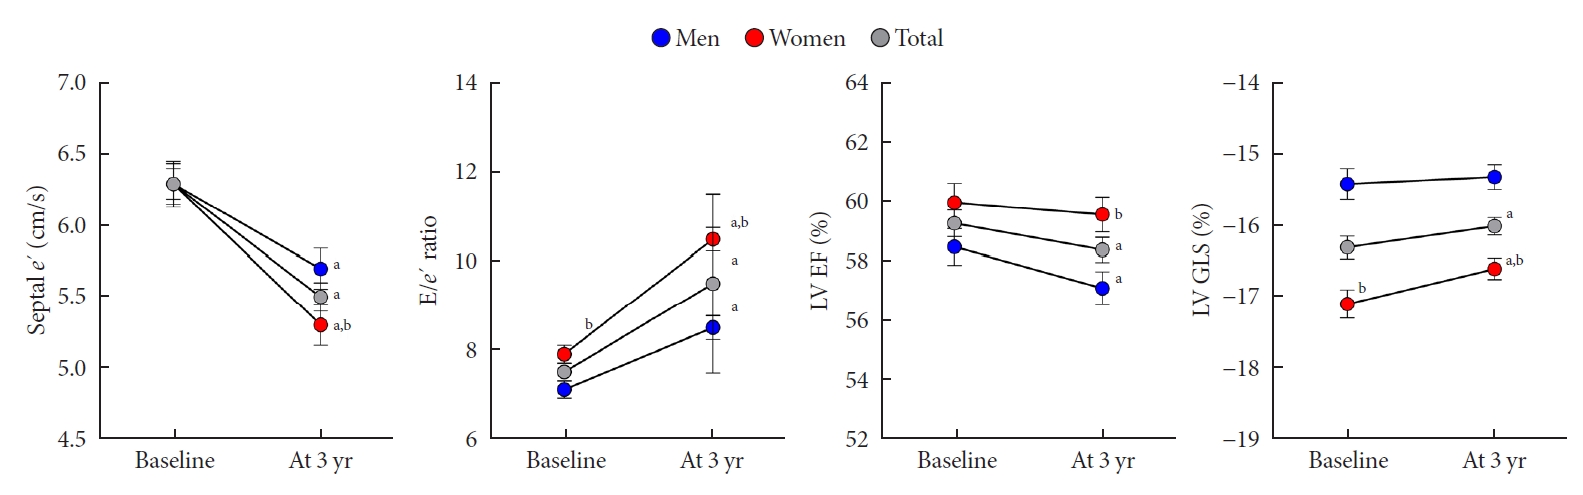
Changes in cardiac function in men and women. Error bars indicate standard error of the mean. e’, early diastolic velocity of mitral annulus; E, mitral peak velocity of early filling; LV, left ventricular; EF, ejection fraction; GLS, global longitudinal strain. aP<0.05 vs. baseline, bP<0.05 vs. men.
The association between changes in metabolic profile and cardiac function
The association between changes in metabolic profile and cardiac function over the 3-year period was analyzed by using multiple linear regression analysis (Table 3). Overall, in our population, the metabolic parameters were not independently related to changes in the LV GLS. In analysis by sex, the change in TG was independently associated with worsening of LV GLS, but only in women (standardized β, –0.309; 95% confidence interval, –0.130 to –0.009; P=0.025). Fig. 4 demonstrates the association between the change in the TG level and LV GLS in men and women.
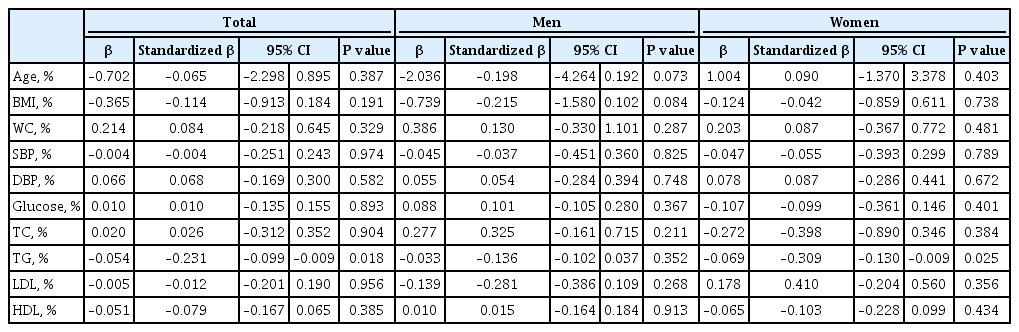
Impact of changes in metabolic profile on the 3-year change in myocardial dysfunction represented by LV GLS using multiple linear regression analysis
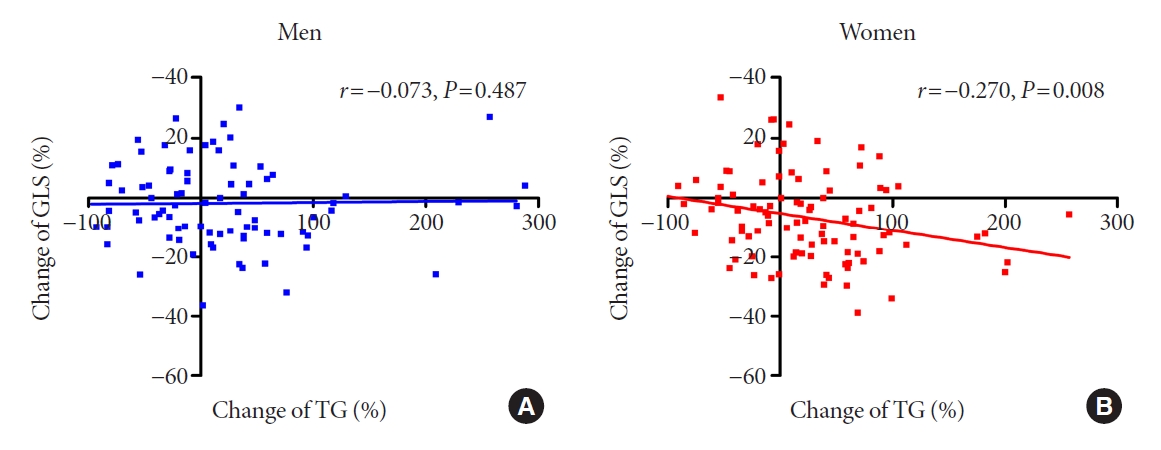
The association between changes in triglyceride (TG) and global longitudinal strain (GLS) during the 3-year period. (A) Men and (B) women.
DISCUSSION
To our knowledge, this is the first study to demonstrate sex differences related to longitudinal changes in myocardial function in middle-aged subjects with suspected MetS, but without apparent cardiovascular diseases. Furthermore, we obtained the following results. The values obtained for FBG and BP significantly increased during the 3-year period. Moreover, cardiac structural remodeling was characterized by a concentric pattern and worsened cardiac systolic and diastolic functions over the 3-year period of the study. In subgroup analysis by sex, the WC and TG level were higher in men, and men had worse LV GLS compared to women at baseline. After 3 years, the values of the WC and TG were still higher in men; however, there was a longitudinal increase in the values of WC and TG, but only in women. The LV GLS did not change in men in our study; however, it significantly increased in women. Finally, the change in TG level was both inversely and independently associated with changes in LV GLS in women, but not in men.
Aging and the myocardium
Cardiac structural and functional changes progress over time throughout adulthood, and this dynamic process is termed ‘cardiac remodeling’ [18]. The Framingham study demonstrated increasing LV mass and concentricity over both a short-term and long-term period [3,5]. Several longitudinal studies have demonstrated cardiac systolic and diastolic functional deterioration on tracking using tissue Doppler and 2DS echocardiography [2,6]. LV strain assessed by using 2DS echocardiography has recently been reported as a sensitive and useful tool in the evaluation of myocardial function focusing on myocardial deformation [19]. Our previous studies reported that epicardial and visceral adiposity correlated well with myocardial dysfunction as assessed using GLS in a cross-sectional study [14,15]. A community study demonstrated that subclinical myocardial dysfunction as assessed using GLS reflected early myocardial contractile deterioration and independently predicted the development of major cardiovascular events [20]. The results of this study using 2DS echocardiography demonstrated that LV concentric remodeling and dysfunction progressed over a 3-year period in patients with suspected MetS, and these results are consistent with those of previous studies. However, it is notable that the change in cardiac remodeling was recognized only in a 3-year period, which suggests that the myocardium is vulnerable to the aging process as well as to metabolic disturbances in middle-aged subjects.
Although LV GLS assessed using 2DS echocardiography is a novel and emerging tool, the clinical application of LV GLS requires the definition of a normal range. The Seoul Metabolic Syndrome study enrolled only consecutive participants with MetS. In a meta-analysis of LV GLS, the normal GLS was –19.7% with a narrow 95% confidence interval (–20.4% to –18.9%) [21]. The Korean Society of Echocardiography also suggested a normal value of LV GLS (−20.4%±2.2%) in the healthy Korean population [22]. The subclinical myocardial dysfunction assessed by LV GLS in subjects with MetS was more impaired compared to controls in the Korean single-center study [23]. Compared to the normal value of LV GLS in reference studies, the present study revealed that the mean value of LV GLS (–16.3%±2.2%) in subjects with MetS was more impaired, and LV GLS became more deteriorated during the 3-year follow-up. Our findings, though consistent with the previous study, elaborate on the longitudinal change in subclinical cardiac remodeling assessed by LV GLS in middle-aged subjects with MetS.
Metabolic parameters and the myocardium
Metabolic profiles deteriorate with age. The Korean National Health and Nutrition Examination Surveys (KNHANES) revealed that metabolic components were gradually more impaired with aging [24]. When mean WC and TG were compared between groups with 50 to 54 and 55 to 59 years in the KNHANES population, they were not significantly different [24]. The Korean Genome and Epidemiology Study, which is a community-based longitudinal study and included 10,038 adults aged 40 to 69 years, reported that the mean WC increased by 1.71 and 1.85 cm in men and women, respectively, during the 8-year period [25]. Compared to findings from the general population, the progress of metabolic impairment, especially mean WC and TG, over 3 years was remarkable in middle-aged women with MetS in the present study.
In previous longitudinal studies, higher blood pressure, central obesity, and insulin resistance were significantly associated with cardiac structural and functional remodeling [9,10,26]. MetS is a constellation of various metabolic disturbances, which have multifactorial effects on the myocardium. High blood pressure is related to arterial stiffness and increased cardiac afterload, and central obesity is associated with higher cardiac output and volume overload [27]. Insulin resistance induces extracellular collagen deposition and reactive interstitial fibrosis that lead to myocardial stiffness [28]. Cross sectional studies investigated the impact of TG on cardiac remodeling. In 15 healthy subjects, myocardial TG contents were associated with LV mass and systolic dysfunction [29]. In hypertensive patients, plasma TG contributed to LV hypertrophy and arterial stiffness independently from hormonal and hemodynamic factors [30]. However, there is scarce data regarding whether long-term exposure to high TG is related to cardiac remodeling. In the present study, it is notable that changes in the TG level were negatively and independently associated with cardiac functional remodeling in women.
Sex differences
Out study demonstrated a predominant association between TG level and cardiac remodeling in women. However, the pathophysiology of this association is still unclear. The mean age of natural menopause is approximately 50 years. Menopause increases cardiovascular risk burden, and indeed, menopause status is independently associated with the serum lipid profile [31]. Menopause-related increases in TG levels may contribute to this sex difference. With respect to lifestyle factors, the men in our study tended to be more physically active and engage in regular exercise compared to the women. Indeed, active cardiovascular fitness may protect individuals from metabolic disturbances and cardiac remodeling during the transition period from 50 to 60 years of age.
Clinical implication
Weight loss is associated with cardiac structure and function, and body weight is a well-known parameter to monitor the effects of medical or surgical intervention [32,33]. In our study, the change in TG level was significantly correlated with LV functional remodeling over a 3-year period. These findings suggest that lifestyle changes targeting TG levels may be associated with beneficial cardiac remodeling in middle-aged subjects.
Strengths and limitations
Our study has several considerable merits, including the longitudinal design and the aim of evaluating serial echocardiography using 2DS to track subtle cardiac remodeling. However, our study also has several limitations. In patients without apparent cardiovascular diseases, a large sample size should be used to evaluate longitudinal changes in metabolic disturbances and cardiac remodeling. Although our study had a small sample size, the delicate and subtle parameters associated with cardiac remodeling evaluated by 2DS echocardiography demonstrated significant longitudinal changes in cardiac remodeling and its association with metabolic parameters. Cardiac remodeling is a well-known subclinical status of heart failure; however, during the 3-year follow-up period, there were no new developments, specifically major cardiovascular events including heart failure. Our cohort is an ongoing, prospective study, and we aim to investigate changes in metabolic disturbances and their relationship with cardiovascular events in a follow-up study. In the present study, a healthy control group was not included, and thus, a direct comparison of the metabolic profiles and LV GLS values between subjects with MetS and healthy controls was not available. Further studies are needed to compare the metabolic profiles and LV GLS between subjects with MetS and healthy controls. Finally, our study evaluated sex differences regarding longitudinal changes in metabolic parameters and cardiac remodeling over the transitional period from middle-aged to elderly. The change in hormone status, including the sex hormones, can pose as a potent pathologic mechanism; however, we were unable to evaluate the level of sex hormones in this study. Further studies are needed to evaluate hormonal changes and their impact on cardiac remodeling in middle-aged men and women.
In middle-aged subjects with suspected MetS, but with no apparent cardiovascular diseases, LV dysfunction tended to progress more in women than men during a 3-year follow-up period. The results of our study suggest that the myocardium in women is more vulnerable to dysmetabolic changes from middle-aged to elderly, which is a transitional period for metabolic disturbances. Sexual dimorphism in the progression of lipid metabolism and central adiposity may accelerate subclinical myocardial dysfunction during this period. Lifestyle changes and medical interventions should be considered to prevent further cardiac dysfunction in middle-aged subjects with suspected MetS, particularly in women.
Notes
CONFLICTS OF INTEREST
No potential conflict of interest relevant to this article was reported.
AUTHOR CONTRIBUTIONS
Conception or design: D.S.L., S.M.P.
Acquisition, analysis, or interpretation of data: D.H.C., H.J.J., M.N.K., H.D.K., D.S.L.
Drafting the work or revising: D.H.C., D.S.L., S.M.P
Final approval of the manuscript: S.M.P.
FUNDING
This study was supported by a grant from the Seoul Metropolitan Government.
Acknowledgements
The authors appreciate the participation of all the subjects in the Seoul Metabolic Syndrome study.