- Current
- Browse
- Collections
-
For contributors
- For Authors
- Instructions to authors
- Article processing charge
- e-submission
- For Reviewers
- Instructions for reviewers
- How to become a reviewer
- Best reviewers
- For Readers
- Readership
- Subscription
- Permission guidelines
- About
- Editorial policy
Articles
- Page Path
- HOME > Diabetes Metab J > Volume 34(4); 2010 > Article
-
Original ArticleEffects of Endurance Exercise and High-Fat Diet on Insulin Resistance and Ceramide Contents of Skeletal Muscle in Sprague-Dawley Rats
- Hyun Lyung Jung, Ho Youl Kang
-
Korean Diabetes Journal 2010;34(4):244-252.
DOI: https://doi.org/10.4093/kdj.2010.34.4.244
Published online: August 31, 2010
- 3,254 Views
- 28 Download
- 9 Crossref
Exercise Metabolism Laboratory, Department of Physical Education, Kyungpook National University, Daegu, Korea.
- Corresponding author: Ho Youl Kang. Department of Physical Education, Kyungpook National University, 1370 Sankyuk-dong, Buk-gu, Daegu 702-701, Korea. hokang@knu.ac.kr
• Received: March 25, 2010 • Accepted: June 24, 2010
Copyright © 2010 Korean Diabetes Association
This is an Open Access article distributed under the terms of the Creative Commons Attribution Non-Commercial License (http://creativecommons.org/licenses/by-nc/3.0/) which permits unrestricted non-commercial use, distribution, and reproduction in any medium, provided the original work is properly cited.
ABSTRACT
-
Background
- We evaluated the effects of endurance exercise and a high-fat diet on insulin resistance and ceramide contents of skeletal muscle in Sprague-Dawley rats.
-
Methods
- We randomly divided 32 rats into four groups: control (CON, n = 8), high fat diet (HF, n = 8), exercise (Ex, 24 m/min for 2 hours, 5 days/wk, n = 8), HF/Ex (n = 8). After 4-week treatments, plasma lipid profiles, glucose and insulin concentrations were measured. The triglycerides (TG), ceramide, and glucose transporter 4 (GLUT-4) contents were measured in the skeletal muscle. The rate of glucose transport was determined under submaximal insulin concentration during the muscle incubation.
-
Results
- Free fatty acid levels were significantly higher in CON and HF than Ex (P = 0.032). Plasma glucose levels in HF were significantly higher than the two Ex groups (P = 0.002), and insulin levels were significantly higher in HF than in other three groups (P = 0.021). Muscular TG concentrations were significantly higher in HF than CON and Ex and also in HF/Ex than Ex, respectively (P = 0.005). Hepatic TG concentrations were significantly higher in HF than other three groups but Ex was significantly lower than HF/Ex (P = 0.000). Muscular ceramide content in HF was significantly greater than that in either Ex or HF/Ex (P = 0.031). GLUT-4 levels in CON and HF were significantly lower than those in Ex and HF/Ex (P = 0.009, P = 0.003). The glucose transport rate in submaximal insulin concentration was lower in CON than in either Ex or HF/Ex (P = 0.043), but not different from HF.
-
Conclusion
- This study suggests that high fat diet for 4 weeks selectively impairs insulin resistance, but not glucose transport rate, GLUT-4 and ceramide content in skeletal muscle per se. However, endurance exercise markedly affects the content of ceramide and insulin resistance in muscle.
- Due to the westernization of diet and the lack of exercise, obesity is rapidly spreading throughout the country in Korea. Also, the World Health Organization (WHO) has said that if the estimated number of obese adults in the world is in the mid 400 millions (body mass index ≥ 30), then by 2015, the number of obese individuals is expected to reach 700 millions [1].
- The consumptions of high fat diet are resulting in increased general insulin levels and insulin resistance in muscles and in the body overall. It has been reported that increased insulin level due to a high fat diet causes hyperglycemia and, if left untreated, will increase the likelihood of developing type 2 diabetes mellitus [2-5]. Also, the intake of a high fat diet in obese type 2 diabetic patients causes muscular fat to oxidize less, increasing the accumulation of fat in adipocytes and muscle tissues. Accumulation of lipids within the skeletal muscles increases long-chain fatty acyl CoAs (LCACoAs), diaglycerol (DAG), ceramide among other mid-products. This occurs simultaneously with insulin signal transduction, which causes a decrease in the frequency of glucose transporter 4 (GLUT-4) translocation. As a result, it is reported that glucose uptake in the muscles is decreased, and muscle's insulin resistance is increased [1,6]. Among the mid-products, ceramide affects the cellular proliferation, cellular division, and inflammatory response [7], and it also takes a noticeable effect on glucose uptake and insulin signaling [8]. Previous studies have reported that ceramide is increased in insulin resistant muscles [8-11], which decreases the phosphorylation of insulin receptor substrate-1 among other insulin signaling structures that affect GLUT-4's translocation and limits the activity of phosphatidyl inositol-3 kinase. It also brings about insulin resistance by limiting phosphorylation of protein kinase B (Akt/PKB) [12-14]. Insulin resistance is observed as a result of a surplus of lipids which is thought to be caused by an accumulation of ceramide in the liver and muscle tissue. Reduction of the ceramide in the skeletal muscle tissue could improve the insulin resistance.
- Previous data on the improvement of insulin resistance have shown relationship between regular exercise and reduced insulin resistance [15-18]. Ivy [18] reported insulin stimulated glucose transport during intense training. Dobrzyn and Gorski [19] reported that sustained light cardiovascular exercise decreases muscular ceramide and neutral Mg++ dependent sphingomyelinase (nSMase) concentrations. Additionally, it is reported that intensity exercise decrease the concentration of sphingosine and sphinganine and that the effectiveness of the metabolism of ceramide increases. Along with this exercise decreases muscular insulin resistance. Studies regarding muscular glucose uptake have been performed and continue to advance. However, studies about exercise, ceramide, muscular triglyceride, and glucose transport rates do not yet exist. Thus, in this experiment, we will explore whether a high fat diet paired with endurance exercises will have an effect on the insulin resistance and ceramide content in skeletal muscles.
INTRODUCTION
- Experimental animals
- In this experiment, 32 male Sprague-Dawley (SD) rats were were divided into four groups and were raised individually in separate (20.7 × 35 × 17 cm) cages. The rats were kept under a constant temperature of 21℃, and exposure to light was regulated in 12 hour intervals 12 hours (7:00-19:00) of darkness, and 12 hours of light (19:00-7:00). After a one-week environmental adaptation period, subjects were randomly placed into control group (CON), high fat diet group (HF), exercise group (Ex), and high fat diet/exercise group (HF/Ex).
- Measurements and methods
- The high fat diet group was provided with 40% beef tallow high fat feed (#101556 AIN-76A; Dyets Inc., Bethlehem, PA, USA), and the remaining groups were given regular feed (#100000 AIN-76A; Dyets Inc.). Food and water were provided ad libitum, and endurance training was implemented and regulated by a motorized treadmill (Jeonkook Machinery Co., Seoul, Korea) set at an 8% gradient. Rats exercised 5 times per week for 4 weeks. The treadmill speed and duration were gradually increased, and exercise implementation at 4 weeks was 24 m/min for 2 hours. The final bout of exercise was not performed in order to exclude the effects of exercise 24 hours prior to tissue sampling. After the 4 week study, the rats were forced to fast for 12 hours, after which they were injected with 6.5 mg of anesthetic (pentobarbital sodium) per 100 g of body weight, then muscle was removed and frozen with liquid nitrogen, and blood samples were collected from abdominal aorta, and plasma was separated via centrifuge and stored at -70℃. The soleus muscle was used to measure the glucose transport rate immediately after sampling.
- Total cholesterol (TC) and triglycerides (TG) were determined by an enzymatic method (Elitech, See, France). Free fatty acid (FFA) was measured using Noma's method [20].
- Plasma glucose levels were measured using a YSI 1500 blood and lactate analyzer (Yellow Spring Instrument Co., Yellow Springs, OH, USA). Insulin was measured with radioimmunoassay method using a diagnostic kit (Lincoplex Research Inc., St. Louis, MO, USA).
- The plantaris muscle was homogenized in buffer solution (50 mM potassium floride + 1 mM EDTA, pH 7.4) with 1 : 20 dilution, and the liver was homogenized with buffer solution (50 mM potassium phosphate + 1 mM EDTA, pH 7.4) as 1 : 10 dilution. The homogenized sample was mixed with SDS (100 mM), ethanol, n-heptane in order, and then centrifuged at 1,000 × g for 10 minutes. The supernatant was transferred to a tube, dried for 12 hours, and then the remaining liquid was completely evaporated using nitrogen gas. TG in the tube was dissolved with isopropanol, and then the concentration of TG was measured using diagnostic reagent (Elitech).
- Ceramide was measured using adenosine 5-[γ-32P] triphosphate [21]. The plantaris muscle was homogenized using Tris potassium chloride buffer (0.25 M sucrose, 25 mM KCl, 50 mM Tris, 0.5 mM EDTA, pH 7.4) with 1 : 10 dilution, and then lipid was extracted using the Burton method [22]. The experimental standard for ceramide used was: (brain; Avanti polar lipid Inc., Albastar, AL, USA). Extracted fat and ceramide standard was dissolved in 1,2-dioleoyl-sn-glycero-3-[phosphor-rac-(1-glycerol)] (DOPG) solution, was evaporated under nitrogen gas, and then re-dissolved using n-Octyl-β-D-glucopyranoside (β-OG) solution, vortex mixed to form micelles, and then it was incubated in 4℃ for 12 hours. DAG kinase reaction mixture (100 mM imidazole; pH 6.6, 100 mM LiCl, 25 mM MgCl2, 2 mM EGTA, 4 mM dithiothreitol, DAG kinase) and initiation mixture (10 mM imidazole; pH 6.6, 1 mM EDTA, 5 mM [32P]-γ-ATP) were added to a culture medium in order to make a DAG kinase reaction. It was then cultured at 26℃ for 30 minutes. Afterwards, lipid was extracted and then the remainder was evaporated using nitrogen gas. The lipid extract was eluted by adding chloroform/methanol (4 : 1, v/v) 40 µL. After dividing the mixture into 60 silica gel plates, the depths of each TLC chamber was set between 0.5-1 cm and then a solution composed of chloroform, acetone, methanol, acetic acid, and water (10 : 4 : 3 : 2 : 1, v/v) was added and then filtered to remove any bubbles, and following that, silica gel plates were inserted. After sample loading was completed, the plates were taken out and air dried. The plates were then exposed to X-ray film at -20℃ for 12 hours. Then, ceramide 1-[32P] phosphate's activity was measured for one minute per plate using a liquid scintillation counter (Wallac 1409 DSA; PerkinElmer Inc., Waltham, MA, USA).
- After separating gastronemius muscle into red gastronemius (RG), and white gastronemius (WG), they were mixed with a cold 1 : 20 HEPES buffer (20 mM N-2-hydroxyethylpiperazine-N'-2-ethanesulfonic acid, 1 mM EDTA, and 250 mM sucrose, pH 7.4), and then homogenized using a polytron homogenizer (Kinematica, Littau, Switzerland). Homogenized muscle tissue was diluted using 1 : 2 2x Laemmli sample buffer (S3401; Sigma-Aldrich, St. Louis, MO, USA), left out at room temperature for 20 minutes, and then 75 µg of protein containing sample was loaded into 10% SDS-polyacrylamide gel electrophoresis (PAGE), electrophoresis was initiated (100-120 V, 60-90 minutes). Standardization of GLUT-4 in each gel was verified by GLUT-4 content in 50 µg of rat cardiac muscle [23]. After electrophoresis was completed, the gel was divided and then using semi-dry (BioRad, Hercules, CA, USA), the gel was transferred to a PVDF membrane (BioRad). The transferred membrane was blocked in 5% non-fat skim milk for 60 minutes, and then incubated with GLUT-4 antiserum (Santa Cruz Biotechology, Santa Cruz, CA, USA) diluted to a 1 : 10,000 mixture (T-TBS/5% non-fat skin milk), and was shaken and incubated for 90 minutes. After washing, secondary antibodies (ZYMED Laboratories, South San Francisco, CA, USA) were diluted into a 1 : 5,000 ratio (T-TBS/1% non-fat skin milk) and incubated for 60 minutes. The GLUT-4 protein was visualized by Hyperfilm (Eastman Kodak, Rochester, NY, USA) using the Western blot luminal reagent (Santa Cruz Biotechology).
- Glucose transport rate was measured using Methyl [3H]-D-glucose and D-[1-14C] mannitol [24]. For the sake of measurement, thin portions (20-30 mg) of the left soleus muscle were extracted for use, and the removal of the muscular glucose, it was cleaned a single time with 18 mM mannitol and 0.1% BSA, + 2 mM pyruvate containing KHB for 10 minutes. After the initial cleaning, it was again incubated in 16 mM mannitol and 0.1% BSA, + 4 mM glucose + (with/without) Insulin (1,000 µIU/mL) containing [25,26] KHB for 30 minutes, cultured, and then cleaned for another 10 minutes. Afterwards, it was once again incubated at 30℃ in 4 mM [3-3H] MG (2.2 µCi/mL) and 16 mM [14C] mannitol (0.2 µCi/mL) containing 1.5 mL KHB. After culturing, the soleus muscle was fixed with liquid nitrogen and was immediately weighed. The weighed muscle was placed in 1 N NaOH and then put in a 50-60℃ water bath and shaken for 60 minutes. Afterwards, it was separated via centrifuge at 1,600 rpms for 4 minutes. The supernatant was removed and then after adding Optiphase Hisafe 2, it was measured with a liquid scintillation counter (Wallac 1220 Quantulus; PerkinElmer Inc.) for 10 minutes.
- Statistical analysis
- The mean and standard error (Mean ± SE) of each measurement was calculated, and statistical analysis was done using the statistics program, SPSS version 17.0 (SPSS Inc., Chicago, IL, USA). One-way ANOVA was used to see the change between groups after handling. Least significant difference (LSD) was used for post hoc analysis. The statistical significance was defined as P < 0.05.
METHODS
Experimental procedure
Plasma lipid concentration
Plasma glucose and insulin measurement
Skeletal muscle and liver TG
Skeletal muscle ceramide content
Skeletal muscle GLUT-4
Rate of glucose transport in skeletal muscle
- Weight
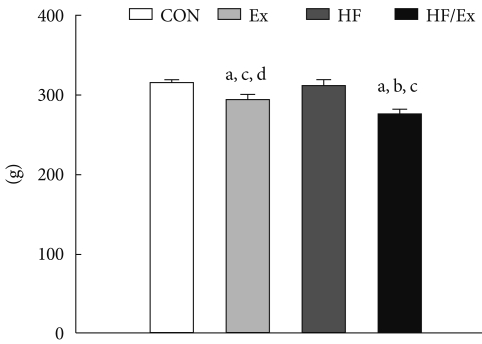
- After 4 weeks, the weight of the Ex group (293.9 ± 19.0 g) was compared with the other three groups (313.1 ± 4.1 g, 311.6 ± 4.6 g, 276.9 ± 3.3 g, respectively, P = 0.000) with notable differences between them. The weight of HF/Ex group (276.9 ± 3.3 g) was significantly lower than the other three groups (313.1 ± 4.1 g, 293.9 ± 19.0 g, 311.6 ± 4.6 g, respectively, P = 0.000) (Fig. 1).
- Blood plasma lipid
- Four weeks after the experimental period, the measured FFA concentrations of the CON and HF groups were significantly higher than in the Ex group (P = 0.032). The TC concentration in the HF group was significantly higher than the other three groups (P = 0.000). The concentration of TG in the HF and HF/Ex groups was significantly higher than the concentration in the CON and Ex groups, and concentration in the HF/Ex group was higher than the concentration in the HF group (P < 0.001) (Table 1).
- Plasma glucose and insulin
- Plasma glucose concentrations of groups Ex and HF/Ex 297.1 ± 14.9 mg/dL, 269.8 ± 9.1 mg/dL, respectively) were lower than the HF group (361.2 ± 19.0 mg/dL), and the concentration in the HF/Ex group was significantly lower than the concentration in the CON group (321.9 ± 1.3 mg/dL) (P = 0.002) (Fig. 2). The insulin concentration in the HF group (57.1 ± 6.4 µIU/mL) was significantly high compared to the other three groups (32.4 ± 5.5 µIU/mL, 28.6 ± 7.0 µIU/mL, 31.2 ± 8.0 µIU/mL, respectively, P = 0.021) (Fig. 3).
- TG in muscle and the liver
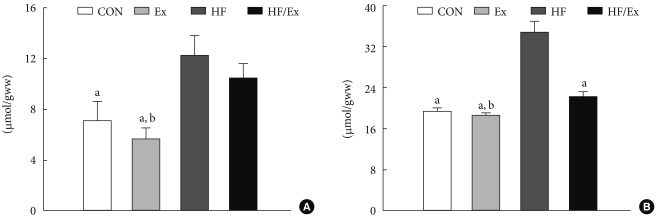
- The TG content in the plantaris muscle of the Ex group (5.7 ± 0.8 µmol/gww) was significantly lower than the HF/Ex group (10.4 ± 1.2 µmol/gww), and was significantly higher in the HF group (12.2 ± 1.7 µmol/gww) than in the CON and Ex groups (7.2 ± 1.4 µmol/gww, 5.7 ± 0.8 µmol/gww, respectively, P = 0.005). The TG content in the liver of the Ex group (18.7 ± 0.3 µmol/gww) was significantly lower than in the HF/Ex group (22.4 ± 0.7 µmol/gww), and was significantly higher in the HF group (34.9 ± 1.9 µmol/gww) than in the other three groups (P = 0.000) (Fig. 4).
- Skeletal muscle ceramide
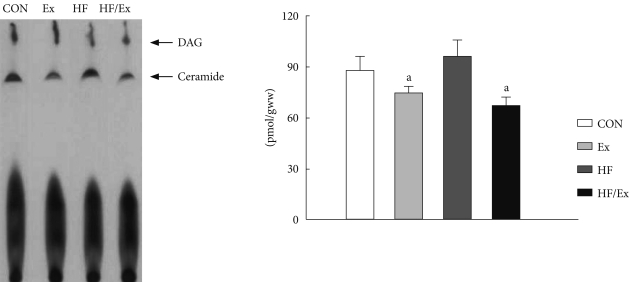
- Ceramide contents in the plantaris muscle in the Ex and HF/Ex (74.3 ± 4.0 pmol/mg, 67.1 ± 4.5 pmol/mg, respectively) groups were significantly lower than in the HF group (96.0 ± 9.5 pmol/mg, P = 0.031, Fig. 5).
- Skeletal muscle GLUT-4
- The GLUT-4 in the RG muscle in the Ex and HF/Ex groups (81.6 ± 6.8%, 74.8 ± 6.9%, respectively) was significantly higher than in the CON and HF groups (56.4 ± 5.3%, 54.1 ± 5.9%, respectively, P = 0.009). In the WG muscle, GLUT-4 in the Ex and HF/Ex (30.8 ± 2.8%, 31.2 ± 2.9%, respectively) groups were significantly higher than in the CON and HF groups (18.1 ± 2.5%, 20.2 ± 2.8%, respectively, P = 0.003, Fig. 6).
- Glucose transport rate in skeletal muscle
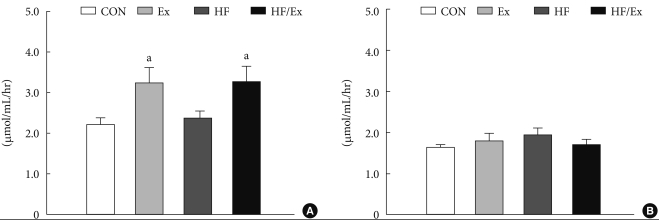
- The glucose transport rate in the soleus muscle in insulin-free conditions was very similar in all four groups. However, in submaximal conditions, the glucose transport rates in the Ex and HF/Ex (3.3 ± 0.4 µmol/mL/hr, 3.3 ± 0.4 µmol/mL/hr, respectively) groups are much higher than in the CON group (2.2 ± 0.2 µmol/mL/hr) (P = 0.043) (Fig. 7).
RESULTS
- In the current study which in investigating the effects of endurance exercise and high fat diet on insulin resistance, and ceramide content of SD-rats, plasma lipid (TC and TG), and insulin levels increased in high fat diet feed group beyond the regular diet feed group. This high fat diet raises the blood lipid level, and decreases the insulin sensitivity, and results in a tendency to have a higher resistance to insulin, which is also supported by existing studies [27]. However, a comparison between the two exercise groups and high fat diet group showed that insulin and glucose declined, and previous studies regarding endurance exercise showed an increase in insulin sensitivity and improved insulin resistance [28].
- High fat diet increases lipid content in the liver and muscle. We are documenting that muscular lipid accumulation drives the cellular glucose-fatty acid cycle, increases lipid oxidation, decreases muscular glucose uptake, and increases insulin resistance [29]. Zierath et al. [30] reported results on two groups of FVB mice placed on a 50% high fat intake diet, one for 3-4 weeks and the other for 8 weeks, with no decrease in total muscular GLUT-4 and a decrease in the glucose transport rate. Rosholt et al. [31] performed tests on two groups of SD rats, one placed on a high carbohydrate diet, and the other placed on a high fat diet, and reported that there was no substantial difference in GLUT-4 in the liver. In this experiment, a high fat diet resulted in an increase in liver and muscular TG, and it was reported that there is no significant difference between skeletal muscule glucose transporter (GLUT-4) and general glucose transport rate.
- Upon examining the effects of most of the past studies regarding muscular glucose uptake, Kahn and Pedersen [32] examined the results of an 80% high fat diet for 7 weeks, which showed a decline in the GLUT-4. Han et al. [33] reported on a high fat diet consisted of 32% hog fat over 8 weeks resulting in no influence on GLUT-4 after 4 weeks, and a decrease in the glucose transport rate after 8 weeks. This 4 week study of high fat diet and muscular GLUT-4 action is thought to be insufficient to observe the glucose transport rate changes, and further study considering more accurate setting of high fat intake contents, intake period, are required. Although there was such limitation, we observed increased GLUT-4 expression and glucose transport rate in two exercise groups, which is consistent with previous studies showing exercise decreased muscular insulin resistance [34-36].
- Recent studies report LCACoAs, DAG, and ceramide as major metabolites which causes increasing muscular insulin resistance [1,6]. We observed that muscular lipid accumulation and diverse lipids caused by a high fat diet interrupted insulin signal transduction and GLUT-4 translocation [9,37], especially muscular lipid accumulation suppressed sphingomyelinase activity and increased muscular sphingomyelin concentration, and ceramide accumulation caused an increase in insulin resistance [38].
- It is known that phosphorylation and activation of protein kinase B (Akt/PKB) is suppressed by ceramide, as far as results, the effects of membrane GLUT-4 in translocation also interrupts Akt's stimulatory pathway [9]. Mullen et al. [3] reported a 4 week trial using a 60% hog fat high fat diet resulting with the fatty acid transporter of the cell membrane, cellular DAG, and ceramide increasing. However, our study showed no apparent effect on the ceramide after 4 weeks of a high fat diet. Although the 40% high fat diet for 4 weeks caused an accumulation in muscular lipid and an increase in muscular insulin resistance, it did not increase muscular ceramide, suggesting a higher fat content for longer period is needed.
- Ceramide causes the hydrolysis of sphingomyelin in vivo. Both ceramide and sphingomyelin are important in the sphingomyelin-signaling pathway, and are inserted into the lysosome and endosome membranes by acidic sphingomyelinase's (aSMase) activity [39], and sphingomyelin is hydrolyzed into phorycholine and ceramide by nSMase [17]. Most previous studies have reported that intense exercise and endurance exercise decrease the concentrations of ceramide and DAG, while increasing insulin sensitivity [15-17,40]. Dobrzyn et al. [16] reported that endurance exercise decreases the concentration of muscular ceramide. Helge et al. [17] reported that trained groups and untrained groups had trivial differences in ceramide content from target, and maximum oxygen intake of the two groups was at 58% of target after a 3-hour single trial was conducted, and resulted in a decrease in the ceramide fatty content and nSMase of both groups. Our results showing exercise decreases ceramide is consistent previous studies [16,17]. The present study, both exercise groups showed a significant decrease in the ceramide content compared to the high fat diet group.
- To summarize this study, a high fat diet could significantly increase plasma lipid levels as well as in the liver and muscles, but insulin resistance markers including ceramide, GLUT-4, and muscular glucose uptake were not affected. Since, the endurance exercise group had improved GLUT-4, glucose transport rate, and muscular ceramide levels for 4 weeks compared to the non-exercising group, we can suggest the skeletal muscle insulin resistance was improved by endurance exercise. Therefore, endurance exercise could be helpful to improve the skeletal muscle insulin resistance which were developed from physical inactivity or high fat diet habits.
DISCUSSION
-
Acknowledgements
- This work was supported by the National Research Foundation of Korea Grant funded by the Korean Government (KRF-2006-311-G00003).
ACKNOWLEDGMENT
- 1. Consitt LA, Bell JA, Houmard JA. Intramuscular lipid metabolism, insulin action, and obesity. IUBMB Life 2009;61:47-55. ArticlePubMedPMC
- 2. Lee JS, Pinnamaneni SK, Eo SJ, Cho IH, Pyo JH, Kim CK, Sinclair AJ, Febbraio MA, Watt MJ. Saturated, but not n-6 polyunsaturated, fatty acids induce insulin resistance: role of intramuscular accumulation of lipid metabolites. J Appl Physiol 2006;100:1467-1474. ArticlePubMed
- 3. Mullen KL, Pritchard J, Ritchie I, Snook LA, Chabowski A, Bonen A, Wright D, Dyck DJ. Adiponectin resistance precedes the accumulation of skeletal muscle lipids and insulin resistance in high-fat-fed rats. Am J Physiol Regul Integr Comp Physiol 2009;296:R243-R251. ArticlePubMed
- 4. Mullen KL, Smith AC, Junkin KA, Dyck DJ. Globular adiponectin resistance develops independently of impaired insulin-stimulated glucose transport in soleus muscle from high-fat-fed rats. Am J Physiol Endocrinol Metab 2007;293:E83-E90. ArticlePubMed
- 5. Zderic TW, Davidson CJ, Schenk S, Byerley LO, Coyle EF. High-fat diet elevates resting intramuscular triglyceride concentration and whole body lipolysis during exercise. Am J Physiol Endocrinol Metab 2004;286:E217-E225. ArticlePubMed
- 6. Delarue J, Magnan C. Free fatty acids and insulin resistance. Curr Opin Clin Nutr Metab Care 2007;10:142-148. ArticlePubMed
- 7. Ohanian J, Ohanian V. Sphingolipids in mammalian cell signalling. Cell Mol Life Sci 2001;58:2053-2068. ArticlePubMedPDF
- 8. Summers SA. Ceramides in insulin resistance and lipotoxicity. Prog Lipid Res 2006;45:42-72. ArticlePubMed
- 9. Chavez JA, Knotts TA, Wang LP, Li G, Dobrowsky RT, Florant GL, Summers SA. A role for ceramide, but not diacylglycerol, in the antagonism of insulin signal transduction by saturated fatty acids. J Biol Chem 2003;278:10297-10303. ArticlePubMed
- 10. Powell DJ, Turban S, Gray A, Hajduch E, Hundal HS. Intracellular ceramide synthesis and protein kinase Czeta activation play an essential role in palmitate-induced insulin resistance in rat L6 skeletal muscle cells. Biochem J 2004;382(Pt 2):619-629. PubMedPMC
- 11. Shah C, Yang G, Lee I, Bielawski J, Hannun YA, Samad F. Protection from high fat diet-induced increase in ceramide in mice lacking plasminogen activator inhibitor 1. J Biol Chem 2008;283:13538-13548. ArticlePubMedPMC
- 12. Bruce CR, Thrush AB, Mertz VA, Bezaire V, Chabowski A, Heigenhauser GJ, Dyck DJ. Endurance training in obese humans improves glucose tolerance and mitochondrial fatty acid oxidation and alters muscle lipid content. Am J Physiol Endocrinol Metab 2006;29:E99-E107. Article
- 13. Schmitz-Peiffer C, Craig DL, Biden TJ. Ceramide generation is sufficient to account for the inhibition of the insulin-stimulated PKB pathway in C2C12 skeletal muscle cells pretreated with palmitate. J Biol Chem 1999;274:24202-24210. ArticlePubMed
- 14. Yu C, Chen Y, Cline GW, Zhang D, Zong H, Wang Y, Bergeron R, Kim JK, Cushman SW, Cooney GJ, Atcheson B, White MF, Kraegen EW, Shulman GI. Mechanism by which fatty acids inhibit insulin activation of insulin receptor substrate-1 (IRS-1)-associated phosphatidylinositol 3-kinase activity in muscle. J Biol Chem 2002;277:50230-50236. ArticlePubMed
- 15. Dobrzyn A, Gorski J. Ceramides and sphingomyelins in skeletal muscles of the rat: content and composition. Effect of prolonged exercise. Am J Physiol Endocrinol Metab 2002;282:E277-E285. ArticlePubMed
- 16. Dobrzyn A, Zendzian-Piotrowska M, Gorski J. Effect of endurance training on the sphingomyelin-signalling pathway activity in the skeletal muscles of the rat. J Physiol Pharmacol 2004;55:305-313. PubMed
- 17. Helge JW, Dobrzyn A, Saltin B, Gorski J. Exercise and training effects on ceramide metabolism in human skeletal muscle. Exp Physiol 2004;89:119-127. ArticlePubMedPDF
- 18. Ivy JL. Muscle insulin resistance amended with exercise training: role of GLUT4 expression. Med Sci Sports Exerc 2004;36:1207-1211. PubMed
- 19. Dobrzyn A, Gorski J. Effect of acute exercise on the content of free sphinganine and sphingosine in different skeletal muscle types of the rat. Horm Metab Res 2002;34:523-529. ArticlePubMed
- 20. Noma A, Okabe H, Kita M. Determination of serum cholinesterase activity by means of automatic titration. Rinsho Byori 1973;21:457-460. PubMed
- 21. Perry DK, Bielawska A, Hannun YA. Quantitative determination of ceramide using diglyceride kinase. Methods Enzymol 2000;312:22-31. ArticlePubMed
- 22. Burton AF, Anderson FH. Increased cholesteryl ester content in liver of mice fed lipid emulsion diets high in polyunsaturated fats. JPEN J Parenter Enteral Nutr 1985;9:480-482. ArticlePubMed
- 23. Lee JS, Bruce CR, Tunstall RJ, Cameron-Smith D, Hugel H, Hawley JA. Interaction of exercise and diet on GLUT-4 protein and gene expression in Type I and Type II rat skeletal muscle. Acta Physiol Scand 2002;175:37-44. ArticlePubMedPDF
- 24. Fisher JS, Nolte LA, Kawanaka K, Han DH, Jones TE, Holloszy JO. Glucose transport rate and glycogen synthase activity both limit skeletal muscle glycogen accumulation. Am J Physiol Endocrinol Metab 2002;282:E1214-E1221. ArticlePubMed
- 25. Sherman WM, Katz AL, Cutler CL, Withers RT, Ivy JL. Glucose transport: locus of muscle insulin resistance in obese Zucker rats. Am J Physiol 1988;255:E374-E382. ArticlePubMed
- 26. Willems ME, Brozinick JT Jr, Torgan CE, Cortez MY, Ivy JL. Muscle glucose uptake of obese Zucker rats trained at two different intensities. J Appl Physiol 1991;70:36-42. ArticlePubMed
- 27. Safwat GM, Pisano S, D'Amore E, Borioni G, Napolitano M, Kamal AA, Ballanti P, Botham KM, Bravo E. Induction of non-alcoholic fatty liver disease and insulin resistance by feeding a high-fat diet in rats: does coenzyme Q monomethyl ether have a modulatory effect? Nutrition 2009;25:1157-1168. ArticlePubMed
- 28. Silva AS, Pauli JR, Ropelle ER, Oliveira AG, Cintra DE, De Souza CT, Velloso LA, Carvalheira JB, Saad MJ. Exercise intensity, inflammatory signaling and insulin resistance in obese rats. Med Sci Sports Exerc Epub 2010 May 13. DOI: 10.1249/MSS.0b013e3181e45d08.
- 29. Roden M, Price TB, Perseghin G, Petersen KF, Rothman DL, Cline GW, Shulman GI. Mechanism of free fatty acid-induced insulin resistance in humans. J Clin Invest 1996;97:2859-2865. ArticlePubMedPMC
- 30. Zierath JR, Houseknecht KL, Gnudi L, Kahn BB. High-fat feeding impairs insulin-stimulated GLUT4 recruitment via an early insulin-signaling defect. Diabetes 1997;46:215-223. ArticlePubMed
- 31. Rosholt MN, King PA, Horton ES. High-fat diet reduces glucose transporter responses to both insulin and exercise. Am J Physiol 1994;266:R95-R101. ArticlePubMed
- 32. Kahn BB, Pedersen O. Suppression of GLUT4 expression in skeletal muscle of rats that are obese from high fat feeding but not from high carbohydrate feeding or genetic obesity. Endocrinology 1993;132:13-22. ArticlePubMed
- 33. Han DH, Hansen PA, Host HH, Holloszy JO. Insulin resistance of muscle glucose transport in rats fed a high-fat diet: a reevaluation. Diabetes 1997;46:1761-1767. ArticlePubMed
- 34. Gan SK, Kriketos AD, Ellis BA, Thompson CH, Kraegen EW, Chisholm DJ. Changes in aerobic capacity and visceral fat but not myocyte lipid levels predict increased insulin action after exercise in overweight and obese men. Diabetes Care 2003;26:1706-1713. ArticlePubMedPDF
- 35. Goodpaster BH, Katsiaras A, Kelley DE. Enhanced fat oxidation through physical activity is associated with improvements in insulin sensitivity in obesity. Diabetes 2003;52:2191-2197. ArticlePubMedPDF
- 36. Tanaka S, Hayashi T, Toyoda T, Hamada T, Shimizu Y, Hirata M, Ebihara K, Masuzaki H, Hosoda K, Fushiki T, Nakao K. High-fat diet impairs the effects of a single bout of endurance exercise on glucose transport and insulin sensitivity in rat skeletal muscle. Metabolism 2007;56:1719-1728. ArticlePubMed
- 37. Montell E, Turini M, Marotta M, Roberts M, Noe V, Ciudad CJ, Mace K, Gomez-Foix AM. DAG accumulation from saturated fatty acids desensitizes insulin stimulation of glucose uptake in muscle cells. Am J Physiol Endocrinol Metab 2001;280:E229-E237. ArticlePubMed
- 38. Baranowski M, Blachnio A, Zabielski P, Gorski J. PPARalpha agonist induces the accumulation of ceramide in the heart of rats fed high-fat diet. J Physiol Pharmacol 2007;58:57-72.
- 39. Monney L, Olivier R, Otter I, Jansen B, Poirier GG, Borner C. Role of an acidic compartment in tumor-necrosis-factor-alpha-induced production of ceramide, activation of caspase-3 and apoptosis. Eur J Biochem 1998;251:295-303. PubMed
- 40. Gorski J, Dobrzyn A, Zendzian-Piotrowska M. The sphingomyelin-signaling pathway in skeletal muscles and its role in regulation of glucose uptake. Ann N Y Acad Sci 2002;967:236-248. ArticlePubMed
REFERENCES
Fig. 1Changes in body weight. Data are shown as means ± standard error, n = 8. CON, control group; HF, high fat diet group; Ex, exercise group; HF/Ex, high fat diet/exercise group. aP < 0.05 vs. CON, bP < 0.05 vs. Ex, cP < 0.05 vs. HF, dP < 0.05 vs. HF/Ex.

Fig. 2Changes in glucose level. Data are shown as means ± standard error, n = 8. CON, control group; HF, high fat diet group; Ex, exercise group; HF/Ex, high fat diet/exercise group. aP < 0.05 vs. CON, bP < 0.05 vs. HF.
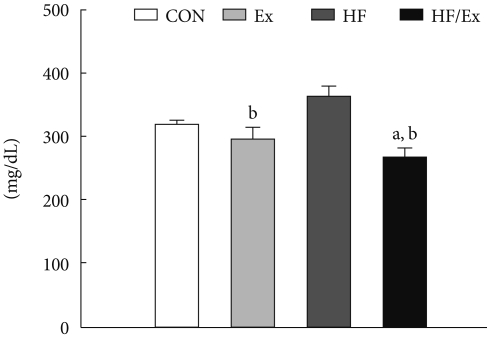
Fig. 3Plasma insulin concentrations. Data are shown as means ± standard error, n = 8. CON, control group; HF, high fat diet group; Ex, exercise group; HF/Ex, high fat diet/exercise group. aP < 0.05 vs. HF.
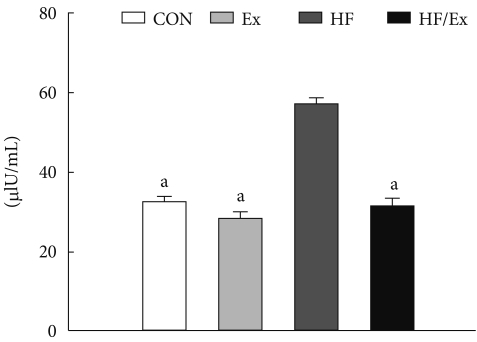
Fig. 4(A) Triglyceride contents in muscle. (B) Triglyceride contents in the liver. Data are shown as means ± standard error, n = 8. CON, control group; HF, high fat diet group; Ex, exercise group; HF/Ex, high fat diet/exercise group. aP < 0.05 vs. HF, bP < 0.05 vs. HF/Ex.

Fig. 5Ceramide contents in the plantaris muscle. Data are shown as means ± standard error, n = 7. CON, control group; HF, high fat diet group; Ex, exercise group; HF/Ex, high fat diet/exercise group. aP < 0.05 vs. HF.

Fig. 6(A) GLUT-4 contents in the red gastrocnemius muscle. (B) GLUT-4 contents in the white gastrocnemius muscle. Data are shown as means ± standard error, n = 8. CON, control group; HF, high fat diet group; Ex, exercise group; HF/Ex, high fat diet/exercise group. aP < 0.05 vs. CON, bP < 0.05 vs. HF.
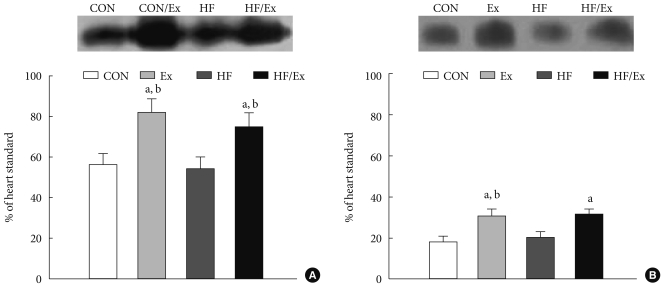
Fig. 7(A) Glucose transport rate at submaximal insulin concentrations in the soleus muscle. (B) Glucose transport rate at non-insulin concentrations in soleus muscle. Data are shown as means ± standard error, n = 7. CON, control group; HF, high fat diet group; Ex, exercise group; HF/Ex, high fat diet/exercise group. aP < 0.05 vs. CON.

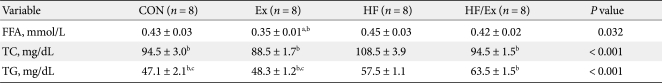
Figure & Data
References
Citations
Citations to this article as recorded by 
- Early warning for inactive ovaries based on liver function index, serum MDA, IL-6, FGF21 and ANGPTL8 in dairy cows
Zhijie Wang, Yuxi Song, Feng Zhang, Chang Zhao, Shixin Fu, Cheng Xia, Yunlong Bai
Italian Journal of Animal Science.2022; 21(1): 113. CrossRef - Metabolic Syndrome is Associated with Ceramide Accumulation in Visceral Adipose Tissue of Women with Morbid Obesity
Barbara Choromańska, Piotr Myśliwiec, Hady Razak Hady, Jacek Dadan, Hanna Myśliwiec, Adrian Chabowski, Agnieszka Mikłosz
Obesity.2019; 27(3): 444. CrossRef - Changes in Membrane Ceramide Pools in Rat Soleus Muscle in Response to Short-Term Disuse
Alexey M. Petrov, Maria N. Shalagina, Vladimir A. Protopopov, Valeriy G. Sergeev, Sergey V. Ovechkin, Natalia G. Ovchinina, Alexey V. Sekunov, Andrey L. Zefirov, Guzalia F. Zakirjanova, Irina G. Bryndina
International Journal of Molecular Sciences.2019; 20(19): 4860. CrossRef - Lipids in psychiatric disorders and preventive medicine
Miriam Schneider, Beth Levant, Martin Reichel, Erich Gulbins, Johannes Kornhuber, Christian P. Müller
Neuroscience & Biobehavioral Reviews.2017; 76: 336. CrossRef - A mitochondrial-targeted ubiquinone modulates muscle lipid profile and improves mitochondrial respiration in obesogenic diet-fed rats
Charles Coudray, Gilles Fouret, Karen Lambert, Carla Ferreri, Jennifer Rieusset, Agnieszka Blachnio-Zabielska, Jérôme Lecomte, Raymond Ebabe Elle, Eric Badia, Michael P. Murphy, Christine Feillet-Coudray
British Journal of Nutrition.2016; 115(7): 1155. CrossRef - The Metabolic Implications of Glucocorticoids in a High-Fat Diet Setting and the Counter-Effects of Exercise
Emily Dunford, Michael Riddell
Metabolites.2016; 6(4): 44. CrossRef - Effects of Exercise Intensity on PGC-1α, PPAR-γ, and Insulin Resistance in Skeletal Muscle of High Fat Diet-fed Sprague-Dawley Rats
Hyun-Lyung Jung, Ho-Youl Kang
Journal of the Korean Society of Food Science and Nutrition.2014; 43(7): 963. CrossRef - The roles of aerobic exercise training and suppression IL-6 gene expression by RNA interference in the development of insulin resistance
Hui Tang, Min-hao Xie, Yu Lei, Liang Zhou, Yu-ping Xu, Jian-guang Cai
Cytokine.2013; 61(2): 394. CrossRef - Long-Term Consequences of Developmental Alcohol Exposure on Brain Structure and Function: Therapeutic Benefits of Physical Activity
Anna Klintsova, Gillian Hamilton, Karen Boschen
Brain Sciences.2012; 3(4): 1. CrossRef
 PubReader
 Cite
Cite