Intra-Abdominal Fat and High Density Lipoprotein Cholesterol Are Associated in a Non-Linear Pattern in Japanese-Americans
Article information

Abstract
Background
We describe the association between high density lipoprotein cholesterol (HDL-C) concentration and computed tomography (CT)-measured fat depots.
Methods
We examined the cross-sectional associations between HDL-C concentration and intra-abdominal (IAF), abdominal subcutaneous (SCF), and thigh fat (TF) areas in 641 Japanese-American men and women. IAF, SCF, and TF were measured by CT at the level of the umbilicus and mid-thigh. The associations between fat area measurements and HDL-C were examined using multivariate linear regression analysis adjusting for age, sex, diabetes family history, homeostasis model assessment of insulin resistance (HOMA-IR), and body mass index (BMI). Non-linearity was assessed using fractional polynomials.
Results
Mean±standard deviation of HDL-C concentration and IAF in men and women were 1.30±0.34 mg/dL, 105±55.3 cm2, and 1.67±0.43 mg/dL, 74.4±46.6 cm2 and differed significantly by gender for both comparisons (P<0.001). In univariate analysis, HDL-C concentration was significantly associated with CT-measured fat depots. In multivariate analysis, IAF was significantly and non-linearly associated with HDL-C concentration adjusted for age, sex, BMI, HOMA-IR, SCF, and TF (IAF: β=−0.1012, P<0.001; IAF2: β=0.0008, P<0.001). SCF was also negatively and linearly associated with HDL-C (β=−0.4919, P=0.001).
Conclusion
HDL-C does not linearly decline with increasing IAF in Japanese-Americans. A more complex pattern better fits this association.
INTRODUCTION
Interest in body fat composition has increased with technologic developments and recognition that easily obtainable measurements such as body mass index (BMI) do not distinguish between fat and fat-free mass and that waist circumference fails to differentiate between subcutaneous and visceral fat [1]. It further became clear that higher risk of cardiovascular disease or death was not only related to overall excess adiposity, as seen in the inconsistent associations between BMI and these outcomes, but also that body fat distribution is an important factor [23].
With the advent of computed tomography (CT) that enables reproducible and accurate measurement of subcutaneous and visceral adipose tissue (intra-abdominal fat [IAF]) areas, the important roles of different adipose tissue depots in metabolic diseases have been recognized [4]. Given the same degree of overall abdominal obesity, greater visceral fat amount is related to higher risk of decreased insulin sensitivity [56]. In particular, IAF is not only associated with insulin sensitivity but also metabolic diseases and greater cardiovascular disease risk (CVD) [7]. Furthermore, the association may be causal as reductions in IAF were associated with improvements in metabolic biomarkers [8].
High density lipoprotein cholesterol (HDL-C) is well known as “good” cholesterol, with higher levels associated with lower risk of CVD [9,10]. HDL-C plays an important role in eliminating excessive cholesterol in peripheral tissues through cholesterol retrograde transport [11]. Several studies have reported that adipose tissue may play an essential role in regulating cholesterol metabolism, especially HDL-C, with the IAF depot having particular importance in this regard. Dysfunctional adipose tissue characterized by an abnormal pattern of fat distribution and exhibiting abnormalities in free fatty acid metabolism and cytokine secretion [12], often coexists with a reduction in circulating HDL-C levels [1314].
IAF is well known to play a role in the development of insulin resistance and has been associated with other metabolic abnormalities including lower HDL-C concentration [6]. However, there have been few studies that have examined the shape of the association between IAF and HDL-C. Therefore, the aim of this study was to investigate the strength and shape of the relationship between IAF and HDL-C concentration.
METHODS
Study population
The study population consisted of men and women enrolled in the Japanese-American Community Diabetes Study, a cohort of second- (Nisei) and third-generation (Sansei) Japanese-Americans of 100% Japanese ancestry. A detailed description of the selection and recruitment of the study subjects has been published previously [1516]. In brief, study participants were selected as volunteers from a community-wide comprehensive mailing list and telephone directory that included nearly 95% of the Japanese-American population in King County, Washington from 1983 to 1988. Among the total of 658 subjects in the original cohort, 17 subjects were excluded because CT data were not available. Thus, a total of 641 subjects (346 men, 295 women) aged 34 to 75 years (mean age of 54.1 years) were included. This study received approval from the University of Washington Human Subjects Division and all subjects provided written informed consent (Institutional Review Board number 35081). Signed informed consent was obtained from all participants. Investigations were carried out in accordance with the principles of the Declaration of Helsinki.
Clinical and laboratory examination
All evaluations were performed at the General Clinical Research Center, University of Washington Medical Center. At baseline, a complete physical examination was performed, and personal medical history and lifestyle factors possibly associated with lipid concentrations, including cigarette smoking, alcohol consumption, and physical activity were self-reported using a standardized questionnaire. Family history of diabetes was considered positive if any first-degree relative had diabetes. BMI was calculated as weight in kilograms divided by the square of the height in meters. All blood samples were obtained following an overnight fast of 10 hours.
Biochemical measurements were performed as reported in detail previously such as glucose, insulin, lipid and lipoprotein measurements [151718]. Plasma glucose was measured by the hexokinase method using an autoanalyzer (University of Washington, Department of Laboratory Medicine, Seattle, WA, USA). Plasma insulin was measured by radioimmunoassay (Diabetes Research Center, University of Washington, Seattle, WA, USA). To estimate insulin sensitivity, the homeostasis model assessment of insulin resistance (HOMA-IR) index based on fasting glucose and insulin concentrations was calculated as (fasting serum insulin [IU/mL]×fasting serum glucose [mg/dL])/405 [19]. Lipids and lipoproteins measurements were performed according to modified procedures of the Lipid Research Clinics (Northwest Lipid Research Laboratory, University of Washington, Seattle, WA, USA). Single 10 mm slice CT scans were performed at the level of the umbilicus to measure cross-sectional fat areas (cm2) of abdominal subcutaneous fat (SCF) and IAF. Thigh fat (TF) area was measured midway between the greater trochanter and superior margin of the patella. CT scans were analyzed using density contour software (Standard GE 8800 computer software). Attenuation range for identification of fat was −250 to −50 Hounsfield units [20].
Statistical analyses
Continuous variables are expressed as mean±standard deviation (SD), and categorical variables are expressed as numbers and percentages. We estimated unadjusted linear regression coefficients between HDL-C as the dependent variable and metabolic variables, anthropometric variables, or body composition measures on CT scan as the independent variables. Multiple regression analysis was carried out to assess the independent relationships between HDL-C concentration in relation to IAF while adjusting for covariates such as age, sex, BMI, regional fat depots, insulin sensitivity, and family history of diabetes. Possible interactions between sex and IAF were tested by the insertion of first-order interaction terms into the regression model. Assessment of non-linearity was performed using the method of fractional polynomials [21]. Partial residual plots were used to display the association between HDL-C and IAF in multivariable models which adjust for the effects of covariates. All statistical analyses were performed using Stata/MP version 15.1 (Stata Corp., College Station, TX, USA). A two-sided P value of <0.05 was considered to indicate statistical significance.
RESULTS
Baseline characteristics of the study subjects
The clinical and laboratory characteristics of these subjects are shown in Table 1. Among 658 subjects, we excluded 17 subjects without CT adiposity data, leaving a total of 641 subjects for inclusion in this analysis. The subjects were middle-aged, with men and women of similar age. Their average BMI would classify them as overweight based on criteria for Asians, although the BMI was (or tended to be) lower in females. HDL-C concentrations were greater and triglyceride levels lower in women, both being in their respective normal ranges. CT-fat areas measurements revealed greater SCF areas in women and greater IAF in men. Insulin sensitivity determined as HOMA-IR did not differ between the sexes. Fasting plasma glucose concentration was greater in men. Few participants were receiving medications to lower lipid concentration.

Baseline characteristics of the study population
Univariate analysis of baseline characteristics
This analysis of baseline characteristics revealed that HDL-C concentration was significantly and negatively associated with BMI, fasting plasma glucose, IAF, SCF and HOMA-IR and was positively associated with TF (Table 2). However, age, family history of diabetes, total cholesterol and low density lipoprotein cholesterol did not show a significant association with HDL-C.

Univariate regression analysis of HDL-C in relation to measurements of body fat or metabolic characteristics
Multivariate analyses predicting HDL-C
We performed these analyses to determine whether IAF independently predicted HDL-C concentration (Table 3). IAF was significantly and negatively associated with HDL-C concentration, while age and sex showed significant positive associations with HDL-C in Model 1. Model 2 showed that IAF was significantly and inversely associated with HDL-C concentration after adjusting for HOMA-IR. We applied the fractional polynomial approach to Model 2 to explore whether a non-linear pattern existed between IAF and HDL-C. The non-linear association that best fit the data is shown in Fig. 1A, where the HDL-C slope is initially negative, then levels out before rebounding with increasing IAF. The significant negative linear association between IAF and HDL-C concentration persisted when Model 3 and Model 4 were created (Table 3). We applied the fractional polynomial method to Model 4 in Table 3 which yielded the result shown in Model 5, where both the linear version of IAF and IAF2 were found to yield the best model fit (Table 3). The plot of HDL-C on the y axis by IAF on the x axis of Model 5 (Fig. 1B) yielded virtually the same curvilinear association as seen in Fig. 1A. Of note, SCF also became significantly and negatively correlated with IAF in Model 5 but the linear model best fit this association. We further added triglyceride concentration to Model 5 and the results are shown in Model 6 (Table 3). Despite adjustment for this lipid concentration, the curvilinear association persists between IAF and HDL-C as shown by the significant associations with both IAF and IAF2.

Multivariable linear regression analysis of the association between HDL-C and body fat or metabolic characteristics
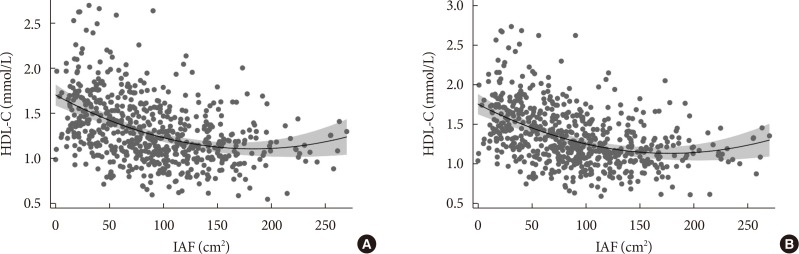
(A) Association between high density lipoprotein cholesterol (HDL-C) and intra-abdominal fat (IAF) after adjusting for age, sex, body mass index (BMI), and homeostasis model assessment of insulin resistance (HOMA-IR). The X axis denotes IAF (cm2) and the Y axis denotes the partial residual (predicted value+residual) of HDL-C concentration (mmol/L) from the regression of IAF (cm2) value while adjusting for age, sex, BMI, and HOMA-IR. Shaded regions denote 95% confidence interval for the modeled curvilinear association. (B) Association between HDL-C and IAF after adjusting for age, sex, BMI, HOMA-IR, Abdomen subcutaneous fat (SCF), and thigh fat (TF). Association between HDL-C and IAF after adjusting age, sex, BMI, HOMA-IR, SCF, and TF. The X axis denotes IAF (cm2) and the Y axis denotes the partial residual (predicted value+residual) of HDL-C concentration (mmol/L) from the regression of IAF (cm2) value while adjusting for age, sex, BMI, HOMA-IR, SCF, and TF. Shaded regions denote 95% confidence interval for the modeled curvilinear association.
Since both IAF and HDL-C are known to differ by sex, we tested whether the association between IAF and HDL-C differed by sex through insertion of an IAF×sex interaction term into Model 5. No significant interaction was seen between IAF and sex (IAF×sex interaction term coefficient, −0.000045; P=0.438) when this term was inserted into the regression model. Also, there was no significant interaction between quadratic IAF and sex (IAF2×sex interaction term coefficient, 0.00000047; P=0.863).
We repeated the analysis with several modifications to see whether the non-linear association between IAF and HDL-C remained. Model 5 in Table 3 was repeated after exclusion of the participants receiving lipid lowering medications. Also, Model 5 in Table 3 was repeated with fasting plasma glucose and insulin concentrations inserted in place of HOMA-IR. Model 5 in Table 3 was also repeated with the addition of serum triglycerides as a covariate. The significant non-linear association between IAF and HDL-C concentration persisted despite these changes (data not shown). Besides, we have repeated our analyses excluding patients with diabetes and found that our results were unchanged.
In addition, we considered whether the non-linearity was explained by the probable physiologic lower limit of HDL-C levels of approximately 25 mg/dL. So we repeated the analysis by excluding all subjects with an HDL-C of 25 mg/dL or less (Table 4). A similar non-linear association between IAF and HDL-C remained after this exclusion. Moreover, we repeated the analysis to see that a non-linear association was present with HDL-C concentration above 40 mg/dL (Table 4). This analysis continued to demonstrate a non-linear association in the range of HDL-C values well above a physiologic lower limit.

Multivariable fractional polynomial regression analysis of the prediction of HDL-C in relation to measurements of body fat adjusted for age, sex, and insulin sensitivity for values of HDL-C above lower limits
DISCUSSION
In the present study, we report novel information that the association between HDL-C and IAF is non-linear in Japanese-Americans. Intriguingly, greater IAF accumulation is not continuously associated with declining HDL-C. A point exists beyond which IAF accumulation does not have negative metabolic consequences for the HDL-C concentration. The association between IAF and HDL-C was not appreciably affected by adjustment for other factors potentially influencing either IAF or HDL-C, including insulin sensitivity, age, sex, and other measurements of body composition, and did not significantly differ by sex [22]. Furthermore, the non-linear association was present well above a possible physiologic lower limit for HDL-C concentration. In contrast, the associations of SCF and TF with HDL-C were inconsistently associated with HDL-C depending on which covariates were in the model. These findings provide evidence that IAF is more strongly associated with HDL-C than the other fat depots that we assessed. This discrepancy might be due to the demonstrated structural and functional differences between IAF and SCF in vascular distribution, adipocyte size, secretome, and receptor expression [2324].
The association between lower HDL-C concentration with greater visceral obesity has been reported previously in multiple different populations. In healthy obese premenopausal women, greater IAF accumulation was associated with lower HDL-C concentration [25]. In obese postmenopausal women, visceral to total abdominal fat ratio (VAT/TAF) was negatively correlated with HDL-C concentration [26] IAF area was negatively associated with HDL-C concentration but not SCF in Italian subjects with dyslipidemia [27]. The negative association between visceral fat and HDL-C concentration has also been reported in Chinese populations. Lower serum HDL-C concentration was associated with greater IAF area in a Chinese non-diabetic population [28].
Not all obese persons have metabolic diseases, hence the term “metabolically healthy obesity,” and arguing for non-uniformity with regard to the metabolic consequences of excess adiposity, in particular HDL-C concentration. This healthy obese state, though, is often transient, as we have reported, and more likely to convert to an unhealthy phenotype in persons with greater IAF area [29]. Greater IAF is known to increase risk of developing other abnormal metabolic conditions independent of insulin sensitivity and size of other fat depots. These conditions include impaired glucose tolerance, diabetes mellitus, hypertension, and lower probability of conversion of prehypertension to normotension [17303132]. In addition, our previous studies have shown that greater IAF at baseline and increase in IAF over 5 years were independently associated with lower future HDL-C concentration [33].
We speculate that there are multiple causes of HDL-C concentration in addition to body composition such as, for example, sex, age, alcohol use, physical activity, genetic determinants, and other factors. Each component cause likely contributes fractionally to result in the observed HDL-C concentration. Therefore, it would not be possible for an adverse body composition change to reduce HDL-C concentration below that concentration enabled by the other component causes of it. The leveling-off of the association between IAF and HDL-C concentration thereby represents the floor of the contribution of IAF to HDL-C and the ceiling of the other multiple determinants of this lipoprotein concentration.
There are several possible mechanisms whereby greater IAF may cause low HDL-C concentration. The potential pathways leading to lower concentration of HDL-C may involve insulin resistance and impaired adipose tissue function [34353637]. Greater visceral fat area was positively correlated with lathosterol concentration, a surrogate marker for cholesterol synthesis, independent of BMI and waist circumference, and negatively correlated with surrogate markers of cholesterol absorption [27]. Markers of cholesterol absorption such as sitosterol or campersterol were inversely correlated with viceral fat area (VFA) and indices of insulin sensitivity but directly correlated with HDL-C, arguing that the association between VFA and cholesterol absorption may be one pathway leading to lower HDL-C. Reduced insulin sensitivity accompanying greate IAF is associated with multiple additional changes affecting HDL catabolism including blunting of lipoprotein lipase activity [26]; higher fractional catabolic rate of apoA-I, the major protein component of HDL [3839]; and triglyceride enrichment of HDL-C that increases its metabolic clearance [40]. These processes contribute to the lowering of HDL-C concentration [3640]. In concordance with these phenomena, we have also reported that greater baseline and increase in IAF were independent predictors for future development of atherogenic dyslipidemia, a key component of which is HDL-C concentration [33]. To our knowledge, there is no information suggesting that these biologic processes underlying the association between IAF and HDL-C concentration should level out or show an upward trend as IAF increases, as we observed in this analysis, even at HDL-C concentrations substantially greater than minimum values.
Low HDL-C concentration is a well-established risk factor for cardiovascular disease, but there is evidence that high HDL-C levels do not always confer cardiovascular risk protection. A rare genetic variant found in a specific molecule known as scavenger receptor class B type 1 (SR-BI) was reported in association with HDL-C concentration greater than 95 milligrams per deciliter (mg/dL) and higher risk of heart disease [41]. An analysis of two prospective population-based studies in Denmark identified a U-shaped associated between all-cause mortality and HDL-C concentration, with the optimal levels for lowest mortality at 73 mg/dL in men and 93 mg/dL in women [42]. As can be seen in Fig. 1, a substantial number of participants in our research with a generally accepted elevated IAF >100 cm2 had higher HDL-C concentrations, and thus were at higher risk for other metabolic complications associated with excess visceral fat that might obviate potential benefits of high HDL-C.
The strengths of the present study include direct CT measurements of fat depots that provided an accurate assessment of fat areas at the regions of interest. To our knowledge, this is the first study that has examined the shape of the association between visceral adiposity and HDL-C concentration, finding it to be a non-linear relationship. However, our study has several limitations. First, since this study focused entirely on Japanese-Americans, whether the findings would be the same in other Asian or non-Asian populations is unknown. Second, the present findings should be qualified given the observational nature of our study design, which precludes conclusions about causality. In addition, as is true for all observational research, it is possible that unknown confounding factors may be responsible for the associations noted between HDL-C concentration and adiposity or insulin resistance identified in this study. We also did not consider HDL-C function or further characterize its structure.
In conclusion, the present study provides evidence that the association between IAF and HDL-C concentrations is non-linear in Japanese-American men and women. The implication of this finding is that it argues that the role of visceral fat in dyslipidemia is more complicated than previously imagined and will require further investigation.
ACKNOWLEDGMENTS
We are grateful to the King County Japanese-American community for support and cooperation. National Institutes of Health grants DK-31170 and HL-49293. This work was supported by facilities and services provided by the Diabetes Research Center (DK-017047), Clinical Nutrition Research Unit (DK-035816), and the General Clinical Research Center (RR-000037) at the University of Washington. The funding entities had no role in the conduct of this study or interpretation of its results. VA Puget Sound provided support for the participation of Edward J. Boyko and Steven E. Kahn in this research.
Notes
CONFLICTS OF INTEREST: No potential conflict of interest relevant to this article was reported.
AUTHOR CONTRIBUTIONS:
Conception or design: S.O.S., W.Y.F., E.J.B.
Acquisition, analysis, or interpretation of data: S.O.S., Y.C.H., S.E.K., D.L.L., W.Y.F., E.J.B.
Drafting the work or revising: S.O.S., W.Y.F., E.J.B.
Final approval of the manuscript: S.O.S., W.Y.F., E.J.B.


