- Current
- Browse
- Collections
-
For contributors
- For Authors
- Instructions to authors
- Article processing charge
- e-submission
- For Reviewers
- Instructions for reviewers
- How to become a reviewer
- Best reviewers
- For Readers
- Readership
- Subscription
- Permission guidelines
- About
- Editorial policy
Articles
- Page Path
- HOME > Diabetes Metab J > Volume 43(1); 2019 > Article
-
Original ArticleEpidemiology Projection of Diabetes Prevalence in Korean Adults for the Year 2030 Using Risk Factors Identified from National Data
-
Inkyung Baik

-
Diabetes & Metabolism Journal 2019;43(1):90-96.
DOI: https://doi.org/10.4093/dmj.2018.0043
Published online: October 31, 2018
Department of Foods and Nutrition, College of Science and Technology, Kookmin University, Seoul, Korea.
- Corresponding author: Inkyung Baik. Department of Foods and Nutrition, College of Science and Technology, Kookmin University, 77 Jeongnung-ro, Seongbuk-gu, Seoul 02707, Korea. ibaik@kookmin.ac.kr
Copyright © 2018 Korean Diabetes Association
This is an Open Access article distributed under the terms of the Creative Commons Attribution Non-Commercial License (http://creativecommons.org/licenses/by-nc/4.0/) which permits unrestricted non-commercial use, distribution, and reproduction in any medium, provided the original work is properly cited.
ABSTRACT
-
Background
- A number of studies have reported future prevalence estimates for diabetes mellitus (DM), but these studies have been limited for the Korean population. The present study aimed to construct a forecasting model that includes risk factors for type 2 DM using individual- and national-level data for Korean adults to produce prevalence estimates for the year 2030.
-
Methods
- Time series data from the Korea National Health and Nutrition Examination Survey and national statistics from 2005 to 2013 were used. The study subjects were 13,908 male and 18,697 female adults aged 30 years or older who were free of liver cirrhosis. Stepwise logistic regression analysis was used to select significant factors associated with DM prevalence.
-
Results
- The results showed that survey year, age, sex, marital, educational, or occupational status, the presence of obesity or hypertension, smoking status, alcohol consumption, sleep duration, psychological distress or depression, and fertility rate significantly contributed to the 8-year trend in DM prevalence (P<0.05). Based on sex-specific forecasting models that included the above factors, DM prevalence for the year 2030 was predicted to be 29.2% (95% confidence interval [CI], 27.6% to 30.8%) in men and 19.7% (95% CI, 18.2% to 21.2%) in women.
-
Conclusion
- The present study projected a two-fold increase in the prevalence of DM in 2030 compared with that for the years 2013 and 2014 in Korean adults. Modifiable factors contributing to this increase in DM prevalence, such as obesity, smoking, and psychological factors, may require attention in order to reduce national and individual costs associated with DM.
- In 2014, the global prevalence of diabetes mellitus (DM) was estimated to be 8.5% or 422 million adults with DM. Almost one-fourth of those affected are South-East Asian [1]. On the basis of data from the Korea National Health and Nutrition Examination Survey (KNHANES) for Korean adults aged 30 years or older, the age-adjusted prevalence of DM remained steady at approximately 10% from 2005 to 2012. However, there has been a noticeable increase since then, especially in adults aged 65 years or older [2]. According to Statistics Korea, the proportion of the population aged 65 years or older is projected to be about 24% in 2030, twice as high as that in 2015 [3]. Thus, it is expected that the prevalence of DM will increase with the increasing size of the elderly population in Korea, as predicted in other countries.
- A number of studies have projected the future prevalence of DM in populations around the world [456789101112]. For example, the International Diabetes Federation Diabetes (IDF) estimated that 552 million adults aged 20 to 79 years in 110 countries, including 4.3 million Koreans, would have diabetes in 2030 [4]. Country-specific estimates are also available for Germany [5], Iran [6], Sweden [7], Turkey [8], the UK [9], and the USA [101112]. However, there are discrepancies in the projected estimates of DM prevalence between some studies because of the different approaches used to obtain these estimates. For example, Boyle et al. [12] used national-level data on DM prevalence, DM incidence, mortality, and migration to construct a forecasting model and suggested that about 20% of United States adults would have DM in 2030. However, Whiting et al. [4] used only prevalence data with respect to the aging population, urbanization, and population size and projected a DM rate of 12% for United States adults in the same year. Most studies that have attempted forecasting the future prevalence of disease used national-level data [456789101112131415]. However, Finkelstein et al. [16] used both individual-level data on age, gender, ethnicity, educational level, and marital or economic status and national-level data on unemployment rates, the price of gas and food, and internet usage in their forecasting model for the future prevalence of obesity. An advantage of this approach is that utilizing information on individual-level factors which contribute to disease rates allows high-risk populations to be identified.
- To the best of my knowledge, projections of future DM prevalence in Korea are limited [4] and no study has yet developed a forecasting model for future DM prevalence using individual-level data.
- The present study thus aimed to identify individual- and national-level factors that contribute to trends in DM prevalence in Korean adults and to forecast DM prevalence for the year 2030 using these factors.
INTRODUCTION
- Study population
- In this study, time series data from the KNHANES and national statistics from 2005 to 2012 were used to identify factors contributing to the trends in DM prevalence and to construct a forecasting model. The study population consisted of 32,605 adults (13,908 men and 18,697 women) aged 30 years or older who were included in KNHANES cycles III, VI, and V, which correspond to 2005, 2007 to 2009, and 2010 to 2012, respectively. In addition, data from the same sources for the year 2013 (4,148 adults; 1,777 men and 2,371 women) were used to validate the forecasting model. National statistical data were obtained from the Korean Statistical Information Service website (http://kosis.kr). The study protocol was approved by the Human Subjects Review Committee of Kookmin University (KMU-201512-HR-094).
- Definition of DM
- The outcome variable of this study was DM prevalence. This study adopted the definition of DM used in the KNHANES report; fasting blood glucose levels ≥126 mg/dL or the use of insulin or oral glucose-lowering medication [2].
- Factors contributing to DM prevalence
- Potential factors contributing to DM prevalence were considered to be exposure variables and were selected from the KNHANES and national statistical data: age, gender, educational level, marital or occupational status, household income, body mass index, smoking status, alcohol consumption status, sleep duration, and psychological stress or depression. Dietary factors and physical activity were not included as exposure variables because these factors were likely to be affected by the diagnosis of DM. National statistical data on fertility rate and the gasoline consumer price index, which are available by region, were also extracted.
- Statistical analysis
- Descriptive statistics for DM prevalence and the target exposure variables were calculated for each KNHANES cycle. P values for the trends between these cycles were obtained using chi-square tests and analysis of variance. In addition, logistic regression analysis was used to identify associations between DM prevalence and the exposure variables. The model was constructed using the equation; , where ‘O’ is DM prevalence, ‘i’ is an individual, ‘j’ is region, ‘t’ is the cycle year, ‘X’ denotes the exposure variables for an individual subject, ‘Z’ represents exposure variables from national statistical data, ‘T’ is the yearly ranking, and ‘∫( )’ is the logit probability function. In this analysis, a sampling weight was given to the KNHANES dataset. To identify factors contributing to DM prevalence, significant exposure variables were identified using a stepwise selection method with a significance level of P<0.05. Odds ratios and its 95% confidence interval (CI) were obtained and coefficient estimates were used to construct the forecasting model. To predict DM prevalence in 2013 and 2030, data from these years from the population projection report [17], which was compiled based on the 2010 Population and Housing Census, were used in conjunction with individual-level data from the 2010 KNHANES. A linear regression model and an autoregressive integrated moving average model were used to predict fertility rate and the gasoline consumer price index for the years 2013 and 2030. Projected estimates for DM prevalence with a 95% CI were calculated. All statistical analyses were performed using SAS 9.1.3 software (2008; SAS Institute, Cary, NC, USA), and the statistical significance level for the two-tailed tests was set at 0.05.
METHODS
- Table 1 summarizes the descriptive statistics for DM prevalence and the exposure variables for the three KNHANES cycles. DM prevalence increased over the 8 years of data (P<0.001). The proportion of non-office workers, individuals with low household income, smokers, and those who admitted to experiencing stress or depression decreased, whereas the proportion of those with hypertension and the proportion of alcohol drinkers increased (P<0.001 or P<0.01). Based on the national statistical data, the fertility rate and the gasoline consumer price index increased (P<0.001).
- Results of the stepwise regression analysis are presented in Table 2 showing the factors that were significantly associated with DM prevalence over the period. Survey year, age, being male, being married, being unemployed, having a lower educational status, obesity, hypertension, being a former or heavy smoker, sleep duration, and experiencing stress or depression were all positively associated with DM, whereas alcohol consumption and fertility rate had an inverse relation.
- Table 3 presents gender-specific results for significant factors contributing to DM prevalence. For men, age, being married, being unemployed, obesity, hypertension, heavy smoking, sleep duration, experiencing depression, and the gasoline consumer price index were all positively associated with DM prevalence. For women, survey year, age, being a non-office worker, being unemployed, having a lower education status, obesity, hypertension, heavy smoking, and experiencing stress or depression had a positive association, while alcohol consumption and fertility rate had an inverse association.
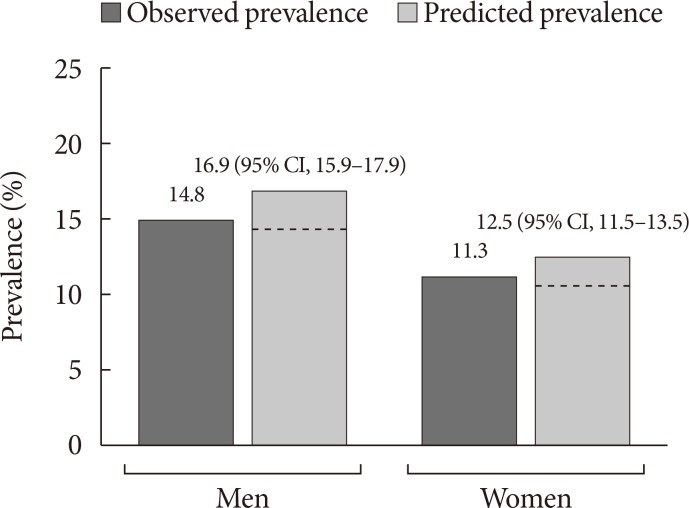
- The projected estimate of DM prevalence for the year 2013 was calculated using the gender-specific models that included the contributing factors presented in Table 3 and then were compared with the DM prevalence observed in the 2013 KNHANES. The projected estimate of DM prevalence for the year 2013 was 14.0% (95% CI, 13.2% to 14.9%) for men and 10.4% (95% CI, 9.5% to 11.2%) for women before considering the 2013 population projection. When considering this population projection, it was 16.9% (95% CI, 15.9% to 17.9%) for men and 12.5% (95% CI, 11.5% to 13.5%) for women. In comparison, the observed DM prevalence was 14.8% and 13.5% (95% CI, 11.7% to 15.4%) for men and 11.3% and 10.2% (95% CI, 8.6% to 11.9%) for women, when unadjusted and adjusted by sampling weight, respectively. Thus, a difference between the unadjusted observed values and the projected estimates was about 2% points for men and about 1% point for women, while that between the adjusted observations and the projected estimates was about 3% points for men and 2% points for women, when considering the 2013 population projection (Fig. 1). When not considering it; however, a difference between the projected and the observed estimates is trivial.
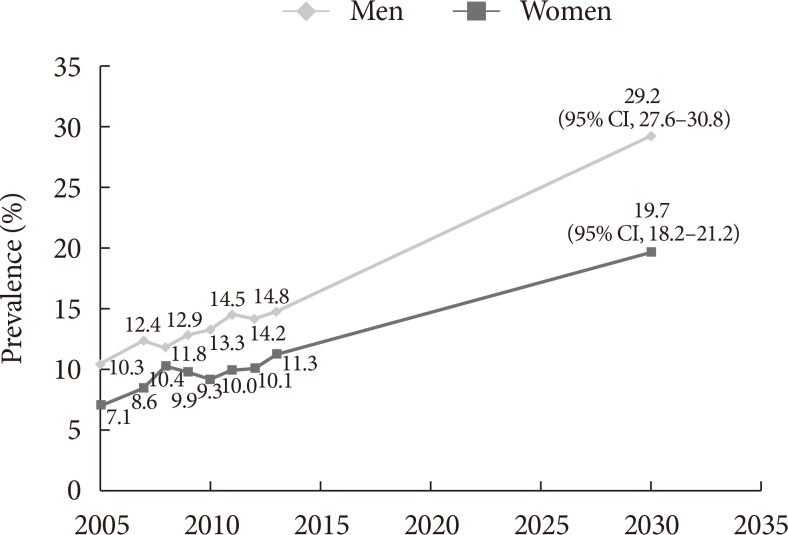
- Fig. 2 shows the projected estimates of DM prevalence in 2030 for men and women. The projected DM prevalence was 29.2% (95% CI, 27.6% to 30.8%) for men and 19.7% (95% CI, 18.2% to 21.2%) for women, when considering the 2030 population projection. When not considering it, the projected estimates were 19.2% (95% CI, 18.1% to 20.2%) for men and 12.4% (95% CI, 11.5% to 13.4%) for women.
RESULTS
- This present study estimated DM prevalence for the year 2030 using a forecasting model comprising individual- and national-level factors associated with DM prevalence over an eight-year period. Significant individual-level factors included survey year, age, gender, marital or occupational status, educational level, the presence of obesity and hypertension, smoking status, alcohol consumption, sleep duration, and psychological condition. Fertility rate and the consumer price index for gasoline were also significant national-level factors. Using a gender-specific forecasting model that included these factors, the DM prevalence for the year 2030 was estimated to be approximately 29% and 20% in men and women, respectively, aged 30 years or older. These estimates were approximately two times higher than the gender-specific prevalence of DM observed in 2013 and 2014.
- According to a report by the IDF, DM prevalence in 2030 was projected to be 11%, which corresponds to about 4 million Korean adults aged between 20 and 79 years [4]. To compare the IDF's projection, DM prevalence for the year 2030 in the study population with the same age range has been calculated to be 19% (data available upon request). In addition, the Korean Diabetes Association (KDA) reported approximately 14% as DM prevalence in 2013 and 2014 among Korean adults aged 30 years or older [18]. Although there is a difference in the age ranges used for the estimates in the IDF and the KDA reports, it appears that the number of Korean adults with DM has already reached 4 million [18]. Similarly, the projected estimate of DM prevalence for the year 2030 in United States adults was 12% in the IDF report [4] and over 20% in other reports [1112]. The lower projection for DM prevalence in the IDF report may be partly due to a lack of consideration of factors contributing to DM prevalence [4]. To the best of my knowledge, no projections of future DM prevalence in Koreans have yet been reported. Disease projections are useful in planning health care programs, allocating resources, and establishing health-related policies. A number of studies have attempted to estimate disease prevalence using different methodologies [45678910111213141516]. One of these studies constructed a forecasting model that included individual-level factors for the estimation of obesity prevalence in 2030 [16].
- The present study used data from 32,605 Korean adults who participated in the KNHANES over a period of 8 years to construct a forecasting model based on individual- and national-level factors. According to the results, the forecasting model overestimated DM prevalence in 2013 when compared with observed DM prevalence. The overestimation is partly due to the use of data from a report on population projections [17]. If these data were not used, the estimated DM prevalence for the year 2030 would be 19% for men and 12% for women. Nonetheless, it is reasonable to use the population projection data for the year 2030 because it is expected that the size of the elderly population, among whom DM prevalence is higher than other age groups, will be larger in the future. Actually, it has been projected for the year 2030 that the number of men and women aged 60 to 69 years older is almost twice as many as that of adults with the same ages in 2013. On the basis of the 2016 report of KNHANES, however, the DM prevalence is 26% and 18% in men and women aged 60 to 69 years, respectively. This sex-specific difference may be partly due to the sex-specific effects of abdominal fat distribution on insulin resistance [19].
- In the present study, factors associated with DM prevalence over the 8-year period were identified. However, there are limits to the causal inference that can be made from this because of the cross-sectional design of the KNHANES. In previous studies, factors such as obesity [20], smoking [21], sleep duration [22], and psychological conditions [2324] have been reported to have a causal association with type 2 diabetes mellitus (T2DM). In addition, moderate alcohol consumption, which was common among women, may be associated with a lower risk of T2DM [25]. Sociodemographic factors may simply reflect the characteristics of high-risk populations rather than having a direct effect on DM. National data such as gasoline consumer price index and a fertility rate need to be interpreted to show a trend over a period, but they should not be interpreted as risk factors at the individual level.
- The present study has some limitations but also makes some important contributions. Diet and physical activity were not considered in the analysis because it was assumed that these lifestyle factors are likely to be affected by a diagnosis of DM, even during the pre-diabetes stage. However, the study considered a wide range of exposure variables including individual- and national-level factors. It also provides data regarding the projection of DM prevalence for the year 2030, which have not been reported before.
- In summary, the present study projected that 29% and 20% of Korean males and females, respectively, would have DM in 2030, based on the KNHANES dataset and the population projection data. Future studies need to confirm these findings and to develop additional methodologies for the projection of future disease prevalence rates.
DISCUSSION
-
Acknowledgements
- This work was supported by National Research Foundation of Korea Grant funded by the Korean Government (NRF-2017-R1A2A2A05001380). The funders have no role in the study.
ACKNOWLEDGMENTS
-
CONFLICTS OF INTEREST: No potential conflict of interest relevant to this article was reported.
NOTES
- 1. World Health Organization. Global report on diabetes. Geneva: World Health Organization; 2016.
- 2. Ministry of Health and Welfare, Korea Centers for Disease Control and Prevention. Korea health statistics 2015: Korea National Health and Nutrition Examination Survey (KNHANES VI-3). Sejong: Korea Centers for Disease Control and Prevention; 2016.
- 3. National Statistics Office. Population projections for Korea: 2015-2065. Seoul: Government of Korea; 2016.
- 4. Whiting DR, Guariguata L, Weil C, Shaw J. IDF diabetes atlas: global estimates of the prevalence of diabetes for 2011 and 2030. Diabetes Res Clin Pract 2011;94:311-321. ArticlePubMed
- 5. Brinks R, Tamayo T, Kowall B, Rathmann W. Prevalence of type 2 diabetes in Germany in 2040: estimates from an epidemiological model. Eur J Epidemiol 2012;27:791-797. ArticlePubMedPDF
- 6. Javanbakht M, Mashayekhi A, Baradaran HR, Haghdoost A, Afshin A. Projection of diabetes population size and associated economic burden through 2030 in Iran: evidence from micro-simulation Markov model and Bayesian meta-analysis. PLoS One 2015;10:e0132505. ArticlePubMedPMC
- 7. Andersson T, Ahlbom A, Carlsson S. Diabetes prevalence in Sweden at present and projections for year 2050. PLoS One 2015;10:e0143084. ArticlePubMedPMC
- 8. Sozmen K, Unal B, Capewell S, Critchley J, O'Flaherty M. Estimating diabetes prevalence in Turkey in 2025 with and without possible interventions to reduce obesity and smoking prevalence, using a modelling approach. Int J Public Health 2015;60(Suppl 1):S13-S21. PubMed
- 9. Holman N, Forouhi NG, Goyder E, Wild SH. The Association of Public Health Observatories (APHO) diabetes prevalence model: estimates of total diabetes prevalence for England, 2010-2030. Diabet Med 2011;28:575-582. ArticlePubMed
- 10. Honeycutt AA, Boyle JP, Broglio KR, Thompson TJ, Hoerger TJ, Geiss LS, Narayan KM. A dynamic Markov model for forecasting diabetes prevalence in the United States through 2050. Health Care Manag Sci 2003;6:155-164. PubMed
- 11. Gregg EW, Boyle JP, Thompson TJ, Barker LE, Albright AL, Williamson DF. Modeling the impact of prevention policies on future diabetes prevalence in the United States: 2010-2030. Popul Health Metr 2013;11:18ArticlePubMedPMCPDF
- 12. Boyle JP, Thompson TJ, Gregg EW, Barker LE, Williamson DF. Projection of the year 2050 burden of diabetes in the US adult population: dynamic modeling of incidence, mortality, and prediabetes prevalence. Popul Health Metr 2010;8:29ArticlePubMedPMCPDF
- 13. Wang Y, Beydoun MA, Liang L, Caballero B, Kumanyika SK. Will all Americans become overweight or obese? Estimating the progression and cost of the US obesity epidemic. Obesity (Silver Spring) 2008;16:2323-2330. ArticlePubMedPDF
- 14. Maddams J, Utley M, Moller H. Projections of cancer prevalence in the United Kingdom, 2010-2040. Br J Cancer 2012;107:1195-1202. ArticlePubMedPMCPDF
- 15. Brookmeyer R, Abdalla N, Kawas CH, Corrada MM. Forecasting the prevalence of preclinical and clinical Alzheimer's disease in the United States. Alzheimers Dement 2018;14:121-129. ArticlePubMedPDF
- 16. Finkelstein EA, Khavjou OA, Thompson H, Trogdon JG, Pan L, Sherry B, Dietz W. Obesity and severe obesity forecasts through 2030. Am J Prev Med 2012;42:563-570. ArticlePubMed
- 17. National Statistics Office. Population projections for Korea: 2010-2060. Seoul: Government of Korea; 2011.
- 18. Korean Diabetes Association. Diabetes fact sheet in Korea 2016. Seoul: Korean Diabetes Association; 2016.
- 19. Koska J, Stefan N, Votruba SB, Smith SR, Krakoff J, Bunt JC. Distribution of subcutaneous fat predicts insulin action in obesity in sex-specific manner. Obesity (Silver Spring) 2008;16:2003-2009. ArticlePubMedPMCPDF
- 20. Asia Pacific Cohort Studies Collaboration. Ni Mhurchu C, Parag V, Nakamura M, Patel A, Rodgers A, Lam TH. Body mass index and risk of diabetes mellitus in the Asia-Pacific region. Asia Pac J Clin Nutr 2006;15:127-133. PubMed
- 21. Willi C, Bodenmann P, Ghali WA, Faris PD, Cornuz J. Active smoking and the risk of type 2 diabetes: a systematic review and meta-analysis. JAMA 2007;298:2654-2664. ArticlePubMed
- 22. Cappuccio FP, D'Elia L, Strazzullo P, Miller MA. Quantity and quality of sleep and incidence of type 2 diabetes: a systematic review and meta-analysis. Diabetes Care 2010;33:414-420. PubMed
- 23. Yu M, Zhang X, Lu F, Fang L. Depression and risk for diabetes: a meta-analysis. Can J Diabetes 2015;39:266-272. ArticlePubMed
- 24. Sui H, Sun N, Zhan L, Lu X, Chen T, Mao X. Association between work-related stress and risk for type 2 diabetes: a systematic review and meta-analysis of prospective cohort studies. PLoS One 2016;11:e0159978. ArticlePubMedPMC
- 25. Koppes LL, Dekker JM, Hendriks HF, Bouter LM, Heine RJ. Moderate alcohol consumption lowers the risk of type 2 diabetes: a meta-analysis of prospective observational studies. Diabetes Care 2005;28:719-725. PubMed
REFERENCES
Comparison between the observed and projected prevalence of diabetes mellitus in adult males and females for the year 2013 when considering the 2013 population projection. The dashed lines indicate the projected prevalence of diabetes mellitus (14.0 % for men and 10.4% for women) before considering the 2013 population projection. CI, confidence interval.

Projected prevalence of diabetes mellitus in adult males and females for the year 2030 when considering the 2030 population projection. CI, confidence interval.
Comparison of outcome and exposure variables for three cycles of the KNHANES and national statistical data
Values are presented as mean±standard deviation unless otherwise indicated.
KNHANES, Korea National Health and Nutritional Examination Survey.
aBased on monthly household income and the number of family members, bDefined as a body mass index ≥25 kg/m2, cDefined as consuming an alcoholic beverage at least once a month over the previous year.
Results of a stepwise logistic regression analysis for the prevalence of diabetes mellitus among 32,605 adults
Results of stepwise logistic regression analysis for the prevalence of diabetes mellitus by gender
Figure & Data
References
Citations
- Angiotensin‐converting enzyme inhibitors versus angiotensin receptor blockers: New‐onset diabetes mellitus stratified by statin use
Juyoung Shin, Hyunah Kim, Hyeon Woo Yim, Ju Han Kim, Suehyun Lee, Hun‐Sung Kim
Journal of Clinical Pharmacy and Therapeutics.2022; 47(1): 97. CrossRef - Sleep duration and mortality in patients with diabetes: Results from the 2007–2015 Korea national health and nutrition examination survey
Kang-Mo Gu, Se Hee Min, Jaeyoung Cho
Diabetes & Metabolism.2022; 48(3): 101312. CrossRef - Advances in the use of electrospinning as a promising technique for obtaining nanofibers to guide epithelial wound healing in diabetics—Mini‐review
Pamela Roberta Alves da Costa, Lívia Rodrigues de Menezes, Marcos Lopes Dias, Emerson Oliveira da Silva
Polymers for Advanced Technologies.2022; 33(4): 1031. CrossRef - GLP-1 receptor agonists in diabetic kidney disease: current evidence and future directions
Ji Hee Yu, So Young Park, Da Young Lee, Nan Hee Kim, Ji A Seo
Kidney Research and Clinical Practice.2022; 41(2): 136. CrossRef - Associations between obesity, metabolic syndrome, and endometrial cancer risk in East Asian women
Boyoung Park
Journal of Gynecologic Oncology.2022;[Epub] CrossRef - Hemoglobin glycation index is associated with incident chronic kidney disease in subjects with impaired glucose metabolism: A 10-year longitudinal cohort study
Wonjin Kim, Taehwa Go, Dae Ryong Kang, Eun Jig Lee, Ji Hye Huh
Journal of Diabetes and its Complications.2021; 35(1): 107760. CrossRef - A Novel User Utility Score for Diabetes Management Using Tailored Mobile Coaching: Secondary Analysis of a Randomized Controlled Trial
Min-Kyung Lee, Da Young Lee, Hong-Yup Ahn, Cheol-Young Park
JMIR mHealth and uHealth.2021; 9(2): e17573. CrossRef - Development of a clinical risk score for incident diabetes: A 10‐year prospective cohort study
Tae Jung Oh, Jae Hoon Moon, Sung Hee Choi, Young Min Cho, Kyong Soo Park, Nam H Cho, Hak Chul Jang
Journal of Diabetes Investigation.2021; 12(4): 610. CrossRef - Antiobesity and Antidiabetic Effects of Portulaca oleracea Powder Intake in High-Fat Diet-Induced Obese C57BL/6 Mice
Jae Hyun Jung, Su Bin Hwang, Hyeon Ju Park, Guang-Ri Jin, Bog Hieu Lee, Rômulo Dias Novaes
Evidence-Based Complementary and Alternative Medicine.2021; 2021: 1. CrossRef - Spironolactone Attenuates Methylglyoxal-induced Cellular Dysfunction in MC3T3-E1 Osteoblastic Cells
So Young Park, Kwang Sik Suh, Woon-Won Jung, Sang Ouk Chin
Journal of Korean Medical Science.2021;[Epub] CrossRef - Smoking as a Target for Prevention of Diabetes
Ye Seul Yang, Tae Seo Sohn
Diabetes & Metabolism Journal.2020; 44(3): 402. CrossRef - Prognosis of Patients with Colorectal Cancer with Diabetes According to Medication Adherence: A Population-Based Cohort Study
Sunho Choe, Joonki Lee, Ji Won Park, Seung-Yong Jeong, Young Min Cho, Byung-Joo Park, Aesun Shin
Cancer Epidemiology, Biomarkers & Prevention.2020; 29(6): 1120. CrossRef - Potential Diagnostic Hemorheological Indexes for Chronic Kidney Disease in Patients With Type 2 Diabetes
Hoyoon Lee, Wonwhi Na, Sang Bae Lee, Chul Woo Ahn, Jun Sung Moon, Kyu Chang Won, Sehyun Shin
Frontiers in Physiology.2019;[Epub] CrossRef - Response: Projection of Diabetes Prevalence in Korean Adults for the Year 2030 Using Risk Factors Identified from National Data (Diabetes Metab J 2019;43:90–6)
Inkyung Baik
Diabetes & Metabolism Journal.2019; 43(2): 244. CrossRef - Letter: Projection of Diabetes Prevalence in Korean Adults for the Year 2030 Using Risk Factors Identified from National Data (Diabetes Metab J 2019;43:90–6)
Bo Kyung Koo
Diabetes & Metabolism Journal.2019; 43(2): 242. CrossRef
 PubReader
 Cite
Cite