
- Current
- Browse
- Collections
-
For contributors
- For Authors
- Instructions to authors
- Article processing charge
- e-submission
- For Reviewers
- Instructions for reviewers
- How to become a reviewer
- Best reviewers
- For Readers
- Readership
- Subscription
- Permission guidelines
- About
- Editorial policy
Articles
- Page Path
- HOME > Diabetes Metab J > Volume 42(5); 2018 > Article
-
Original ArticleObesity and Metabolic Syndrome Comparison of Competitive Models of Metabolic Syndrome Using Structural Equation Modeling: A Confirmatory Factor Analysis
-
Karimollah Hajian-Tilaki

-
Diabetes & Metabolism Journal 2018;42(5):433-441.
DOI: https://doi.org/10.4093/dmj.2018.0010
Published online: October 22, 2018
Department of Biostatistics and Epidemiology, Babol University of Medical Sciences, Babol, Iran.
- Corresponding author: Karimollah Hajian-Tilaki. Department of Biostatistics and Epidemiology, Babol University of Medical Sciences, Ghang Afrouz Avenue, Babol, Iran. drhajian@yahoo.com
Copyright © 2018 Korean Diabetes Association
This is an Open Access article distributed under the terms of the Creative Commons Attribution Non-Commercial License (http://creativecommons.org/licenses/by-nc/4.0/) which permits unrestricted non-commercial use, distribution, and reproduction in any medium, provided the original work is properly cited.
ABSTRACT
-
Background
- The purpose of this study was to apply the structural equation modeling (SEM) to compare the fitness of different competing models (one, two, and three factors) of the metabolic syndrome (MetS) in Iranian adult population.
-
Methods
- Data are given on the cardiometabolic risk factors of 841 individuals with nondiabetic adults from a cross-sectional population-based study of glucose, lipids, and MetS in the north of Iran. The three conceptual hypothesized models (single factor, two correlated factors, and three correlated latent factors) were evaluated by using confirmatory factor analysis with the SEM approach. The summary statistics of correlation coefficients and the model summary fitting indexes were calculated.
-
Results
- The findings show that a single-factor model and a two-correlated factor model had a poorer summary fitting index compared with a three-correlated factor model. All fitting criteria met the conceptual hypothesized three-correlated factor model for both sexes. However, the correlation structure between the three underlying constructs designating the MetS was higher in women than in men.
-
Conclusion
- These results indicate the plausibility of the pathophysiology and etiology of MetS being multifactorial, rather than a single factor, in a nondiabetic Iranian adult population.
- The clustering of four components of risk factors (e.g., obesity, hypertension [HTN], insulin resistance, and hyperlipidemia) is called the metabolic syndrome (MetS) [123]. MetS is a major risk factor for diabetes and cardiovascular disease (CVD), with emerging high prevalence in both industrial and developing countries [45678]. The underlying pathophysiology of MetS is thought to be insulin resistance and obesity, both of which can be linked with other risk factors and are subclinical to CVD [91011]. Because of the clustering of these components in some individuals, a common pathogenesis has been suggested [10]. However, the exploratory factor analysis (EFA) in different populations has yielded inconsistent results [12131415]. A single-factor and two-, three-, four-, and even five-factor models have been reported [1213141516171819]. These inconsistencies of the results may be partially related to the nature and the different methods used in EFA that yield different factors in order to maximize the observed variability of data. Many of these studies used orthogonal rotation factors with varimax methods that would produce interpretable loading coefficients for observed variables, but in the real world, the underlying latent constructs are correlated. Despite the high prevalence of MetS, in the north of Iran [820], the issues of underlying associated latent factors of MetS remain controversial. An understanding of the underlying pathophysiology of MetS plays an important role in public health intervention and preventive measures. Confirmatory factor analysis, the measurement model within the structural equation modeling (SEM), is an alternative method of choice to evaluate the hypothesized conceptual model that characterizes the MetS [212223].
- On the other hand, the SEM is often used to test a conceptual framework model with a graphic presentation of the relation of observed variables as independent variables and latent constructs as dependent variables [21]. This approach allows the measurement model and construct model to be considered simultaneously. While it can estimate the path coefficients of observed variables among latent constructs, the structural constructs used in the hypothesized model are often correlated and thus it takes into account this covariance [21222324]. Therefore, the observed model is a combination of the measurement model and the construct model. An attractive feature of SEM is that takes into account modeling measurement errors and the conceptual hypothesis model can be tested by applying SEM. The process of testing is often confirmatory. An application of SEM is to assess the construct validity, which means to determine the extent to which the observed variables evaluate the latent construct in a conceptual framework model [25]. This approach is a powerful method to use sophisticated data; it is a combination of factor, multiple regression, and path analyses. An example of such sophisticated data are the components of MetS involved with observed variables as indicators of latent constructs where several correlated latent constructs are present. The hypothesized modeling of components of MetS was characterized by previous EFA required to be tested by confirmatory analysis of SEM and to determine which of the competitive models best fit the observed data in different populations. Thus, the objectives of this study were to evaluate and compare the fitness of different competing models (one-, two-, three-, and four-factor models) as characterized in the literature for components of MetS in an adult Iranian population.
INTRODUCTION
- Study subjects and data set
- The source data of this analysis wee extracted from a population-based cross-sectional study that was conducted in the north of Iran, south of the Caspian Sea, in 2012. A representative sample of the adult population aged 20 to 70 years was selected from urban community dwelling individuals by using cluster sampling methods. Full descriptions of sample selection and inclusion criteria are given elsewhere [8]. For the purpose of this analysis, individuals with fasting blood glucose (FBG) levels of >126 mg/dL and/or who received medication for diabetes were excluded; thus, 841 nondiabetic subjects were extracted for this analysis. All subjects had given a written consent before participation in the study, and the study protocol was approved by Ethical Consul of Babol University of Medical Sciences (MUBABOL.HRI.REC.1396.234).
- Measures of observed variables
- The demographic data and anthropometric measures such as weight, height, and waist circumference (WC) were measured according to the standard method. The body mass index (BMI) was calculated as weight in kg divided by height in m2. Systolic blood pressure (SBP) and diastolic blood pressure (DBP) were measured with the patient in the setting position two times on a home visit before and after a 10-minute rest with the use of a digital sphygmomanometer. The average of these two measures is used in the analyses. Mean arterial pressure (MAP) was calculated with the equation: MAP=DBP+⅓ (SBP-DBP). The 10- to 12-hour overnight fasting blood samples were taken from invited individuals at the central laboratory of Ayatollah Rohani Hospital. Triglycerides (TGs), high density lipoprotein cholesterol (HDL-C), and FBG were measured with use of the enzymatic method. We used the Adult Treatment Panel III (ATP III) report of the National Cholesterol Education Program (NCEP) criteria to define MetS [3]. According to these criteria, the presence of at least three of the following five criteria indicate the presence of the MetS: abdominal obesity as measured by WC (>102 cm in men and >88 cm in women), TG >150 mg/dL, HDL-C (<40 mg/dL in men and <50 mg/dL in women), SBP/DBP >130/85 mm Hg, and FBG >110 mg/dL. However, in our confirmatory factor analysis, the continuous measurements of these components plus BMI were applied.
- Factor structure of conceptual hypothesized models
- Model 1A was designated a single-factor model with reduced dimension of observed data as WC, MAP, TG:HDL-C, and FBG. Model 1B was also a single-factor structural model that included the observed variables as BMI, WC, SBP, DBP, TG, HDL-C, and FBG. Model 2 was characterized as a two-correlated factor model from Hanley et al. [12] in which the metabolic factors were TG, HDL-C, FBG, BMI, and WC and the blood pressure (BP) factors were SBP and DBP. Model 3 was the three-correlated factor model characterized by BP factors of SBP and DBP as observed variables; the obesity-related factor included BMI, WC, and lipid/insulin resistance; and the metabolic factors were TG, HDL-C, and FBG.
- Statistical analysis
- In statistical analysis, SPSS software version 18.0 (SPSS Inc., Chicago, IL, USA) and AMOS software version 24.0 (IBM Co., Armonk, NY, USA) were used. All four competing models were applied to data according sex. The fitness of the hypothesized factor structural models was assessed by using principal component analysis with the SEM. The summary statistics of standardized estimates of coefficients and the correlation between the related constructs were provided. The chi-square test of goodness of fit was used to evaluate which hypothesized model best fit the sample data. Because the chi-square test is very sensitive to large sample size and produces highly significant that demonstrated the deviation of hypothesized model from sample data. Thus, the goodness of fit was also evaluated based on other criteria as recommended by Hu and Bentler [26], including goodness of fit index (GFI), adjusted goodness of fit index (AGFI), normed fitting index (NFI), root mean square error of approximation (RMSEA), comparative fitting index (CFI), incremental fitting index (IFI), parsimony goodness of fit index (PGFI), and Akaike information criterion (AIC). These two latter indexes may be more appropriate for comparative models with different number of parameters. The criteria for closed fit were CFI >0.95, AGFI >0.95, NFI >0.95, RMSEA <0.08, CFI >0.95, and IFI >0.95. The PGFI is based on the GFI by adjusting the degree of freedom, but no particular threshold levels have been recommended for this index. AIC is usually used in comparing estimating models, and the smaller value of AIC suggests a parsimonious model but it is not normed on the scale of 0 to 1 [27]. All these confirmatory principal component analyses were performed according to sex to show how factor structure differed between men and women.
METHODS
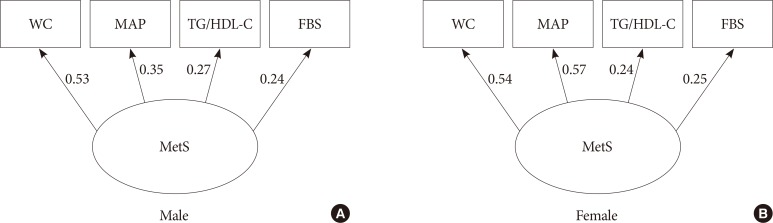
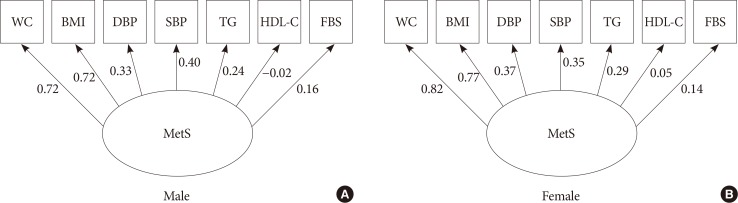
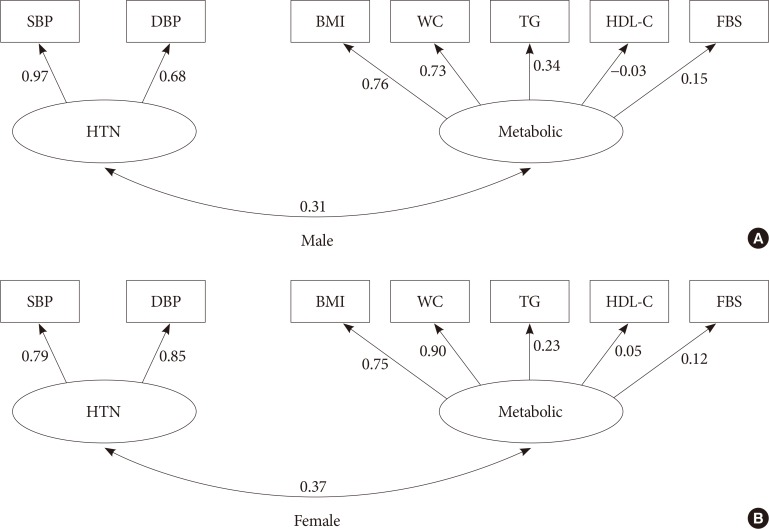
- Study participants had an average age (±standard deviation [SD]) of 41.0±13.2 years, and 55.3% were female. The prevalence of MetS based on ATP III criteria was 35.0% (29.0% in men vs. 39.8% in women, P=0.001). Among the components of MetS, low HDL-C (82.4%), abnormal TG (42.2%), and abnormal WC (39.7%) values were the most common abnormalities in our study population. A significant difference of higher metabolic abnormality was observed in women compared with men (Table 1). Table 2 summarizes the fit statistics of the hypothesized models that were evaluated in this study according to sex. Model 1A is characterized as a single-factor model with reduced dimension of observed variables such that TG and HDL-C were replaced by single-dimension observed data as TG:HDL-C and DBP and SBP by MAP. In model 1B, all observed variables were considered as a single factor without reducing the dimension of data. All fitting indexes met the criterion of goodness of fit in both sexes in model 1A, but the other single-factor model (model 1B) used the original observed data; all fitting indexes were poor, in particular, the high value of RMSEA=0.20 was observed. Model 2 characterized by two correlated latent constructs, BP, and metabolic factors; the summary fitting statistics have improved significantly compared with model 1B. Except for the significant P value of the chi-square test, all fitting indexes met the required criteria in both sexes. However, a lower standardized regression coefficient of HDL-C on the lipid factor was observed. Model 3 (three-factor model) yielded a better improvement of fitting indexes than model 2; in particular, RMERA reached 0.023 in men and the P value of the chi-square test was not significant (i.e., the observed data are progressively fit with the hypothesized model) and a relatively high correlation was apparent between the two constructs of obesity and metabolic factors, but in women, again, all fitting statistics met the criteria except a significant P value of the chi-square test was revealed. The results show that the correlations among three underlying constructs were greater in women than in men, but, surprisingly, a low positive standardized regression coefficient between HDL-C and metabolic factor was observed in women. The standardized loading coefficients and the correlation between underlying constructs in two- and three-factor models are presented in Figs. 1 and 2 according to sex, respectively. Additionally, the standardized loading coefficients of the single-factor model are shown in Figs. 3 and 4. In all figures, one side arrow shows the standardized loading coefficients of observed variables on the latent construct as regression coefficients regardless of the scale used, and two side arrows indicate the correlation structure between different constructs. Additionally, the four-factor model was locally underidentified; the loading estimate for a factor or latent construct with only one indicator as observed variable cannot be mathematically derived because in our data insulin resistance factor had only one observed variable, FBG.
RESULTS
- In this study, SEM and confirmatory factor analysis of a set of cardiometabolic risk variables were used to evaluate the pattern of related factors to MetS. SEM correlates a set of observed variables into a single factor or latent construct involving path analysis using direct and indirect effects. This method allows evaluation of the causal pathway of observed variables in relation to defined constructs and estimation of the correlation between constructs based on conceptual framework. The objectives of SEM in this analysis were to evaluate and compare the conceptual hypothesized competitive models to determine the extent they are supported by our sample data. The latent constructs used in this analysis were obesity, HTN, and metabolic factors including lipid profiles and insulin resistance and, thus, MetS.
- Within a set of defined observed variables, we found the fit of a single-factor model (model 1B) was not plausible, but the two-correlated factor model was plausible and the all fitting indexes were improved compared with the single-factor model. However, further improvement, in particular, RMSEA, was achieved significantly by fitting a three-factor oblique model rather than a two-factor oblique model. In particular, in men, all fitting indexes met the required fitting criteria, but in women, the RMSEA reached 0.08, which also is acceptable, and the all summary fitting index chi-square yielded a significant P value, perhaps due to a larger sample size. Few published studies evaluated and compared the fit indexes of different competitive models of MetS by using SEM approach, but many used only EFA to designate factors associated with MetS. Our findings are in accordance with those reported by Shah et al. [23] in a nondiabetic United States population with rather similar summary fitting indexes. Similar to our results, a single-factor model was not fit with the observed data, but a two-correlated factor model suggested by Hanley et al. [12] fit the observed data well. The four-factor model, as suggested by previous EFA, might be more plausible as shown by Shah et al. [23]. The fitting criteria were improved, but our observed data for insulin resistance were sparse and we had only one observed variable as measured by FBG as an indicator of insulin resistance and thus the SEM were unidentifiable.
- In our analysis, when the dimension of observed data was reduced from seven to five by replacing TG and HDL-C with TG:HDL-C and MAP with SBP and DBP, as well as using WC as a single measure of obesity/abdominal obesity instead of BMI and WC, the single-factor model (model 1A) produced relatively fair fitting indexes. Except for NFI, the summary fitting indexes achieved the required fitting criteria, in particular for men. This shows the plausibility of the single-factor model's underlying pathophysiology of MetS. A similar result has been reported in other populations as well [11192829]. The inconsistencies of the results between single-factor and three-factor models in this analysis may be related to pooling some observed raw measures into a single measure. It seems that by this pooling, not all information for two observed variables may be conveyed to a single observed variable.
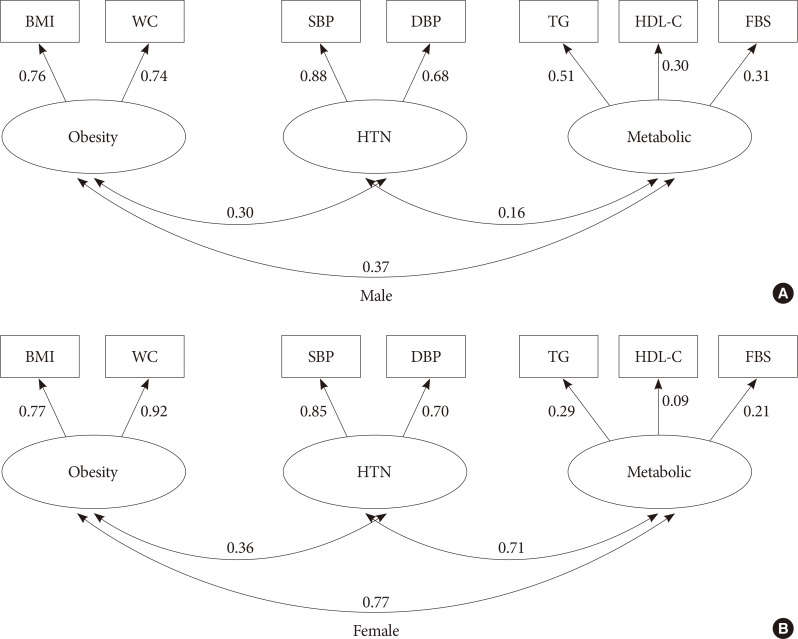
- In our findings of the correlation structures between different constructs of a three-factor model designated by sex, a higher positive correlation between the three underlying constructs was observed in women. The correlation between obesity and metabolic factors in women was 0.77 but it was 0.37 in men. This might be explained by the emerging high prevalence of obesity and abdominal obesity and, thus, MetS in Iranian women compared with in Iranian men in recent decades [72030]. The standardized coefficients of observed variables on related latent constructs were rather similar between sexes, which is similar to those reported by Hanley et al. [12]. In our findings, the apparent low positive correlation of HDL-C on lipid construct was also surprising in women.
- The correlation structures between three underlying factors/constructs were considerable in our SEM analysis, as one expects. The improvement in fitting indexes of three-factor models compared with a single- and two-factor models implies that MetS involves multiple physiologies. The clinical implications of this finding from preventive measures of CVD events is that any interventional program should focus simultaneously on three factors (obesity, HTN, and lipid profiles/glucose). However, our data show that the obesity component has a greater impact on MetS among women but that HTN has a greater impact in men.
- This study has limitations. The casual pathway relationship may not be established with such a cross-sectional design. Also, we measured only the traditional risk factors of CVD. The homeostasis model assessment as an index of insulin sensitivity was not measured. We had only a single observed variable measured by FBG as indicator of insulin resistance and, thus, SEM was undefinable in evaluating a four-factor model. In addition, this analysis was restricted to nondiabetic individuals because of the small sample size of diabetic subjects; the estimates of SEM were undefinable. Thus, one should be cautious to generalize the results. However, this study has several advantages: it is population based with a relative homogeneous ethnic group and study participants had similar diet and physical activity behaviors. This analysis would help in the understanding of the sophisticated interrelation between unobservable constructs. The underlying constructs or latent factors involving MetS cannot be measured directly with single measure; they are a combination of several observed variables. In contrast to the traditional regression analysis, the independent and dependent variables should be observable, and it is assumed that there is no measurement error on independent observed variables, but in clinical practice such a random error is inevitable. On the other hand, the SEM method takes into account such an error in the structure of analysis. Further prospective studies with measurement of nontraditional risk variables such as inflammatory variables is required to establish the causal path relationship of related observed variables to the latent constructs.
- In conclusion, the significant improvement in summary fitting indexes of a three-factor model suggested that multiple physiopathology of MetS is plausible.
DISCUSSION
-
Acknowledgements
- The author would like to acknowledge the deputy of research of Babol University of Medical Sciences for support.
ACKNOWLEDGMENTS
-
CONFLICTS OF INTEREST: No potential conflict of interest relevant to this article was reported.
NOTES
- 1. Grundy SM, Brewer HB Jr, Cleeman JI, Smith SC Jr. American Heart Association. National Heart, Lung, and Blood Institute. Definition of metabolic syndrome: report of the National Heart, Lung, and Blood Institute/American Heart Association conference on scientific issues related to definition. Circulation 2004;109:433-438. ArticlePubMed
- 2. Alberti KG, Zimmet P, Shaw J. IDF Epidemiology Task Force Consensus Group. The metabolic syndrome: a new worldwide definition. Lancet 2005;366:1059-1062. ArticlePubMed
- 3. Expert Panel on Detection, Evaluation, and Treatment of High Blood Cholesterol in Adults. Executive summary of the third report of The National Cholesterol Education Program (NCEP) expert panel on detection, evaluation, and treatment of high blood cholesterol in adults (Adult Treatment Panel III). JAMA 2001;285:2486-2497. ArticlePubMed
- 4. Ford ES. The metabolic syndrome and mortality from cardiovascular disease and all-causes: findings from the National Health and Nutrition Examination Survey II Mortality Study. Atherosclerosis 2004;173:309-314. ArticlePubMed
- 5. Church TS, Thompson AM, Katzmarzyk PT, Sui X, Johannsen N, Earnest CP, Blair SN. Metabolic syndrome and diabetes, alone and in combination, as predictors of cardiovascular disease mortality among men. Diabetes Care 2009;32:1289-1294. ArticlePubMedPMCPDF
- 6. Lakka HM, Laaksonen DE, Lakka TA, Niskanen LK, Kumpusalo E, Tuomilehto J, Salonen JT. The metabolic syndrome and total and cardiovascular disease mortality in middle-aged men. JAMA 2002;288:2709-2716. ArticlePubMed
- 7. Hajian-Tilaki K. Metabolic syndrome and its associated risk factors in Iranian adults: a systematic review. Caspian J Intern Med 2015;6:51-61. PubMedPMC
- 8. Hajian-Tilaki K, Heidari B, Firouzjahi A, Bagherzadeh M, Hajian-Tilaki A, Halalkhor S. Prevalence of metabolic syndrome and the association with socio-demographic characteristics and physical activity in urban population of Iranian adults: a population-based study. Diabetes Metab Syndr 2014;8:170-176. ArticlePubMed
- 9. Revean GM. Role of insulin resistance in human disease. Diabetes 1988;37:1595-1607. ArticlePubMedPDF
- 10. Revean G. Insulin resistance, type 2 diabetes mellitus, and cardiovascular disease: the end of the beginning. Circulation 2005;112:3030-3032. ArticlePubMed
- 11. Chan JC, Tong PC, Critchley JA. The insulin resistance syndrome: mechanisms of clustering of cardiovascular risk. Semin Vasc Med 2002;2:45-57. ArticlePubMed
- 12. Hanley AJ, Karter AJ, Festa A, D'Agostino R Jr, Wagenknecht LE, Savage P, Tracy RP, Saad MF, Haffner S. Insulin Resistance Atherosclerosis Study. Factor analysis of metabolic syndrome using directly measured insulin sensitivity: the insulin resistance atherosclerosis study. Diabetes 2002;51:2642-2647. PubMed
- 13. Choi KM, Lee J, Kim KB, Kim DR, Kim SK, Shin DH, Kim NH, Park IB, Choi DS, Baik SH. South-west Seoul Study. Factor analysis of the metabolic syndrome among elderly Koreans: the South-west Seoul Study. Diabet Med 2003;20:99-104. ArticlePubMed
- 14. Sarraf-Zadegan N, Baghaei AM, Sadeghi M, Amin-Zadeh A. Factor analysis of metabolic syndrome among Iranian male smokers. Iran J Med Sci 2005;30:73-79.
- 15. Ayubi E, Khalili D, Delpisheh A, Hadaegh F, Azizi F. Factor analysis of metabolic syndrome components and predicting type 2 diabetes: results of 10-year follow-up in a Middle Eastern population. J Diabetes 2015;7:830-838. PubMed
- 16. Oh JY, Hong YS, Sung YA, Barrett-Connor E. Prevalence and factor analysis of metabolic syndrome in an urban Korean population. Diabetes Care 2004;27:2027-2032. ArticlePubMedPDF
- 17. Ghosh A. Factor analysis of metabolic syndrome among the middle-aged Bengalee Hindu men of Calcutta, India. Diabetes Metab Res Rev 2005;21:58-64. ArticlePubMed
- 18. Huo D, Wang W, Li X, Gao Q, Wu L, Luo Y, Wang Y, Zhang P, Guo X. Evaluation of two single-factor models of metabolic syndrome: a confirmatory factor analysis for an adult population in Beijing. Lipids Health Dis 2013;12:61ArticlePubMedPMCPDF
- 19. Shen BJ, Todaro JF, Niaura R, McCaffery JM, Zhang J, Spiro A 3rd, Ward KD. Are metabolic risk factors one unified syndrome? Modeling the structure of the metabolic syndrome X. Am J Epidemiol 2003;157:701-711. ArticlePubMed
- 20. Hajian-Tilaki K, Heidari B, Firouzjahi AR. Clustering of cardio metabolic risk factors in Iranian adult population: a growing problem in the north of Iran. Diabetes Metab Syndr 2017;11(Suppl 1):S277-S281. ArticlePubMed
- 21. Amorim LD, Fiaccone RL, Santos CA, Santos TN, Moraes LT, Oliveira NF, Barbosa SO, Santos DN, Santos LM, Matos SM, Barreto ML. Structural equation modeling in epidemiology. Cad Saude Publica 2010;26:2251-2262. ArticlePubMed
- 22. Moon JR, Cho YA, Huh J, Kang IS, Kim DK. Structural equation modeling of the quality of life for patients with Marfan syndrome. Health Qual Life Outcomes 2016;14:83ArticlePubMedPMC
- 23. Shah S, Novak S, Stapleton LM. Evaluation and comparison of models of metabolic syndrome using confirmatory factor analysis. Eur J Epidemiol 2006;21:343-349. ArticlePubMedPDF
- 24. Roman-Urrestarazu A, Hussain-Ali FM, Reka H, Renwick MJ, Roman GD, Mossialos E. Structural equation model for estimation risk factors in type 2 diabetes mellitus in Middle Eastern setting: evidence from the STEPS Qatar. BMJ Open Diabetes Res Care 2016;4:e000231.PubMedPMC
- 25. Lu W, Song K, Wang Y, Zhang Q, Li W, Jiao H, Wang G, Huang G. Relationship between serum uric acid and metabolic syndrome: an analysis by structural equation modeling. J Clin Lipidol 2012;6:159-167. ArticlePubMed
- 26. Hu LT, Bentler PM. Cutoff criteria for fit indexes in covariance structure analysis: conventional criteria versus new alternatives. Struct Equ Modeling 1999;6:1-55.Article
- 27. Hooper D, Coughlan J, Mullen MR. Structural equation modelling: guidelines for determining model fit. Electron J Bus Res Methods 2008;6:53-60.
- 28. Stevenson JE, Wright BR, Boydstun AS. The metabolic syndrome and coronary artery disease: a structural equation modeling approach suggestive of a common underlying pathophysiology. Metabolism 2012;61:1582-1588. ArticlePubMed
- 29. Motamed N, Zamani F, Rabiee B, Saeedian FS, Maadi M, Akhavan-Niaki H, Asouri M. The best obesity indices to use in a single factor model indicating metabolic syndrome: a population based study. Arch Iran Med 2016;19:110-115. PubMed
- 30. Azimi-Nezhad M, Herbeth B, Siest G, Dade S, Ndiaye NC, Esmaily H, Hosseini SJ, Ghayour-Mobarhan M, Visvikis-Siest S. High prevalence of metabolic syndrome in Iran in comparison with France: what are the components that explain this? Metab Syndr Relat Disord 2012;10:181-188. ArticlePubMed
REFERENCES
The standardized coefficients between components of metabolic syndrome (MetS) in a single-factor model for males (A) and females (B) (model 1A). WC, waist circumference; MAP, mean arterial pressure; TG, triglyceride; HDL-C, high density lipoprotein cholesterol; FBS, fasting blood glucose.
The standardized coefficients between components of metabolic syndrome (MetS) in a single-factor model for males (A) and females (B) (model 1B). WC, waist circumference; BMI, body mass index; DBP, diastolic blood pressure; SBP, systolic blood pressure; TG, triglyceride; HDL-C, high density lipoprotein cholesterol; FBG, fasting blood glucose.
The standardized coefficients between components of metabolic syndrome in two-factor model for males (A) and females (B). SBP, systolic blood pressure; DBP, diastolic blood pressure; HTN, hypertension; BMI, body mass index; WC, waist circumference; TG, triglyceride; HDL-C, high density lipoprotein cholesterol; FBG, fasting blood glucose.
The standardized coefficients between components of metabolic syndrome in three-factor model for males (A) and females (B). BMI, body mass index; WC, waist circumference; SBP, systolic blood pressure; DBP, diastolic blood pressure; HTN, hypertension; TG, triglyceride; HDL-C, high density lipoprotein cholesterol; FBG, fasting blood glucose.
The prevalence of metabolic abnormality in 841 nondiabetic individuals used in the study models
Model fit summary indexes of competitive models in nondiabetic individuals according to sex

GFI, goodness of fit index; AGFI, adjusted goodness of fit index; NFI, normed fitting index; RMSEA, root mean square error of approximation; CFI, comparative fitting index; IFI, incremental fitting index; PGFI, parsimony goodness of fit index; AIC, Akaike information criterion.
aThe dimension of observed variables was reduced to waist circumference, triglycerides: high-density lipoprotein ratio, mean arterial pressure, and fasting blood glucose.
Figure & Data
References
Citations
- Structural Equation Modelling for Predicting the Relative Contribution of Each Component in the Metabolic Syndrome Status Change
José E. Teixeira, José A. Bragada, João P. Bragada, Joana P. Coelho, Isabel G. Pinto, Luís P. Reis, Paula O. Fernandes, Jorge E. Morais, Pedro M. Magalhães
International Journal of Environmental Research and Public Health.2022; 19(6): 3384. CrossRef - New risk score model for identifying individuals at risk for diabetes in southwest China
Liying Li, Ziqiong Wang, Muxin Zhang, Haiyan Ruan, Linxia Zhou, Xin Wei, Ye Zhu, Jiafu Wei, Sen He
Preventive Medicine Reports.2021; 24: 101618. CrossRef - Definition and early diagnosis of metabolic syndrome in children
Gunter Matthias Christian Flemming, Sarah Bussler, Antje Körner, Wieland Kiess
Journal of Pediatric Endocrinology and Metabolism.2020; 33(7): 821. CrossRef - Calcium-Sensing Receptor in Adipose Tissue: Possible Association with Obesity-Related Elevated Autophagy
Pamela Mattar, Sofía Sanhueza, Gabriela Yuri, Lautaro Briones, Claudio Perez-Leighton, Assaf Rudich, Sergio Lavandero, Mariana Cifuentes
International Journal of Molecular Sciences.2020; 21(20): 7617. CrossRef
 PubReader
 Cite
Cite


