
 KDA
KDA
- Current
- Browse
- Collections
-
For contributors
- For Authors
- Instructions to authors
- Article processing charge
- e-submission
- For Reviewers
- Instructions for reviewers
- How to become a reviewer
- Best reviewers
- For Readers
- Readership
- Subscription
- Permission guidelines
- About
- Editorial policy
Articles
- Page Path
- HOME > Diabetes Metab J > Volume 42(3); 2018 > Article
-
ReviewEpidemiology The Evidence for an Obesity Paradox in Type 2 Diabetes Mellitus
-
Seung Jin Han1, Edward J. Boyko2

-
Diabetes & Metabolism Journal 2018;42(3):179-187.
DOI: https://doi.org/10.4093/dmj.2018.0055
Published online: May 31, 2018
1Department of Endocrinology and Metabolism, Ajou University School of Medicine, Suwon, Korea.
2Seattle Epidemiologic Research and Information Center, VA Puget Sound Health Care System, Seattle, WA, USA.
- Corresponding author: Edward J. Boyko. Seattle Epidemiologic Research and Information Center, VA Puget Sound Health Care System, 1660 S. Columbian Way (S-123-PCC), Seattle, WA 98108, USA. eboyko@uw.edu
Copyright © 2018 Korean Diabetes Association
This is an Open Access article distributed under the terms of the Creative Commons Attribution Non-Commercial License (http://creativecommons.org/licenses/by-nc/4.0/) which permits unrestricted non-commercial use, distribution, and reproduction in any medium, provided the original work is properly cited.

ABSTRACT
- Although overweight/obesity is a major risk factor for the development of type 2 diabetes mellitus, there is increasing evidence that overweight or obese patients with type 2 diabetes mellitus experience lower mortality compared with patients of normal weight. This paradoxical finding, known as the “obesity paradox,” occurs in other chronic diseases, and in type 2 diabetes mellitus is particularly perplexing given that lifestyle intervention with one goal being weight reduction is an important feature of the management of this condition. We summarize in this review the findings from clinical and epidemiologic studies that have investigated the association between overweight and obesity (usually assessed using body mass index [BMI]) and mortality in type 2 diabetes mellitus and discuss potential causes of the obesity paradox. We conclude that most studies show evidence of an obesity paradox, but important conflicting findings still exist. We also evaluate if potential bias might explain the obesity paradox in diabetes, including, for example, the presence of confounding factors, measurement error due to use of BMI as an index of obesity, and reverse causation.
- The global prevalence of overweight and obesity has increased dramatically over the past several decades. The World Health Organization estimated that in 2014 more than 1.9 billion adults worldwide were overweight (39%), defined as a body mass index (BMI) of 25.0 to 29.9 kg/m2, and 600 million adults were obese (13%) (BMI ≥30 kg/m2) [1]. Overweight and obesity are established risk factors for the development of metabolic diseases such as diabetes, hypertension, dyslipidemia, cardiovascular disease, and certain cancers [2]. Nevertheless, the association between overweight/obesity and mortality remains an area of interest, importance, and debate. Some previous research has shown a U- or J-shaped association between BMI and mortality, with higher mortality in underweight or obese subjects [34]. On the contrary, reviews of other research have demonstrated that adults with a higher BMI have lower mortality compared with leaner individuals in population-based samples with various clinical conditions [56]. The lower mortality seen in overweight and obese persons presents a paradox given that greater adiposity is associated with higher risk of multiple chronic conditions associated with a shorter lifespan, and, in particular, type 2 diabetes mellitus.
- Obesity is closely linked with the etiology of type 2 diabetes mellitus. Previous research has shown that the relative risk for overweight (25.0≤BMI≤29.9 kg/m2) adults to develop type 2 diabetes mellitus is 4.6-fold for women and 3.5-fold for men compared with their normal weight (18.5≤BMI≤24.9 kg/m2) same sex peers [7]. A Japanese study demonstrated that an increase in BMI of 1 kg/m2 (corresponding to a body weight gain of 2.4 to 2.9 kg) may increase the risk of diabetes by 25% [8]. In addition, weight reduction achieved through a hypocaloric diet or bariatric surgery increases the probability of remission from type 2 diabetes mellitus [910]. Furthermore, a lifestyle intervention has been shown to prevent the development of type 2 diabetes mellitus in overweight persons at high risk for this outcome, with weight loss being the dominant predictor of reduced diabetes risk [11]. However, as for the association between BMI and longevity, the predominant evidence from longitudinal observational studies implies that overweight or obese individuals with diabetes have lower mortality compared with normal weight individuals [6]. We reviewed the literature for research on the obesity paradox in type 2 diabetes mellitus to determine how consistently this has been observed and to discuss potential causal and non-causal explanations for this phenomenon.
INTRODUCTION
- We identified 17 studies investigating the association between obesity defined by BMI and mortality in diabetes that included more than 1,000 subjects who were followed for more than 4 years (Table 1). Eleven studies showed that being overweight or obesity was associated with lower mortality rate. Four studies reported an inverse relationship between BMI and mortality rate [12131415]. Among men with diabetes from Veterans Affairs medical centers, normal weight subjects had a higher mortality than those with class II obesity (BMI ≥35 kg/m2) [12]. Tseng [13] showed BMI was inversely associated with all cause and cancer or diabetes complication mortality in Taiwanese patients with type 2 diabetes mellitus. Zoppini et al. [16] found that the relationship between body weight and mortality varied by age. In older type 2 diabetes mellitus patients (age ≥65 years), the highest BMI quartile (≥29.9 kg/m2) was associated with lowest all-cause mortality. By contrast, among those <65 years, the highest BMI quartile (≥30.9 kg/m2) had a significantly higher mortality compared to patients in the lowest BMI quartile (≤25.4 kg/m2).
- Four studies showed a U-shaped association between mortality and BMI [17181920]. Mulnier et al. [17] reported those with a BMI 15 to 19 or ≥30 kg/m2 had an increased risk of mortality compared with a BMI 20 to 24 kg/m2 in a cohort of British patients with diabetes but no significant mortality risk difference was seen in those with a BMI 25 to 29 kg/m2 compared to 20 to 24 kg/m2. When Logue et al. [18] retrospectively examined subjects within a year of diagnosis of type 2 diabetes mellitus in Scotland, patients with normal weight (20 to <25 kg/m2) or obese (≥35 kg/m2) exhibited higher mortality compared with the overweight group. The U-shaped association between BMI and mortality was also seen among black and white patients with type 2 diabetes mellitus, with obese patients generally at lowest risk of death compared to both normal weight and overweight patients [19]. In the largest study to date that contained nearly 900,000 participants with previously diagnosed or newly diagnosed diabetes based on fasting glucose measurement, Lee et al. [20] also observed a U-shaped association between BMI and mortality in Korean diabetes patients, with lowest mortality between 25.0 to 30.9 kg/m2 depending on sex and new or previously diagnosed diabetes status. Carnethon et al. [21] reported a 2-fold higher all-cause mortality rate in normal weight subjects with new-onset diabetes compared with overweight or obese adults in an analysis of pooled data from five longitudinal cohort studies. Costanzo et al. [22] also showed that the optimal BMI for survival in a British cohort of patients with type 2 diabetes mellitus followed for a median of 10.6 years was 25.0 to 29.9 kg/m2 compared to normal weight or obese BMI categories.
CLINICAL STUDIES SUPPORTING THE OBESITY PARADOX IN DIABETES
- The majority of published research provides evidence favoring the existence of an obesity paradox in type 2 diabetes mellitus. The authors of a number of studies, though, conclude that their results do not support this finding or can be explained by other factors. Chaturvedi and Fuller [23] examined mortality in a population of persons with diabetes from Europe, East Asia, and Native North Americans, but found no clear association between BMI and mortality risk. Although this study included 2,960 diabetic participants, the analysis was subdivided into three groups based on the population sampled, and different BMI cutpoints were used to define excess adiposity. The reduction in power due to such stratification may have resulted in the null findings regarding the association between BMI and mortality. Church et al. [24] observed a higher mortality risk among diabetic obese men (≥30 kg/m2) that disappeared after adjustment for fitness. Bozorgmanesh et al. [25] report that there is no obesity paradox in their population of 1,322 new-onset diabetic patients after adjustment for waist and hip circumference, but Fig. 2D of Bozorgmanesh et al. [25] showing mortality risk by BMI suggests a nadir in the overweight range, which may not have reached significance due to the relatively smaller sample size of this population. Although Sluik et al. [26] conclude that they observed no associations between BMI and mortality in their cohort of European diabetic participants followed for a median of 9.3 years, the results presented in Table 2 of Sluik et al. [26] show a significantly lower mortality risk in men with BMI 25.0 kg/m2 or greater in models adjusted for waist/height ratio, supporting the existence of the obesity paradox. We conclude that these “negative” studies do not convincingly refute the existence of the obesity paradox in type 2 diabetes mellitus.
- In addition, two studies observed a direct relationship between BMI and mortality in subjects with diabetes. Eeg-Olofsson et al. [27] reported that the relative risk of total mortality for a 5-unit increase in BMI was 27% in a cohort of 13,087 diabetic participants followed for 6 years. But in this population, there was no significant difference in mortality risk comparing overweight (BMI 25.0 to 29.9 kg/m2) to normal weight participants [27]. In the Nurses' Health Study and Health Professionals Follow-up Study, Tobias et al. [28] found that a J-shaped association between BMI and mortality among all type 2 diabetes mellitus patients and among those who had ever smoked and a direct linear relationship among those who had never smoked suggesting that effect modification by smoking status acts in this association. Furthermore, there was no evidence of lower mortality among diabetes patients who were overweight or obese compared to those with normal weight in this study of health professional populations, whose weight and height were assessed shortly before diagnosis, thereby limiting potential bias due to reverse causation [28]. A prospective study of 10,464 individuals with newly diagnosed diabetes in the United Kingdom and approximately three controls per diabetic case showed no evidence of the obesity paradox in never smokers, but did see a lower mortality risk in ever smokers with BMI between 25.0 to 34.9 kg/m2 [29]. Lastly, a large prospective Swedish study examined mortality in diabetic patients compared to controls within BMI strata, but did not compare mortality within the diabetic population only by degree of adiposity [30]. Therefore, the results of this paper do not directly pertain to this overview that has focused on the role of obesity as a predictor of mortality in diabetes only.
CLINICAL STUDIES AGAINST THE OBESITY PARADOX IN DIABETES
- Associations observed in epidemiologic and clinical research may arise due to causation but also for many other reasons. We explore further potential mechanisms that explain the obesity paradox in diabetes by focusing on limitations in study design, the validity of BMI as an indicator of adiposity, and the value of BMI to reflect other important features of body composition.
- Limitations of previous epidemiological studies
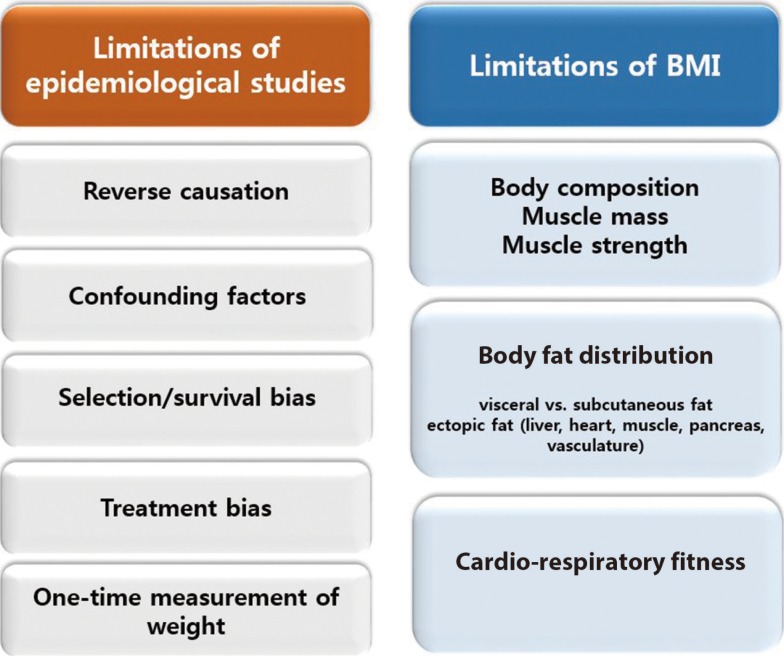
- Discordant findings in observational research can often be attributed to population differences, study design issues, and measures taken to reduce and/or control for bias. Specific issues pertinent to the understanding of the obesity paradox are shown in Fig. 1 and discussed further below.
- Reverse causation refers to the outcome causing a change in the exposure instead of the other way around. If the onset of diabetes resulted in a change in body weight such that more severe disease resulted in weight loss, then this would result in an association between lower body weight/BMI and a higher rate of complications or mortality. Much of the research on the obesity paradox in diabetes measured body composition well beyond the onset of diabetes and therefore may be susceptible to reverse causation bias. A notable exception is the study of two populations of health professionals, which included measurements of body weight and height from before diabetes diagnosis in incident cases [28], finding no evidence of the obesity paradox. To mitigate reverse causation by chronic disease induced weight loss, analyses should consider exclusion of patients with major illnesses (cancer, cardiovascular disease, pulmonary disease) at baseline or who died early during follow-up.
- These are factors that are associated with the exposure (BMI) and the outcome (mortality), such as smoking and occult or preexisting chronic disease that lead to both lower BMI and higher mortality risk [9]. Preston and Stokes noted the absence of the obesity paradox among nonsmoking participants of National Health and Nutrition Examination Survey (NHANES) III and NHANES 1999 to 2004 with dysglycemia (glycosylated hemoglobin ≥5.7%) or prior diagnosis of diabetes, and concluded that higher mortality in normal diabetes participants can be explained by the strong inverse correlation between obesity and smoking [31]. Other factors that attenuated the obesity paradox after adjustment include fitness and waist and hip measurements reflecting body composition [2425].
- Patients who develop type 2 diabetes mellitus in the absence of overweight or obesity may have more severe disease or higher mortality risk or both due to genetic susceptibility or the presence of other risk factors for adverse outcomes and a higher mortality rate independent of body composition [3233]. Thinner diabetes patients in the United Kingdom with BMI <25 kg/m2 were more likely to be treated with insulin than their heavier counterparts [1727]. Insulin use has been associated with higher risk of adverse outcomes in patients with diabetes, such as, for example, hospitalizations, foot ulcer, and mortality [3435], and may therefore reflect greater diabetes severity. Lajous et al. [36] examined the outcomes of incident diabetes and mortality in a cohort of 88,373 French women followed for a mean of 16.7 years, and noted lower mortality associated with an overweight or obese BMI in those with diabetes, but higher mortality with the same BMI elevation in women without diabetes. The authors concluded through an analysis of casual diagrams that the apparent better survival with greater BMI among the diabetic women could be explained by selection of persons with diabetes only for assessment of the effect of obesity on mortality since risk of diabetes is affected by the exposure (obesity). They advised against assessing the effects of adiposity on mortality in persons with a disease (diabetes) for which excess adiposity is a risk factor. Badrick et al. [29], however, noted the obesity paradox among not only diabetic participants who smoked, but also non-diabetic participants, and concluded that the selection factors (bias) do not explain this phenomenon. Greater BMI was associated with better survival among older (≥65 years) patients with diabetes in two studies [1637], suggesting that selective survival may account for the obesity paradox if patients with unhealthy obesity do not survive into old age, while those with a more healthy obesity phenotype do, and comprise a biased comparison group for evaluation of mortality differences with normal weight diabetic patients [38].
- Anti-diabetic medication and behavioral therapy (i.e., diet and physical activity changes) may result in weight loss. We speculate that obese patients may be diagnosed earlier with diabetes resulting in earlier initiation of treatment and potentially few diabetic and cardiovascular complications, leading to improved survival.
- Weight measurement only once at baseline may not reflect a person's weight history. In a recent report that included the Nurses' Health Study I and II and the Health Professionals Follow-Up Study, when BMI was defined using a single baseline measurement, a significant inverse association between overweight and mortality was observed [39]. However, this paradoxical association was reversed in analyses using instead the maximum BMI over 16 years of weight history. Having a history of being overweight or obese was linked to an increase in all-cause mortality risk. Thus, this study implies that maximum BMI reflects weight history better for mortality prediction and its use may reduce reverse causation bias associated with a single BMI assessment.
- Limitations of BMI as an obesity index
- Although BMI is a simple, convenient, and noninvasive surrogate measure of body fat, it is a measure of excess weight per height rather than a direct measure of fat mass. In addition, age, sex, ethnicity, and muscle mass can affect the relationship between BMI and body fat. To our knowledge, there is no demonstration of an “obesity paradox” based on a direct measurement of body fat. Until such demonstration is made, whether the obesity paradox equals the BMI paradox or the adiposity paradox will remain unknown.
- BMI fails to distinguish between fat and muscle mass, so that very muscular persons may have a high BMI and be misclassified as overweight or obese. Because low muscle mass has been independently associated with mortality [40], it is possible that higher mortality in normal weight subjects may associated with low muscle mass and not low adiposity [41]. On the other hand, many obese individuals have not only increased fat mass but also increased muscle mass [4243]. Thus, relatively higher muscle mass may contribute to better survival outcomes in persons classified as obese. In addition, recent research has demonstrated a role for muscle function as well by demonstrating that greater muscle strength predicts lower risk of mortality [444546]. Hamasaki et al. [46] reported that greater handgrip strength was significantly associated with lower mortality in Japanese men with type 2 diabetes mellitus.
- BMI does not capture information on body fat distribution. Previous research suggests that the fat distribution pattern has a greater influence on cardiometabolic risk than BMI [4748]. Whereas visceral adiposity plays an important role in development of obesity-associated metabolic disorders, others have proposed that peripheral fat depots may protect against cardiovascular disease [49]. Visceral fat accumulation is greatest in younger adults, and thus would be expected to increase risk of cardiometabolic conditions for many decades [5051]. Although best assessed using imaging, satisfactory surrogate measures of visceral fat exist such as waist circumference, waist/hip ratio, and waist/height ratio, that are all positively associated with mortality [26]. BMI, however, is not able to capture differences in body fat distribution and therefore may misrepresent some diabetic patients as “normal” when in fact excess visceral adiposity is present. In addition, ectopic fat undetectable by measurement of BMI may occur in multiple other anatomic locations including liver, heart, pancreas, and muscle, and is also linked in these locations to adverse cardiometabolic outcomes [52].
- The Aerobics Center Longitudinal Study showed no significant association between BMI and mortality after adjustment for fitness in males with diabetes, and furthermore observed that fitness predicted mortality independent of BMI [24]. McAuley et al. [53] confirmed these findings in male veterans with type 2 diabetes mellitus. Thus, the level of fitness may affect survival of obese individuals, and potentially may confound research on the association between BMI and mortality in persons with diabetes.
POSSIBLE EXPLANATIONS FOR THE OBESITY PARADOX IN DIABETES
Reverse causation
Confounding factors
Selection/survival bias
Treatment bias
One-time measurement of weight
Body composition/muscle mass/muscle strength
Body fat distribution
Cardiorespiratory fitness
- The obesity paradox in type 2 diabetes mellitus has undergone extensive scrutiny by many investigators of whom many have concluded that high BMI does not cause lower mortality. Some of the theories proposed to explain the obesity paradox as due to bias as opposed to a causal benefit of high BMI on lowering mortality are not universally supported by the data identified in this review. For example, if the obesity paradox is simply the result of bias due to selection (conditioning) of patients with diabetes, why then was it observed in a non-diabetic control population of ever smokers [2936]? Furthermore, why was the obesity paradox not evident in two well conducted studies that selected diabetic participants [2728]? We believe that the obesity paradox most likely represents a non-causal association between higher BMI and mortality in diabetes, but await a comprehensive explanation of the remaining loose ends. We believe that the findings of obesity paradox should not change current clinical advice regarding the importance of weight reduction in patients with type 2 diabetes mellitus who are overweight or obese. We agree with Lajous et al. [54] who conclude that we should not recommend that patients with chronic diseases gain weight. A systematic review of randomized controlled trials of weight loss interventions for adults with obesity concluded that these interventions may reduce premature all-cause mortality in adults with obesity [55]. We believe that the literature also provides good support for recommending weight loss to overweight and obese patients who have type 2 diabetes mellitus. The Look AHEAD Study conducted an intensive lifestyle intervention in 5,145 overweight or obese patients with type 2 diabetes mellitus to assess whether this would reduce cardiovascular morbidity and mortality [56]. The intervention group succeeded in losing 8.6% of body weight by year 1 and 6.0% by the end of the study. Although this randomized controlled trial did not demonstrate a reduction in cardiovascular morbidity or mortality, no increase in either of these outcomes occurred, which might have been expected if excess adiposity conferred a survival benefit consistent with the obesity paradox. This clinical trial therefore has a 2-fold benefit as it argues against the obesity paradox and provides reassurance to clinicians that overweight and obese patients with diabetes may safely attempt to reduce weight.
CONCLUSIONS
-
CONFLICTS OF INTEREST: No potential conflict of interest relevant to this article was reported.
NOTES
- 1. World Health Organization. Obesity and overweight: fact sheet N°311. Geneva: World Health Organization; 2015.
- 2. Mokdad AH, Ford ES, Bowman BA, Dietz WH, Vinicor F, Bales VS, Marks JS. Prevalence of obesity, diabetes, and obesity-related health risk factors, 2001. JAMA 2003;289:76-79. ArticlePubMed
- 3. Troiano RP, Frongillo EA Jr, Sobal J, Levitsky DA. The relationship between body weight and mortality: a quantitative analysis of combined information from existing studies. Int J Obes Relat Metab Disord 1996;20:63-75. PubMed
- 4. Jee SH, Sull JW, Park J, Lee SY, Ohrr H, Guallar E, Samet JM. Body-mass index and mortality in Korean men and women. N Engl J Med 2006;355:779-787. ArticlePubMed
- 5. Lavie CJ, Milani RV, Ventura HO. Obesity and cardiovascular disease: risk factor, paradox, and impact of weight loss. J Am Coll Cardiol 2009;53:1925-1932. PubMed
- 6. Carnethon MR, Rasmussen-Torvik LJ, Palaniappan L. The obesity paradox in diabetes. Curr Cardiol Rep 2014;16:446ArticlePubMedPDF
- 7. Field AE, Coakley EH, Must A, Spadano JL, Laird N, Dietz WH, Rimm E, Colditz GA. Impact of overweight on the risk of developing common chronic diseases during a 10-year period. Arch Intern Med 2001;161:1581-1586. ArticlePubMed
- 8. Nagaya T, Yoshida H, Takahashi H, Kawai M. Increases in body mass index, even within non-obese levels, raise the risk for type 2 diabetes mellitus: a follow-up study in a Japanese population. Diabet Med 2005;22:1107-1111. ArticlePubMed
- 9. Adams KF, Schatzkin A, Harris TB, Kipnis V, Mouw T, Ballard-Barbash R, Hollenbeck A, Leitzmann MF. Overweight, obesity, and mortality in a large prospective cohort of persons 50 to 71 years old. N Engl J Med 2006;355:763-778. ArticlePubMed
- 10. Lean ME, Leslie WS, Barnes AC, Brosnahan N, Thom G, McCombie L, Peters C, Zhyzhneuskaya S, Al-Mrabeh A, Hollingsworth KG, Rodrigues AM, Rehackova L, Adamson AJ, Sniehotta FF, Mathers JC, Ross HM, McIlvenna Y, Stefanetti R, Trenell M, Welsh P, Kean S, Ford I, McConnachie A, Sattar N, Taylor R. Primary care-led weight management for remission of type 2 diabetes (DiRECT): an open-label, cluster-randomised trial. Lancet 2018;391:541-551. ArticlePubMed
- 11. Hamman RF, Wing RR, Edelstein SL, Lachin JM, Bray GA, Delahanty L, Hoskin M, Kriska AM, Mayer-Davis EJ, Pi-Sunyer X, Regensteiner J, Venditti B, Wylie-Rosett J. Effect of weight loss with lifestyle intervention on risk of diabetes. Diabetes Care 2006;29:2102-2107. ArticlePubMedPMCPDF
- 12. Kokkinos P, Myers J, Faselis C, Doumas M, Kheirbek R, Nylen E. BMI-mortality paradox and fitness in African American and Caucasian men with type 2 diabetes. Diabetes Care 2012;35:1021-1027. ArticlePubMedPMCPDF
- 13. Tseng CH. Obesity paradox: differential effects on cancer and noncancer mortality in patients with type 2 diabetes mellitus. Atherosclerosis 2013;226:186-192. ArticlePubMed
- 14. Jackson CL, Yeh HC, Szklo M, Hu FB, Wang NY, Dray-Spira R, Brancati FL. Body-mass index and all-cause mortality in US adults with and without diabetes. J Gen Intern Med 2014;29:25-33. ArticlePubMedPDF
- 15. Thomas G, Khunti K, Curcin V, Molokhia M, Millett C, Majeed A, Paul S. Obesity paradox in people newly diagnosed with type 2 diabetes with and without prior cardiovascular disease. Diabetes Obes Metab 2014;16:317-325. ArticlePubMed
- 16. Zoppini G, Verlato G, Leuzinger C, Zamboni C, Brun E, Bonora E, Muggeo M. Body mass index and the risk of mortality in type II diabetic patients from Verona. Int J Obes Relat Metab Disord 2003;27:281-285. ArticlePubMedPDF
- 17. Mulnier HE, Seaman HE, Raleigh VS, Soedamah-Muthu SS, Colhoun HM, Lawrenson RA. Mortality in people with type 2 diabetes in the UK. Diabet Med 2006;23:516-521. ArticlePubMed
- 18. Logue J, Walker JJ, Leese G, Lindsay R, McKnight J, Morris A, Philip S, Wild S, Sattar N. Scottish Diabetes Research Network Epidemiology Group. Association between BMI measured within a year after diagnosis of type 2 diabetes and mortality. Diabetes Care 2013;36:887-893. ArticlePubMedPMCPDF
- 19. Zhao W, Katzmarzyk PT, Horswell R, Wang Y, Li W, Johnson J, Heymsfield SB, Cefalu WT, Ryan DH, Hu G. Body mass index and the risk of all-cause mortality among patients with type 2 diabetes mellitus. Circulation 2014;130:2143-2151. ArticlePubMedPMC
- 20. Lee EY, Lee YH, Yi SW, Shin SA, Yi JJ. BMI and all-cause mortality in normoglycemia, impaired fasting glucose, newly diagnosed diabetes, and prevalent diabetes: a cohort study. Diabetes Care 2017;40:1026-1033. ArticlePubMedPDF
- 21. Carnethon MR, De Chavez PJ, Biggs ML, Lewis CE, Pankow JS, Bertoni AG, Golden SH, Liu K, Mukamal KJ, Campbell-Jenkins B, Dyer AR. Association of weight status with mortality in adults with incident diabetes. JAMA 2012;308:581-590. ArticlePubMedPMC
- 22. Costanzo P, Cleland JG, Pellicori P, Clark AL, Hepburn D, Kilpatrick ES, Perrone-Filardi P, Zhang J, Atkin SL. The obesity paradox in type 2 diabetes mellitus: relationship of body mass index to prognosis: a cohort study. Ann Intern Med 2015;162:610-618. ArticlePubMed
- 23. Chaturvedi N, Fuller JH. Mortality risk by body weight and weight change in people with NIDDM. The WHO Multinational Study of Vascular Disease in Diabetes. Diabetes Care 1995;18:766-774. ArticlePubMedPDF
- 24. Church TS, Cheng YJ, Earnest CP, Barlow CE, Gibbons LW, Priest EL, Blair SN. Exercise capacity and body composition as predictors of mortality among men with diabetes. Diabetes Care 2004;27:83-88. ArticlePubMedPDF
- 25. Bozorgmanesh M, Arshi B, Sheikholeslami F, Azizi F, Hadaegh F. No obesity paradox-BMI incapable of adequately capturing the relation of obesity with all-cause mortality: an inception diabetes cohort study. Int J Endocrinol 2014;2014:282089. ArticlePubMedPMCPDF
- 26. Sluik D, Boeing H, Montonen J, Pischon T, Kaaks R, Teucher B, Tjonneland A, Halkjaer J, Berentzen TL, Overvad K, Arriola L, Ardanaz E, Bendinelli B, Grioni S, Tumino R, Sacerdote C, Mattiello A, Spijkerman AM, van der A DL, Beulens JW, van der Schouw YT, Nilsson PM, Hedblad B, Rolandsson O, Franks PW, Nothlings U. Associations between general and abdominal adiposity and mortality in individuals with diabetes mellitus. Am J Epidemiol 2011;174:22-34. ArticlePubMed
- 27. Eeg-Olofsson K, Cederholm J, Nilsson PM, Zethelius B, Nunez L, Gudbjornsdottir S, Eliasson B. Risk of cardiovascular disease and mortality in overweight and obese patients with type 2 diabetes: an observational study in 13,087 patients. Diabetologia 2009;52:65-73. ArticlePubMedPDF
- 28. Tobias DK, Pan A, Jackson CL, O'Reilly EJ, Ding EL, Willett WC, Manson JE, Hu FB. Body-mass index and mortality among adults with incident type 2 diabetes. N Engl J Med 2014;370:233-244. ArticlePubMedPMC
- 29. Badrick E, Sperrin M, Buchan IE, Renehan AG. Obesity paradox and mortality in adults with and without incident type 2 diabetes: a matched population-level cohort study. BMJ Open Diabetes Res Care 2017;5:e000369.ArticlePubMedPMC
- 30. Edqvist J, Rawshani A, Adiels M, Bjorck L, Lind M, Svensson AM, Gudbjornsdottir S, Sattar N, Rosengren A. BMI and mortality in patients with new-onset type 2 diabetes: a comparison with age- and sex-matched control subjects from the general population. Diabetes Care 2018;41:485-493. ArticlePubMedPDF
- 31. Preston SH, Stokes A. Obesity paradox: conditioning on disease enhances biases in estimating the mortality risks of obesity. Epidemiology 2014;25:454-461. ArticlePubMedPMC
- 32. Perry JR, Voight BF, Yengo L, Amin N, Dupuis J, Ganser M, Grallert H, Navarro P, Li M, Qi L, Steinthorsdottir V, Scott RA, Almgren P, Arking DE, Aulchenko Y, Balkau B, Benediktsson R, Bergman RN, Boerwinkle E, Bonnycastle L, Burtt NP, Campbell H, Charpentier G, Collins FS, Gieger C, Green T, Hadjadj S, Hattersley AT, Herder C, Hofman A, Johnson AD, Kottgen A, Kraft P, Labrune Y, Langenberg C, Manning AK, Mohlke KL, Morris AP, Oostra B, Pankow J, Petersen AK, Pramstaller PP, Prokopenko I, Rathmann W, Rayner W, Roden M, Rudan I, Rybin D, Scott LJ, Sigurdsson G, Sladek R, Thorleifsson G, Thorsteinsdottir U, Tuomilehto J, Uitterlinden AG, Vivequin S, Weedon MN, Wright AF. MAGIC. DIAGRAM Consortium. GIANT Consortium. Hu FB, Illig T, Kao L, Meigs JB, Wilson JF, Stefansson K, van Duijn C, Altschuler D, Morris AD, Boehnke M, McCarthy MI, Froguel P, Palmer CN, Wareham NJ, Groop L, Frayling TM, Cauchi S. Stratifying type 2 diabetes cases by BMI identifies genetic risk variants in LAMA1 and enrichment for risk variants in lean compared to obese cases. PLoS Genet 2012;8:e1002741. ArticlePubMedPMC
- 33. Carnethon MR. Diabetes mellitus in the absence of obesity: a risky condition. Circulation 2014;130:2131-2132. ArticlePubMed
- 34. Boyko EJ, Ahroni JH, Stensel V, Forsberg RC, Davignon DR, Smith DG. A prospective study of risk factors for diabetic foot ulcer. The Seattle Diabetic Foot Study. Diabetes Care 1999;22:1036-1042. ArticlePubMedPDF
- 35. Young BA, Lin E, Von Korff M, Simon G, Ciechanowski P, Ludman EJ, Everson-Stewart S, Kinder L, Oliver M, Boyko EJ, Katon WJ. Diabetes complications severity index and risk of mortality, hospitalization, and healthcare utilization. Am J Manag Care 2008;14:15-23. PubMedPMC
- 36. Lajous M, Bijon A, Fagherazzi G, Boutron-Ruault MC, Balkau B, Clavel-Chapelon F, Hernan MA. Body mass index, diabetes, and mortality in French women: explaining away a “paradox”. Epidemiology 2014;25:10-14. ArticlePubMedPMC
- 37. Yano Y, Kario K, Ishikawa S, Ojima T, Gotoh T, Kayaba K, Tsutsumi A, Shimada K, Nakamura Y, Kajii E. JMS Cohort Study Group. Associations between diabetes, leanness, and the risk of death in the Japanese general population: the Jichi Medical School Cohort Study. Diabetes Care 2013;36:1186-1192. PubMedPMC
- 38. Hainer V, Aldhoon-Hainerova I. Obesity paradox does exist. Diabetes Care 2013;36(Suppl 2):S276-S281. ArticlePubMedPMCPDF
- 39. Yu E, Ley SH, Manson JE, Willett W, Satija A, Hu FB, Stokes A. Weight history and all-cause and cause-specific mortality in three prospective cohort studies. Ann Intern Med 2017;166:613-620. ArticlePubMedPMC
- 40. Kim JH, Lim S, Choi SH, Kim KM, Yoon JW, Kim KW, Lim JY, Park KS, Jang HC. Sarcopenia: an independent predictor of mortality in community-dwelling older Korean men. J Gerontol A Biol Sci Med Sci 2014;69:1244-1252. ArticlePubMed
- 41. Batsis JA, Mackenzie TA, Emeny RT, Lopez-Jimenez F, Bartels SJ. Low lean mass with and without obesity, and mortality: results from the 1999–2004 National Health and Nutrition Examination Survey. J Gerontol A Biol Sci Med Sci 2017;72:1445-1451. ArticlePubMedPMC
- 42. Kalyani RR, Corriere M, Ferrucci L. Age-related and disease-related muscle loss: the effect of diabetes, obesity, and other diseases. Lancet Diabetes Endocrinol 2014;2:819-829. ArticlePubMedPMC
- 43. Seidell JC, Bjorntorp P, Sjostrom L, Sannerstedt R, Krotkiewski M, Kvist H. Regional distribution of muscle and fat mass in men: new insight into the risk of abdominal obesity using computed tomography. Int J Obes 1989;13:289-303. PubMed
- 44. Rantanen T, Harris T, Leveille SG, Visser M, Foley D, Masaki K, Guralnik JM. Muscle strength and body mass index as long-term predictors of mortality in initially healthy men. J Gerontol A Biol Sci Med Sci 2000;55:M168-M173. ArticlePubMed
- 45. Leong DP, Teo KK, Rangarajan S, Lopez-Jaramillo P, Avezum A Jr, Orlandini A, Seron P, Ahmed SH, Rosengren A, Kelishadi R, Rahman O, Swaminathan S, Iqbal R, Gupta R, Lear SA, Oguz A, Yusoff K, Zatonska K, Chifamba J, Igumbor E, Mohan V, Anjana RM, Gu H, Li W, Yusuf S. Prospective Urban Rural Epidemiology (PURE) Study investigators. Prognostic value of grip strength: findings from the Prospective Urban Rural Epidemiology (PURE) study. Lancet 2015;386:266-273. ArticlePubMed
- 46. Hamasaki H, Kawashima Y, Katsuyama H, Sako A, Goto A, Yanai H. Association of handgrip strength with hospitalization, cardiovascular events, and mortality in Japanese patients with type 2 diabetes. Sci Rep 2017;7:7041. ArticlePubMedPMCPDF
- 47. Neeland IJ, Turer AT, Ayers CR, Berry JD, Rohatgi A, Das SR, Khera A, Vega GL, McGuire DK, Grundy SM, de Lemos JA. Body fat distribution and incident cardiovascular disease in obese adults. J Am Coll Cardiol 2015;65:2150-2151. ArticlePubMedPMC
- 48. Hayashi T, Boyko EJ, McNeely MJ, Leonetti DL, Kahn SE, Fujimoto WY. Visceral adiposity, not abdominal subcutaneous fat area, is associated with an increase in future insulin resistance in Japanese Americans. Diabetes 2008;57:1269-1275. ArticlePubMedPDF
- 49. Kissebah AH, Vydelingum N, Murray R, Evans DJ, Hartz AJ, Kalkhoff RK, Adams PW. Relation of body fat distribution to metabolic complications of obesity. J Clin Endocrinol Metab 1982;54:254-260. ArticlePubMed
- 50. Lee CG, Fujimoto WY, Brunzell JD, Kahn SE, McNeely MJ, Leonetti DL, Boyko EJ. Intra-abdominal fat accumulation is greatest at younger ages in Japanese-American adults. Diabetes Res Clin Pract 2010;89:58-64. ArticlePubMedPMC
- 51. Hairston KG, Scherzinger A, Foy C, Hanley AJ, McCorkle O, Haffner S, Norris JM, Bryer-Ash M, Wagenknecht LE. Five-year change in visceral adipose tissue quantity in a minority cohort: the Insulin Resistance Atherosclerosis Study (IRAS) family study. Diabetes Care 2009;32:1553-1555. ArticlePubMedPMCPDF
- 52. Lim S, Meigs JB. Ectopic fat and cardiometabolic and vascular risk. Int J Cardiol 2013;169:166-176. ArticlePubMed
- 53. McAuley PA, Myers JN, Abella JP, Tan SY, Froelicher VF. Exercise capacity and body mass as predictors of mortality among male veterans with type 2 diabetes. Diabetes Care 2007;30:1539-1543. ArticlePubMedPDF
- 54. Lajous M, Banack HR, Kaufman JS, Hernan MA. Should patients with chronic disease be told to gain weight? The obesity paradox and selection bias. Am J Med 2015;128:334-336. ArticlePubMed
- 55. Ma C, Avenell A, Bolland M, Hudson J, Stewart F, Robertson C, Sharma P, Fraser C, MacLennan G. Effects of weight loss interventions for adults who are obese on mortality, cardiovascular disease, and cancer: systematic review and meta-analysis. BMJ 2017;359:j4849. ArticlePubMedPMC
- 56. Look AHEAD, Wing RR, Bolin P, Brancati FL, Bray GA, Clark JM, Coday M, Crow RS, Curtis JM, Egan CM, Espeland MA, Evans M, Foreyt JP, Ghazarian S, Gregg EW, Harrison B, Hazuda HP, Hill JO, Horton ES, Hubbard VS, Jakicic JM, Jeffery RW, Johnson KC, Kahn SE, Kitabchi AE, Knowler WC, Lewis CE, Maschak-Carey BJ, Montez MG, Murillo A, Nathan DM, Patricio J, Peters A, Pi-Sunyer X, Pownall H, Reboussin D, Regensteiner JG, Rickman AD, Ryan DH, Safford M, Wadden TA, Wagenknecht LE, West DS, Williamson DF, Yanovski SZ. Cardiovascular effects of intensive lifestyle intervention in type 2 diabetes. N Engl J Med 2013;369:145-154. ArticlePubMedPMC
REFERENCES

Clinical studies about the association of BMI with mortality in diabetes (>1,000 subjects & follow-up >4 years)
| Study | Study type | Population/location | No. of study size | Endpoint | Follow-up, yr | BMI with best outcome, kg/m2 | Findings |
|---|---|---|---|---|---|---|---|
| Kokkinos et al. (2012) [12] | Prospective | United States, men | 4,156 | Total mortality | 7.5 | ≥25 | Inverse association |
| Tseng (2013) [13] | Prospective | Taiwan | 89,056 | Total mortality, cancer or non-cancer mortality | 12 | 25–29.9 | Inverse association |
| Jackson et al. (2014) [14] | Prospective | United States | 2,035 | Total mortality | 9 | 31.03–54.92 | Inverse association |
| Thomas et al. (2014) [15] | Retrospective | United Kingdom | 47,509 | Total mortality | 5 | ≥30 | Inverse association |
| Zoppini et al. (2003) [16] | Retrospective | Italy | 3,398 | Total mortality, CV mortality, cancer mortality | 10 | Old age ≥29.9, Young age <30.9 | Age ≥65 years, inverse association; age <65 years, direct association |
| Mulnier et al. (2006) [17] | Case-control | United Kingdom | 28,725 | Total mortality | 7 | 25–29 | U-shaped association |
| Logue et al. (2013) [18] | Retrospective | United Kingdom | 106,640 | Total mortality, CV mortality | 5 | 25–30 | U-shaped association |
| Zhao et al. (2014) [19] | Prospective | United States | 34,832 | Total mortality | 8.7 | 30–34.9 | U-shaped association |
| Lee et al. (2017) [20] | Prospective | Korea | 905,877 | Total mortality | 10.5 | New diagnosed DM 25–29.4, prevalent DM 26.5–29.4 | U-shaped association |
| Carnethon et al. (2012) [21] | Patient data meta-analysis | United States | 2,625 | Total mortality, CV or non-CV mortality | 27,125 PY | ≥25 | NW associated with higher mortality than OW or OB |
| Costanzo et al. (2015) [22] | Prospective | United Kingdom | 10,568 | Total mortality | 10.6 | 25–29.9 | OW associated with lower mortality risk, but OB was not |
| Chaturvedi et al. (1995) [23] | Prospective | Europeans, East Asians, Native Americans | 2,960 | Total mortality | 13 | No association | |
| Church et al. (2004) [24] | Prospective | United States | 2,196 | Total mortality | 14.6 | No association | |
| Sluik et al. (2011) [26] | Prospective | Europe | 5,435 | Total mortality, CV mortality | 9.3 | No association | |
| Bozorgmanesh et al. (2014) [25] | Prospective | Iran | 1,322 | Total mortality | 9.1 | No association | |
| Eeg-Olofsson et al. (2009) [27] | Prospective | Sweden | 13,087 | Total mortality | 5.6 | <30 | Direct association |
| Tobias et al. (2014) [28] | Prospective | United States | 11,427 | Total mortality, CV mortality | 15.8 | 22.5–24.9 | Direct association (never smoked) |
| Badrick et al. (2017) [29] | Prospective | United Kingdom | 10,464 | Total mortality | 8.7 | 22.5–24.9 | Increased mortality risk from BMI >25 kg/m2 (never smoked) |
Figure & Data
References
Citations

- Association between the weight-adjusted waist index and the odds of type 2 diabetes mellitus in United States adults: a cross-sectional study
Dongdong Zheng, Suzhen Zhao, Dan Luo, Feng Lu, Zhishen Ruan, Xiaokang Dong, Wenjing Chen
Frontiers in Endocrinology.2024;[Epub] CrossRef - Racial and ethnic disparities in primary prevention of cardiovascular disease
Mohammad R. Ali, Hadjer Nacer, Claire A. Lawson, Kamlesh Khunti
Canadian Journal of Cardiology.2024;[Epub] CrossRef - Independent and interactive associations of heart rate and obesity with type 2 diabetes mellites: A population‐based study
Tianxin Zhu, Qingyu Chen, Hongxing Chen, Lili You, Dan Liu, Xiaoyun Zhang, Feng Li, Hongshi Wu, Juying Tang, Diaozhu Lin, Kan Sun, Li Yan, Meng Ren
Journal of Diabetes.2024;[Epub] CrossRef - Two‐sided roles of adipose tissue: Rethinking the obesity paradox in various human diseases from a new perspective
Jing Pan, Jianqiong Yin, Lu Gan, Jianxin Xue
Obesity Reviews.2023;[Epub] CrossRef - Lean or diabetic subtypes predict increased all-cause and disease-specific mortality in metabolic-associated fatty liver disease
Goh Eun Chung, Su Jong Yu, Jeong-Ju Yoo, Yuri Cho, Kyu-na Lee, Dong Wook Shin, Donghee Kim, Yoon Jun Kim, Jung-Hwan Yoon, Kyungdo Han, Eun Ju Cho
BMC Medicine.2023;[Epub] CrossRef - Dynamic changes in prevalence of type 2 diabetes along with associated factors in Bangladesh: Evidence from two national cross-sectional surveys (BDHS 2011 and BDHS 2017–18)
Sabiha Shirin Sara, Ashis Talukder, Ka Yiu Lee, Nayan Basak, Shaharior Rahman Razu, Iqramul Haq, Chuton Deb Nath
Diabetes & Metabolic Syndrome: Clinical Research & Reviews.2023; 17(2): 102706. CrossRef - Association of dietary intake with body mass index and glycemic profile among newly diagnosed patients with type 2 diabetes mellitus
Keddagoda Gamage Piyumi Wasana, Anoja Priyadarshani Attanayake, Thilak Priyantha Weerarathna, Devpura Arachchige Bandumalee Nimalshanthi Amarasekera, Kamani Ayoma Perera Wijewardana Jayatilaka
American Journal of Human Biology.2023;[Epub] CrossRef - Can lipophilic pollutants in adipose tissue explain weight change‐related risk in type 2 diabetes mellitus?
Duk‐Hee Lee, In‐Kyu Lee
Journal of Diabetes Investigation.2023; 14(4): 528. CrossRef - Visceral fat and attribute-based medicine in chronic kidney disease
Hiroshi Kataoka, Kosaku Nitta, Junichi Hoshino
Frontiers in Endocrinology.2023;[Epub] CrossRef - A primary care delivered, technology supported lifestyle program for Type 2 Diabetes Management: An evaluation of changes in metabolic health, feasibility, and acceptability – A pilot interventional study protocol
Pennie J. Taylor, Campbell H. Thompson, Thomas P. Wycherley, Grant D. Brinkworth
Contemporary Clinical Trials Communications.2023; 33: 101152. CrossRef - The medical model of “obesity” and the values behind the guise of health
Kayla R. Mehl
Synthese.2023;[Epub] CrossRef - Elevated MMP-8 levels, inversely associated with BMI, predict mortality in mechanically ventilated patients: an observational multicenter study
Hang Ruan, Shu-sheng Li, Qin Zhang, Xiao Ran
Critical Care.2023;[Epub] CrossRef - Obesity and 30-day case fatality after hyperglycemic crisis hospitalizations in Korea: a national cohort study
Hojun Yoon, Hyun Ho Choi, Giwoong Choi, Sun Ok Song, Kyoung Hwa Ha, Dae Jung Kim
Cardiovascular Prevention and Pharmacotherapy.2023; 5(3): 74. CrossRef - Normal‐weight central obesity and risk of cardiovascular and microvascular events in adults with prediabetes or diabetes: Chinese and British cohorts
Pingting Zhong, Shaoying Tan, Zhuoting Zhu, Ziyu Zhu, Yi Liang, Wenyong Huang, Wei Wang
Diabetes/Metabolism Research and Reviews.2023;[Epub] CrossRef - Overweight and obesity are associated with better survival in STEMI patients with diabetes
Hamza Chaudhry, Ramez Bodair, Ziyad Mahfoud, Soha Dargham, Jassim Al Suwaidi, Hani Jneid, Charbel Abi Khalil
Obesity.2023; 31(11): 2834. CrossRef - Influence of diabetes and obesity on ten-year outcomes after coronary artery bypass grafting in the arterial revascularisation trial
Maria Stefil, Mario Gaudino, Umberto Benedetto, Stephen Gerry, Alastair Gray, Belinda Lees, Bruno Podesser, Lukasz Krzych, Lokeswara Rao Sajja, David Taggart, Marcus Flather
Clinical Research in Cardiology.2023;[Epub] CrossRef - Poor glycaemic control: prevalence, factors and implications for the care of patients with type 2 diabetes in Kinshasa, Democratic Republic of the Congo: a cross-sectional study
Jean-Pierre Fina Lubaki, Olufemi Babatunde Omole, Joel Msafiri Francis
Frontiers in Clinical Diabetes and Healthcare.2023;[Epub] CrossRef - Comparison of obesity indices and triglyceride glucose-related parameters to predict type 2 diabetes mellitus among normal-weight elderly in China
Pan Ke, Xia Wu, Minzhi Xu, Jie Feng, Hongbin Xu, Yong Gan, Chao Wang, Zhenyu Deng, Xiang Liu, Wenning Fu, Qingfeng Tian, Yan He, Lirong Zhong, Heng Jiang, Zuxun Lu
Eating and Weight Disorders - Studies on Anorexia, Bulimia and Obesity.2022; 27(3): 1181. CrossRef - Association Between Obesity and Cardiovascular Disease in Elderly Patients With Diabetes: A Retrospective Cohort Study
Sangmo Hong, Jung Hwan Park, Kyungdo Han, Chang Beom Lee, Dong Sun Kim, Sung Hoon Yu
The Journal of Clinical Endocrinology & Metabolism.2022; 107(2): e515. CrossRef - The Relationship between the Lipid Accumulation Product and Beta-cell Function in Korean Adults with or without Type 2 Diabetes Mellitus: The 2015 Korea National Health and Nutrition Examination Survey
Hye Eun Cho, Seung Bum Yang, Mi Young Gi, Ju Ae Cha, so Young Park, Hyun Yoon
Endocrine Research.2022; 47(2): 80. CrossRef - Body mass index and all-cause mortality in patients with newly diagnosed type 2 diabetes mellitus in South Korea: a retrospective cohort study
Jae-Seok Hong, Hee-Chung Kang
BMJ Open.2022; 12(4): e048784. CrossRef - Social determinants of obesity in American Indian and Alaska Native peoples aged ≥ 50 years
R Turner Goins, Cheryl Conway, Margaret Reid, Luohua Jiang, Jenny Chang, Kimberly R Huyser, Angela G Brega, John F Steiner, Amber L Fyfe-Johnson, Michelle Johnson-Jennings, Vanessa Hiratsuka, Spero M Manson, Joan O’Connell
Public Health Nutrition.2022; 25(8): 2064. CrossRef - Cardiorespiratory Fitness, BMI, Mortality, and Cardiovascular Disease in Adults with Overweight/Obesity and Type 2 Diabetes
ANDREW C. WILLS, ELSA VAZQUEZ ARREOLA, MUIDEEN T. OLAIYA, JEFFREY M. CURTIS, MARGARETA I. HELLGREN, ROBERT L. HANSON, WILLIAM C. KNOWLER
Medicine & Science in Sports & Exercise.2022; 54(6): 994. CrossRef - Spline Longitudinal Multi-response Model for the Detection of Lifestyle-
Based Changes in Blood Glucose of Diabetic Patients
Anna Islamiyati
Current Diabetes Reviews.2022;[Epub] CrossRef - The obesity paradox: Retinopathy, obesity, and circulating risk markers in youth with type 2 diabetes in the TODAY Study
Lynne L. Levitsky, Kimberly L. Drews, Morey Haymond, Rose A. Glubitosi-Klug, Lorraine E. Levitt Katz, Mihai Mititelu, William Tamborlane, Jeanie B. Tryggestad, Ruth S. Weinstock
Journal of Diabetes and its Complications.2022; 36(11): 108259. CrossRef - Distribution of lean mass and mortality risk in patients with type 2 diabetes
Li Ding, Yuxin Fan, Jingting Qiao, Jing He, Ruodan Wang, Qing He, Jingqiu Cui, Zhongshu Ma, Fangqiu Zheng, Hua Gao, Chenlin Dai, Hongyan Wei, Jun Li, Yuming Cao, Gang Hu, Ming Liu
Primary Care Diabetes.2022; 16(6): 824. CrossRef - Current Knowledge on the Pathophysiology of Lean/Normal-Weight Type 2 Diabetes
Teresa Salvatore, Raffaele Galiero, Alfredo Caturano, Luca Rinaldi, Livio Criscuolo, Anna Di Martino, Gaetana Albanese, Erica Vetrano, Christian Catalini, Celestino Sardu, Giovanni Docimo, Raffaele Marfella, Ferdinando Carlo Sasso
International Journal of Molecular Sciences.2022; 24(1): 658. CrossRef - The obesity paradox and diabetes
Giovanni Gravina, Federica Ferrari, Grazia Nebbiai
Eating and Weight Disorders - Studies on Anorexia, Bulimia and Obesity.2021; 26(4): 1057. CrossRef - Implicating the effect of ketogenic diet as a preventive measure to obesity and diabetes mellitus
Sachin Kumar, Tapan Behl, Monika Sachdeva, Aayush Sehgal, Shilpa Kumari, Arun Kumar, Gagandeep Kaur, Harlokesh Narayan Yadav, Simona Bungau
Life Sciences.2021; 264: 118661. CrossRef - Diagnosis of obesity based on body composition‐associated health risks—Time for a change in paradigm
Anja Bosy‐Westphal, Manfred J. Müller
Obesity Reviews.2021;[Epub] CrossRef - Body mass index and clinical outcomes in patients with intracerebral haemorrhage: results from the China Stroke Center Alliance
Zhentang Cao, Xinmin Liu, Zixiao Li, Hongqiu Gu, Yingyu Jiang, Xingquan Zhao, Yongjun Wang
Stroke and Vascular Neurology.2021; 6(3): 424. CrossRef - Obesity and Overweight Are Associated with Minimal Extrathyroidal Extension, Multifocality and Bilaterality of Papillary Thyroid Cancer
Krzysztof Kaliszewski, Dorota Diakowska, Marta Rzeszutko, Jerzy Rudnicki
Journal of Clinical Medicine.2021; 10(5): 970. CrossRef - Obesity paradox in patients with cardiovascular diseases and diabetes mellitus type 2 (analytical review)
Margarita P. Zaikina, Valentina A. Kapustina, Stanislav I. Savel'ev
HEALTH CARE OF THE RUSSIAN FEDERATION.2021; 65(2): 135. CrossRef - Risk factors for adverse outcomes among 35 879 veterans with and without diabetes after diagnosis with COVID-19
Pandora L Wander, Elliott Lowy, Lauren A Beste, Luis Tulloch-Palomino, Anna Korpak, Alexander C Peterson, Bessie A Young, Edward J Boyko
BMJ Open Diabetes Research & Care.2021; 9(1): e002252. CrossRef - Obesity and glycemic control among people with type 2 diabetes in the United States: A retrospective cohort study using insurance claims data
Kristina S. Boye, Maureen J. Lage, Vivian Thieu, Shraddha Shinde, Shivanie Dhamija, Jay Patrick Bae
Journal of Diabetes and its Complications.2021; 35(9): 107975. CrossRef - Differential effects of body mass index on domain-specific cognitive outcomes after stroke
Minwoo Lee, Mi Sun Oh, San Jung, Ju-Hun Lee, Chul-Ho Kim, Min Uk Jang, Young Eun Kim, Hee-Joon Bae, Jaeseol Park, Yeonwook Kang, Byung-Chul Lee, Jae-Sung Lim, Kyung-Ho Yu
Scientific Reports.2021;[Epub] CrossRef - Associations between traditional and non-traditional anthropometric indices and cardiometabolic risk factors among inpatients with type 2 diabetes mellitus: a cross-sectional study
Sahar Golabi, Sajad Ajloo, Fatemeh Maghsoudi, Maryam Adelipour, Mahshid Naghashpour
Journal of International Medical Research.2021; 49(10): 030006052110499. CrossRef - Impact of preexisting type 2 diabetes mellitus and antidiabetic drugs on all-cause and cause-specific mortality among Medicaid-insured women diagnosed with breast cancer
Wayne R. Lawrence, Akiko S. Hosler, Margaret Gates Kuliszewski, Matthew C. Leinung, Xiuling Zhang, Maria J. Schymura, Francis P. Boscoe
Cancer Epidemiology.2020; 66: 101710. CrossRef - Serum Adiponectin and Progranulin Level in Patients with Benign Thyroid Nodule or Papillary Thyroid Cancer
Hyemi Kwon, Se Eun Park, Ji-Sup Yun, Cheol-Young Park
Endocrinology and Metabolism.2020; 35(2): 396. CrossRef - Obesity, sleep apnea, and cancer
Isaac Almendros, Miguel A. Martinez-Garcia, Ramon Farré, David Gozal
International Journal of Obesity.2020; 44(8): 1653. CrossRef - Association of Body Mass Index With Clinical Outcomes in Patients With Atrial Fibrillation: A Report From the FANTASIIA Registry
Vicente Bertomeu‐Gonzalez, José Moreno‐Arribas, María Asunción Esteve‐Pastor, Inmaculada Roldán‐Rabadán, Javier Muñiz, Paula Raña‐Míguez, Martín Ruiz‐Ortiz, Ángel Cequier, Vicente Bertomeu‐Martínez, Lina Badimón, Manuel Anguita, Gregory Y. H. Lip, Francis
Journal of the American Heart Association.2020;[Epub] CrossRef - Risk of type 2 diabetes according to the cumulative exposure to metabolic syndrome or obesity: A nationwide population‐based study
You‐Bin Lee, Da Hye Kim, Seon Mee Kim, Nan Hee Kim, Kyung Mook Choi, Sei Hyun Baik, Yong Gyu Park, Kyungdo Han, Hye Jin Yoo
Journal of Diabetes Investigation.2020; 11(6): 1583. CrossRef - Gut microbiota of obese and diabetic Thai subjects and interplay with dietary habits and blood profiles
Lucsame Gruneck, Niwed Kullawong, Kongkiat Kespechara, Siam Popluechai
PeerJ.2020; 8: e9622. CrossRef Multistate Models to Predict Development of Late Complications of Type 2 Diabetes in an Open Cohort Study
Roqayeh Aliyari, Ebrahim Hajizadeh, Ashraf Aminorroaya, Farshad Sharifi, Iraj Kazemi, Ahmad-Reza Baghestani
Diabetes, Metabolic Syndrome and Obesity: Targets and Therapy.2020; Volume 13: 1863. CrossRef- Early weaning induces short‐ and long‐term effects on pancreatic islets in Wistar rats of both sexes
Carla Bruna Pietrobon, Rosiane Aparecida Miranda, Iala Milene Bertasso, Paulo Cezar de Freitas Mathias, Maria Lúcia Bonfleur, Sandra Lucinei Balbo, Marise Auxiliadora de Barros Reis, Márcia Queiroz Latorraca, Vanessa Cristina Arantes, Elaine de Oliveira,
The Journal of Physiology.2020; 598(3): 489. CrossRef - A negative impact of recent weight loss on in-hospital mortality is not modified by overweight and obesity
Rocco Barazzoni, Isabella Sulz, Karin Schindler, Stephan C. Bischoff, Gianluca Gortan Cappellari, Michael Hiesmayr
Clinical Nutrition.2020; 39(8): 2510. CrossRef - Body mass index and mortality among middle-aged Japanese individuals with diagnosed diabetes: The Japan Public Health Center-based prospective study (JPHC study)
Chiho Yamazaki, Atsushi Goto, Motoki Iwasaki, Norie Sawada, Shino Oba, Mitsuhiko Noda, Hiroyasu Iso, Hiroshi Koyama, Shoichiro Tsugane
Diabetes Research and Clinical Practice.2020; 164: 108198. CrossRef Is the Obesity Paradox in Type 2 Diabetes Due to Artefacts of Biases? An Analysis of Pooled Cohort Data from the Heinz Nixdorf Recall Study and the Study of Health in Pomerania
Bernd Kowall, Andreas Stang, Raimund Erbel, Susanne Moebus, Astrid Petersmann, Antje Steveling, Karl-Heinz Jöckel, Henry Völzke
Diabetes, Metabolic Syndrome and Obesity: Targets and Therapy.2020; Volume 13: 1989. CrossRef- Associations between BMI, waist circumference, central obesity and outcomes in type II diabetes mellitus: The ACCORD Trial
Charles A. German, Brian Laughey, Alain G. Bertoni, Joseph Yeboah
Journal of Diabetes and its Complications.2020; 34(3): 107499. CrossRef - Trends in mechanical ventilation use and mortality over time in patients receiving mechanical ventilation in Spain from 2001 to 2015.
Javier de-Miguel-Díez, Rodrigo Jiménez-García, Valentín Hernández-Barrera, Jose J Zamorano-Leon, Rosa Villanueva-Orbaiz, Romana Albaladejo-Vicente, Ana López-de-Andrés
European Journal of Internal Medicine.2020; 74: 67. CrossRef - Type 2 diabetes mellitus: pathogenesis and genetic diagnosis
D. Himanshu, Wahid Ali, Mohd Wamique
Journal of Diabetes & Metabolic Disorders.2020; 19(2): 1959. CrossRef - Prevalence and factors associated with overweight and obesity among patients with type 2 diabetes mellitus in Uganda—a descriptive retrospective study
Salome Tino, Billy N Mayanja, Michael Charles Mubiru, Emmanuel Eling, Edward Ddumba, Pontiano Kaleebu, Moffat Nyirenda
BMJ Open.2020; 10(11): e039258. CrossRef - Nutrition Therapy in Critically Ill Overweight Elderly Patient with Heart Failure, Myocardial Infarction, Pneumonia, and Chronic Kidney Disease
Christina RUSLI, Agussalim BUKHARI, Nurpudji A. TASLIM, Suryani AS’AD, Haerani RASYID
Journal of Nutritional Science and Vitaminology.2020; 66(Supplement): S25. CrossRef - Obesity and childhood asthma
Jason E. Lang
Current Opinion in Pulmonary Medicine.2019; 25(1): 34. CrossRef - Why primary obesity is a disease?
Antonino De Lorenzo, Santo Gratteri, Paola Gualtieri, Andrea Cammarano, Pierfrancesco Bertucci, Laura Di Renzo
Journal of Translational Medicine.2019;[Epub] CrossRef - Impaired compensatory hyperinsulinemia among nonobese type 2 diabetes patients: a cross-sectional study
Jit Sarkar, Sujay Krishna Maity, Abhishek Sen, Titli Nargis, Dipika Ray, Partha Chakrabarti
Therapeutic Advances in Endocrinology and Metabolism.2019; 10: 204201881988902. CrossRef - Sedentary behaviour is associated with diabetes mellitus in adults: findings of a cross-sectional analysis from the Brazilian National Health System
Ítalo Ribeiro Lemes, Xuemei Sui, Bruna Camilo Turi-Lynch, Duck-chul Lee, Steven N Blair, Rômulo Araújo Fernandes, Jamile Sanches Codogno, Henrique Luiz Monteiro
Journal of Public Health.2019; 41(4): 742. CrossRef - Obesity Paradox in Chronic Liver Diseases: Product of Bias or a Real Thing?
Ines Bilic Curcic, Maja Cigrovski Berkovic, Lucija Kuna, Hrvoje Roguljic, Robert Smolic, Silvija Canecki Varzic, Lucija Virovic Jukic, Martina Smolic
Journal of Clinical and Translational Hepatology.2019; 7(3): 1. CrossRef - From the Obesity Tsunami to the Diabetes Avalanche: Primordial Prevention of the Diabesity-Related Cardiovascular Epidemic by Diabeto-Cardiologists
Mustafa Karakurt, Burak Acar, Ozcan Ozeke, Mustafa Bilal Ozbay, Yasin Ozen, Sefa Unal, Mustafa Karanfil, Cagri Yayla, Serkan Cay, Orhan Maden, Dursun Aras, Serkan Topaloglu, Sinan Aydogdu, Zehra Golbasi
Angiology.2019; 70(4): 371. CrossRef - Increased Plasma Dipeptidyl Peptidase-4 (DPP4) Activity Is an Obesity-Independent Parameter for Glycemic Deregulation in Type 2 Diabetes Patients
Jit Sarkar, Titli Nargis, Om Tantia, Sujoy Ghosh, Partha Chakrabarti
Frontiers in Endocrinology.2019;[Epub] CrossRef - INVESTIGATING INDIVIDUAL FACTORS RELATED TO READMISSION OF PATIENTS WITH TYPE 2 DIABETES- A CROSS-SECTIONAL STUDY
Valiallah Dashtpour, Mehran Hesaraki, Mahnaz Abavisani, Mahdieh Sari, Sudabeh Ahmadidarrehsima
Journal of Evolution of Medical and Dental Sciences.2018; 7(53): 5604. CrossRef
 PubReader
 Cite
Cite XML Download
- Figure
-
- Related articles
-
- Change Profiles and Functional Targets of MicroRNAs in Type 2 Diabetes Mellitus Patients with Obesity
- Intensified Multifactorial Intervention in Patients with Type 2 Diabetes Mellitus
- Blood Pressure Target in Type 2 Diabetes Mellitus
- Not Control but Conquest: Strategies for the Remission of Type 2 Diabetes Mellitus



