Association between Blood Mercury Level and Visceral Adiposity in Adults
Article information

Abstract
Background
Few studies have examined the association between mercury exposure and obesity. The aim of this study is to investigate the association between blood mercury concentrations and indices of obesity in adults.
Methods
A total of 200 healthy subjects, aged 30 to 64 years, who had no history of cardiovascular or malignant disease, were examined. Anthropometric and various biochemical profiles were measured. Visceral adipose tissue (VAT) was measured using dual-energy X-ray absorptiometry (DXA).
Results
All subjects were divided into three groups according to blood mercury concentrations. Compared with the subjects in the lowest tertile of mercury, those in the highest tertile were more likely to be male; were current alcohol drinkers and smokers; had a higher body mass index (BMI), waist circumference (WC), and VAT; had higher levels of blood pressure, fasting glucose, and insulin resistance; and consumed more fish. The blood mercury concentration was significantly associated with anthropometric parameters, showing relationships with BMI, WC, and VAT. After adjusting for multiple risk factors, the odds ratios (ORs) for high mercury concentration was significantly higher in the highest VAT tertile than in the lowest VAT tertile (OR, 2.66; 95% confidence interval, 1.05 to 6.62; P<0.05).
Conclusion
The blood mercury concentration was significantly associated with VAT in healthy adults. Further studies are warranted to confirm our findings.
INTRODUCTION
There has been a growing concern regarding the environmental and health effects of heavy metals. In particular, mercury is one of the most dangerous heavy metals and has been reported to increase oxidative stress and vascular inflammation [1]. Recently, some studies investigating the metabolic effects of mercury exposure had controversial findings. Several studies have suggested that mercury exposure plays a role in the induction or exacerbation of chronic metabolic diseases such as diabetes mellitus, metabolic syndrome (MetS), and cardiovascular disease [2345], whereas other studies have reported conflicting results [678910].
Although multiple studies demonstrate an association between mercury exposure and individual MetS components, there is a lack of data indicating the interrelation between mercury exposure and obesity. Some animal studies have suggested that blood mercury concentration is associated with obesity [1112], which is a well-known risk factor for metabolic diseases. Although a few human studies have investigated the association between blood mercury level and adiposity, which is measured using body mass index (BMI) and waist circumference (WC), the findings have been inconsistent [45913]. However, BMI and WC are not direct measures of adiposity. Furthermore, to our knowledge, no study has examined the relationship between the more direct measures of adiposity and blood mercury concentration.
Recently, a new algorithm to measure visceral adipose tissue (VAT) using dual-energy X-ray absorptiometry (DXA) instead of computer tomography (CT) and magnetic resonance imaging has been introduced, and DXA VAT has been demonstrated using volumetric CT as the reference standard [141516]. Therefore, we investigated the association between blood mercury concentration and obesity-related parameters using DXA in healthy adults.
METHODS
Study participants
In order to improve models predicting cardiovascular and metabolic disease, we established a multicenter population-based cohort study called the Cardiovascular and Metabolic Diseases Etiology Research Center. The details of the study design and procedures have been described previously [17].
The study was a cross-sectional analysis of baseline data from a prospective cohort study in progress. We included 200 healthy volunteers (adults aged 30 to 64 years, residing in Suwon, Yongin, and Hwaseong, Republic of Korea) who completed baseline health examinations and were measured for heavy metals. Subjects were excluded if they were suspected of having a current acute illness or a history of malignancy. We also excluded subjects with a clinical history of cardiovascular disease and those who were pregnant. The study design, data collection, and analyses were approved by the Institutional Review Boards of the centers involved (IRB; No. AJIRB-BMR-SUR-13-272), and written informed consent was obtained from all participants.
Questionnaire
Personal interviews were obtained using a standard questionnaire administered by trained personnel. The questionnaire included questions about demographic characteristics, smoking habits, alcohol consumption, and medical history. We also collected dietary data, including fish intake, which was assessed using a validated interviewer-administered semiquantitative food frequency questionnaire developed for use in Korea [18]. The questionnaire listed the most frequently consumed fish in Korea: mackerel, yellow corvine, hairtail, anchovy, squid, and pickled seafood. Fish consumption frequency was categorized as rare, <1 time/month, 2 to 4 times/month, and ≥1 time/week. Smoking status was divided into two categories: non-smoker and current smoker. Alcohol consumption was reported as ‘yes’ for participants who had consumed at least one glass of alcohol every month over the last year. Regular exercise was reported as ‘yes’ if the participant performed moderate or strenuous exercise on a regular basis, regardless of whether it was indoor or outdoor exercise (for more than 30 minutes at a time and more than five times per week in the case of moderate exercise such as cycling [slow], tennis [doubles], and light weight lifting; for more than 20 minutes at a time in the case of strenuous exercise such as running, climbing, fast cycling, tennis [singles], and heavy weight lifting), or when subjects walked for more than 30 minutes at a time more than five times per week.
Clinical characteristics
An automatic height-weight scale (BSM330; InBody Co. Ltd., Seoul, Korea) was used to measure the height (cm) and weight (kg) to a resolution of 0.1 cm and 0.1 kg, respectively. BMI was calculated by dividing the weight (kg) by the square of the height (m2). WC was measured at the midpoint between the lower border of the rib cage and the iliac crest. The definition of abdominal obesity by WC (defined by the Korean Society for the Study of Obesity) was ≥90 cm for men and ≥85 cm for women [19]. Systolic and diastolic blood pressures (BP) were measured by an experienced technician using an automated BP monitor (HEM-7080IC; Omron Healthcare, Lake Forest, IL, USA) by placing the arm at heart level after a 5-minute rest period.
Biochemical parameters
Blood samples were collected from all subjects after 8 hours of fasting. Samples were immediately centrifuged, and serum samples were stored at −70℃ until analysis by biochemical assay at a central laboratory (Seoul Clinical Laboratories, Seoul, Korea). Fasting serum glucose (FSG) was measured using the colorimetric method, and fasting serum insulin was determined by means of the radioimmunoassay method. Total cholesterol, high density lipoprotein cholesterol, and triglycerides (TGs) were determined through enzymatic methods; and low density lipoprotein cholesterol was calculated according to the Friedewald formula. Insulin resistance and β-cell function were estimated from FSG and insulin using the updated homeostatic model assessment (HOMA2) calculator [20]. Blood mercury concentrations were measured using the gold amalgam method (DMA-80; Milestone, Sorisole, Italy). The limit of detection for mercury was 0.05 µg/L, and the concentrations of all samples were higher than the limit of detection. The interassay coefficient of variation for the mercury assay was 5.7%.
Dual-energy X-ray absorptiometry
Total body DXA was measured using the Lunar iDXA (GE Healthcare, Madison, WI, USA) instrument. Patient positioning and data acquisition were conducted in accordance with the operator's manual [14]. Visceral fat analysis was performed using CoreScan (Corescan Pty Ltd., Ascot, Australia), a software option for the assessment of visceral fat (mass in g and volume in cm3) in the android region.
Statistical analysis
Demographic and biochemical data are presented as either mean±standard deviation (SD), median (interquartile range), or proportion, whereas mercury concentrations are presented as geometric mean with SD. Mercury concentrations, TG, homeostasis model assessment of insulin resistance (HOMA-IR), and homeostasis model assessment of β-cell function (HOMA-β) were log transformed to correct for skewed distributions. Intergroup comparisons were performed using analysis of variance tests, and a post hoc analysis was performed with Dunnett's test. Chi-square tests were used to compare categorical variables with percentages. Spearman correlation analysis was performed for investigation of association between mercury concentration and metabolic parameters. A high mercury level was arbitrarily defined as a value greater than 5.0 µg/L, an action level above which an increased risk of adverse health effects exist [21]. Logistic regression analysis was used to explore the association between high mercury level and VAT after adjusting for other risk factors. Adjusted odds ratios (ORs) and corresponding 95% confidence intervals (CIs) were estimated using multivariate logistic regression analysis models. The SPSS version 20.0 (IBM Co., Armonk, NY, USA) was used for all statistical analyses. P values <0.05 were considered statistically significant.
RESULTS
Characteristics of the subjects according to blood mercury concentrations
The subjects were divided into three groups according to blood mercury concentrations. The baseline clinical and biochemical characteristics of the study subjects are presented in Table 1. The geometric means of blood mercury concentrations across tertiles were 1.90, 3.44, and 6.15 µg/L. Compared with participants in the lowest tertile of mercury, those in the highest tertile were more likely to be male; were current alcohol drinkers and smokers; had a higher BMI, WC, and VAT; and had higher levels of BP, fasting glucose, and HOMA-IR. In addition, subjects with higher mercury concentrations consumed more fish.

Characteristics of the study subjects according to blood mercury concentrations
Correlation between serum mercury concentrations and other variables
In the analysis of correlations between log-transformed blood mercury and metabolic parameters, male, BMI, WC, VAT, systolic BP, diastolic BP, FSG, HOMA-IR, smoking, alcohol, and fish consumption showed correlation with blood mercury (Table 2).

Correlation between blood mercury concentrations and other variables
Comparisons of blood mercury concentrations according to anthropometric parameters
Blood mercury concentrations in subjects were compared according to the categories of anthropometric parameters (Fig. 1). The blood mercury concentration was lowest in those with normal BMI and higher in the obese group. Centrally obese subjects had a higher concentration of blood mercury than those with normal WC. Subjects were stratified into three groups according to VAT mass, and the blood mercury concentration was significantly higher in the highest tertile compared with the lowest tertile. On the contrary, no significant difference in the blood mercury concentration was observed according to total fat mass (TFM) tertile.
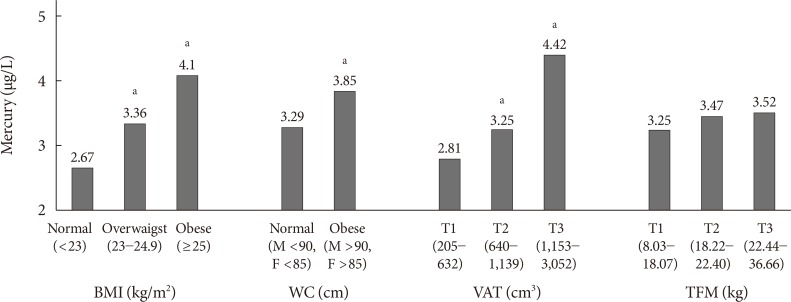
Blood mercury concentrations according to anthropometric parameters. BMI, body mass index; WC, waist circumference; VAT, visceral adipose tissue; TFM, total fat mass. aP<0.05 vs. the lowest group.
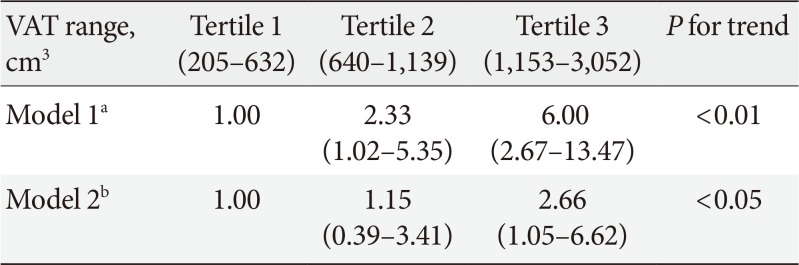
Multivariable analysis for high mercury level according to VAT
Table 3 presents the ORs and 95% CIs for a high mercury level according to VAT tertile. In the unadjusted multivariable logistic regression analysis, when tertile 1 was set as a reference, ORs of the blood mercury concentration increased significantly according to the VAT tertile. After adjusting for confounding variables, this relationship remained statistically significant.

Odds ratios and 95% confidence intervals for high mercury concentrations according to VAT tertile
DISCUSSION
The present study investigated the relationship between the blood mercury concentration and obesity in Korean adults and found that the blood mercury level was significantly associated with visceral adiposity after adjustment for confounding parameters. To the best of our knowledge, this is the first report on the associations between mercury concentrations in the blood and visceral adiposity based on DXA.
Although determining the exact body accumulation of heavy metals is very difficult, blood concentrations of heavy metals are widely used as an indicator of exposure [2223]. In addition, blood mercury has been used in epidemiologic studies as a marker for mercury exposure in the general population [1324]. The geometric mean of the blood mercury concentration in this study was 3.42 µg/L. This finding is lower than that of other previous Korean studies [42526] but higher than that of previous reports from the United States and Canada [272829]. Fish consumption is one of major causes of mercury exposure [30], and fish and seafood are one of the favorite foods in Korea, which may explain why the blood mercury concentrations of the participants in this study were higher than those of adults in the United States and Canada. In addition, most enrolled subjects resided in inland areas, which may explain the lower blood mercury concentrations in this study compared with the results of other Korean studies. In this study, the blood mercury concentration tended to increase with increasing fish consumption frequency, and this finding is consistent with that of previous studies [3132]. However, further studies will be necessary to elucidate other significant contributing exposure sources.
In our study, mercury concentrations were significantly higher in males and correlated positively with smoking status, alcohol intake, and BPs; these findings are similar to previous studies [452633]. In addition, we noted consistent increases in fasting glucose and HOMA-IR with increasing blood concentrations of mercury. Recently, several studies have reported that mercury induces an increase in insulin resistance or β-cell dysfunction [23435]. However, these findings have been inconsistent; some studies found no association between blood mercury and hyperglycemia [10]. Our results support the hypothesis that blood mercury may affect insulin resistance, and further prospective studies should be performed to establish causal inference and elucidate the mechanisms.
Blood mercury concentrations showed significant differences according to anthropometric parameters in this study. The blood mercury concentration increased according to BMI, WC, and VAT, and these obesity indices were increased in relation to the blood mercury concentration. However, these findings differed from those of previous studies. In a study with Brazilian inhabitants, hair mercury content was not associated with BMI [36]. Further, using data from the National Health and Nutrition Examination Survey, Rothenberg et al. [13] reported that blood mercury concentrations were inversely correlated with BMI. In contrast, Cho et al. [26] showed that a higher BMI was independently associated with a higher blood mercury level.
While BMI is an indirect measure of general adiposity, TFM is a direct measure of general adiposity. However, we did not find any association between blood mercury level and TFM. Although BMI is generally parallel to TFM (r=0.79, P<0.01 in the present results), we could not explain the reason for this discrepancy. However, adiposity can differ in patients with the same BMI.
In addition, WC and waist-to-hip ratio are indirect measures of central adiposity, whereas VAT is a direct measure of central adiposity. In the present study, WC was significantly correlated with blood mercury levels, which is concurrent with the previous results [433343537]. Moreover, blood mercury concentrations were also significantly associated with visceral adiposity after adjusting for confounding variables. Although the mechanism of the relationship between central adiposity and the blood mercury level is not yet clear, a few possible explanations have been suggested regarding the association between heavy metal exposure and adipose tissues [3839]. First, because heavy metals tend to accumulate in adipose tissues, the amount of adipose tissue may affect heavy metal concentrations in blood. Qin et al. [40] have reported that the mercury concentration is significantly higher in visceral fat than in subcutaneous fat. In contrast, a recent in vivo investigation has observed an increase in mercury concentration in the blood of diabetic mice, but the authors suppose that body fat gain and low mercury accumulation in adipose tissue increased mercury concentrations in blood and organs in diabetic mice [12]. Second, some data have reported that obesity is accompanied by impaired biliary secretion and that persons with more body fat eliminate heavy metals more slowly than those with less body fat [4142]. Because mercury is excreted mainly in the feces by processes of biliary excretion, impaired mercury excretion is one possible mechanism for this association [43]. Therefore, although the mechanism underlying the relationship of blood mercury level and central obesity is not completely understood, VAT might play an important role in blood mercury concentration. Taken together, our findings suggest that high visceral fat mass levels should be considered as a confounding factor when blood mercury is used as an indicator of exposure.
Several limitations of our study need to be considered. First, cross-sectional design cannot determine whether there was a causal relationship between mercury concentrations and visceral adiposity. Second, our study population was relatively small. More prospective large-population studies are necessary to confirm the relationship. Third, the mercury exposure was evaluated using a single blood sample measurement. Despite these limitations, our results are meaningful because a significant association between the blood mercury level and VAT was found.
In conclusion, we demonstrated that the blood mercury concentration was significantly associated with VAT in adults. Further prospective large-scale studies are required to elucidate the mechanism behind the relationship between mercury exposure and obesity index.
ACKNOWLEDGMENTS
This study was supported by a grant from the Korean Health Technology R&D Project, Ministry of Health and Welfare, Korea (HI13C0715).
Notes
CONFLICTS OF INTEREST: No potential conflict of interest relevant to this article was reported.