- Current
- Browse
- Collections
-
For contributors
- For Authors
- Instructions to authors
- Article processing charge
- e-submission
- For Reviewers
- Instructions for reviewers
- How to become a reviewer
- Best reviewers
- For Readers
- Readership
- Subscription
- Permission guidelines
- About
- Editorial policy
Articles
- Page Path
- HOME > Diabetes Metab J > Volume 40(1); 2016 > Article
-
Original ArticleOthers The Association of Serum Cystatin C with Glycosylated Hemoglobin in Korean Adults
-
Eun Hee Sim1,2, Hye Won Lee1,2, Hyun Ju Choi1,2, Dong Wook Jeong2,3, Seok Man Son1,2, Yang Ho Kang1,2

-
Diabetes & Metabolism Journal 2016;40(1):62-69.
DOI: https://doi.org/10.4093/dmj.2016.40.1.62
Published online: November 27, 2015
1Division of Endocrinology and Metabolism, Department of Internal Medicine, Pusan National University Yangsan Hospital, Pusan National University School of Medicine, Yangsan, Korea.
2Research Institute for Convergence of Biomedical Science and Technology, Pusan National University Yangsan Hospital, Pusan National University School of Medicine, Yangsan, Korea.
3Department of Family Medicine, Pusan National University Yangsan Hospital, Pusan National University School of Medicine, Yangsan, Korea.
- Corresponding author: Yang Ho Kang. Division of Endocrinology and Metabolism, Department of Internal Medicine, Pusan National University Yangsan Hospital, Pusan National University School of Medicine, 20 Geumo-ro, Mulgeum-eup, Yangsan 50612, Korea. kangyh@pusan.ac.kr
Copyright © 2016 Korean Diabetes Association
This is an Open Access article distributed under the terms of the Creative Commons Attribution Non-Commercial License (http://creativecommons.org/licenses/by-nc/3.0/) which permits unrestricted non-commercial use, distribution, and reproduction in any medium, provided the original work is properly cited.
ABSTRACT
-
Background
- Cystatin C has been known to be associated not only with early renal impairment but also with the incidence of diabetic conditions (prediabetes plus diabetes). However, it is not clear whether cystatin C levels are associated with the prevalence of diabetic conditions in Asian populations. We evaluated this association using glycosylated hemoglobin (HbA1c) levels as the definition of diabetes in Korean adults.
-
Methods
- We analyzed data from 1,559 Korean adults (937 men and 622 women) with available serum cystatin C and HbA1c values.
-
Results
- The serum cystatin C levels in subjects with prediabetes and diabetes were significantly increased (0.91±0.14 mg/L in prediabetes and 0.91±0.17 mg/L in diabetes vs. 0.88±0.13 mg/L in patients with normal glucose levels, P=0.001). At increasing cystatin C levels, the prevalence of subjects with prediabetes (30.2% vs. 14.6%, P<0.001) and those with diabetes (10.6% vs. 8.0%, P<0.001) significantly increased in the group with the highest cystatin C levels. The group with the highest cystatin C levels had a significantly increased odds ratio (OR) for the presence of diabetic conditions compared to the group with the lowest values in total subjects (OR, 2.35; 95% confidence interval [CI], 1.54 to 3.58; P<0.001) and in women (OR, 4.13; 95% CI, 1.97 to 8.65; P<0.001), though there was no significant increase after adjusting for multiple variables.
-
Conclusions
- Higher levels of serum cystatin C are associated with an increased prevalence of diabetic conditions in Korean adults. Our findings may extend the positive association of cystatin C with diabetes incidence to an Asian population.
- Cystatin C, a cysteine protease inhibitor, is freely filtered by the renal glomeruli and metabolized by the proximal tubule [1]. It has been known to be a promising marker of kidney function that predicts renal function decline earlier than serum creatinine levels [2]. Furthermore, some studies have demonstrated that elevated levels of serum cystatin C are associated not only with early renal impairment in diabetes [3456] but also with obesity, atherosclerosis, insulin resistance, and hypertension [78910], which have a close relationship with the pathogenesis of cardiometabolic disorder.
- Regarding the association between cystatin C and the incidence of diabetes, Donahue et al. [11] showed that serum cystatin C is associated with the risk of progression from normoglycaemia to prediabetes in Western New York Health Study participants and Sahakyan et al. [12] reported an association between elevated cystatin C levels and diabetes in a large sample of white adults in the US. Another study by Sabanayagam et al. [13] showed that elevated levels of serum cystatin C are associated with prediabetes in a nationally representative sample of non-obese United States adults. However, all of these studies were conducted in Western populations and it is not clear whether cystatin C levels are associated with diabetic conditions (prediabetes plus diabetes) consistently in all race and ethnic groups.
- The glycosylated hemoglobin (HbA1c, A1c) is a test of glucose control over the relatively long term period of 2 to 3 months. The aim of this study is to evaluate the association between serum cystatin C and HbA1c test results, a clinical representative of diabetic conditions, and the usefulness of serum cystatin C in predicting the prevalence of diabetes according to the ranges of HbA1c in Korean adults.
INTRODUCTION
- Subjects
- We analyzed data from 1,896 adults aged ≥20 years with available serum cystatin C and HbA1c measurements who participated in a comprehensive health examination at Pusan National University Yangsan Hospital in Yangsan, Korea in 2013. Of the subjects, we excluded those aged >70 years (n=93), those with liver disease (serum levels of aspartate aminotransferase [AST] or alanine aminotransferase [ALT] were greater than three times the upper limit of the reference range; n=9), abnormal serum thyroid stimulating hormone (TSH) levels (TSH <0.27 or >4.2 µIU/mL; n=178), abnormal serum creatinine levels (male ≥1.5 mg/dL, female ≥1.3 mg/dL; n=54), or elevated high sensitivity C-reactive protein (hs-CRP) levels (>10.0 mg/L; n=3). Finally, 1,559 adults (937 men and 622 women) were enrolled in the study.
- Informed consent for the use of the health screening data for research was obtained from the subjects. The design and the protocol of this study were reviewed and approved by the Institutional Review Board of Pusan National University Yangsan Hospital and are in accordance with the Helsinki Declaration of 1975 (IRB No. 05-2015-002).
- Anthropometric and biochemical data
- Height and weight were measured while the subjects wore light clothing without shoes. Body mass index (BMI) was calculated as weight in kilograms divided by height in meters squared. Waist circumference was measured with a soft tape on standing subjects midway between the lowest rib and the iliac crest. Blood pressure was measured on the right arm with subjects in a seated position after a 5-minute rest. Blood specimens were sampled from the antecubital vein after an overnight fast. Fasting blood glucose was measured by the glucose oxidase method (Synchron LX-20; Beckman Coulter Inc., Fullerton, CA, USA). Concentrations of standard liver enzyme, total cholesterol, high density lipoprotein cholesterol (HDL-C), serum triglyceride (TG), and gamma-glutamyltransferase (GGT) were measured using an autoanalyzer and the enzymatic colorimetric method (Hitachi 7600; Hitachi Ltd., Tokyo, Japan). The serum cystatin C was analyzed using an immunoturbidimetric assay (TBA-200FR NEO; Toshiba, Tokyo, Japan).
- The HbA1c was measured using high performance liquid chromatography (Varian II Turbo; Bio-Rad Laboratories, Hercules, CA, USA). The homeostasis model assessment of insulin resistance (HOMA-IR) index was calculated using the following formula: HOMA-IR=[fasting serum insulin (mU/L)×fasting plasma glucose (mmol/L)]/22.5.
- Based on the recent American Diabetes Association recommendation [14], subjects with HbA1c levels within the range of 5.7% to 6.4% were categorized in the prediabetes group, those with levels more than 6.5% were categorized in the diabetes group, and those with levels less than 5.7% were categorized in the normal glucose group.
- Statistical analysis
- All data are presented as the mean±standard deviation for continuous variables. The median values are also indicated in the cases of TG, GGT, and hs-CRP, which have skewed distributions. The subjects were divided into three groups according to their HbA1c levels: the normal glucose group, the prediabetes group, and the diabetes group. In addition, the subjects were divided into five groups based on the distribution of serum cystatin C (first <0.8 mg/L, second 0.8 mg/L, third 0.9 mg/L, fourth 1.0 mg/L, and fifth >1.0 mg/L). The categorical variables were compared using the chi-square test. The mean (plus the median for TG, GGT, and hs-CRP) levels of continuous variables were compared using one-way analysis of variance analysis followed by post hoc testing using the S-N-K test (the Kruskal-Wallis test and Dunn's multiple comparison test for TG, GGT, and hs-CRP levels). The bivariate correlation analyses between serum cystatin C and HbA1c were performed using Pearson correlation analysis.
- Finally, the odds ratios (ORs) and corresponding 95% confidence interval (CI) of the group with the highest serum cystatin C levels (fifth) were calculated as an estimate of the relative risk of diabetic conditions compared to the lowest group (first) used as the reference category. The multiple logistic regression analyses consisted of the non-adjusted model, the age and sex adjusted model (age adjusted for each gender), and the multivariable model (additionally adjusting for BMI, total cholesterol, and systolic blood pressure). The statistical analyses were performed with SPSS version 18.0 (SPSS Inc., Chicago, IL, USA). A probability value of less than 0.05 was considered significant.
METHODS
- The mean serum cystatin C level was 0.92±0.13 mg/L in men and 0.84±0.13 mg/L in women. Prediabetes was diagnosed in 210 men (13.5%) and 129 women (8.3%). Diabetes was diagnosed in 79 men (5.1%) and 32 women (2.1%). Subjects with prediabetes and diabetes were more likely to be older; had a larger waist circumference; had higher BMI, blood pressure, TG, AST, ALT, GGT, and hs-CRP levels; exhibited insulin resistance; and had lower values of HDL-C. The serum cystatin C levels in subjects with prediabetes and diabetes were also significantly increased compared to those of subjects with normal glucose (0.91±0.14 mg/L in prediabetes and 0.91±0.17 mg/L in diabetes vs. 0.88±0.13 mg/L in patients with normal glucose levels, P=0.001) (Table 1).
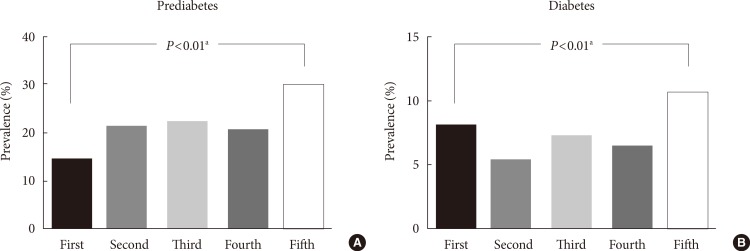
- With an increase in the serum cystatin C levels, the values of age, waist circumference, BMI, blood pressure, HOMA-IR, total cholesterol, TG, AST, ALT, GGT, uric acid, and hs-CRP were significantly increased. The HDL-C level was significantly deceased with an increase in the serum cystatin C levels (Table 2). With an increase in the serum cystatin C levels, the prevalence of subjects with prediabetes (first 14.6%, second 21.5%, third 22.4%, fourth 20.9%, and fifth 30.2%) (Fig. 1A) and those with diabetes (first 8.0%, second 5.3%, third 7.2%, fourth 6.5%, and fifth 10.6%) (Fig. 1B) showed increasing trends and were significantly increased in the group with the highest serum cystatin C levels (fifth >1.0 mg/L) compared to the group with the lowest serum cystatin C levels (first <0.8 mg/L).
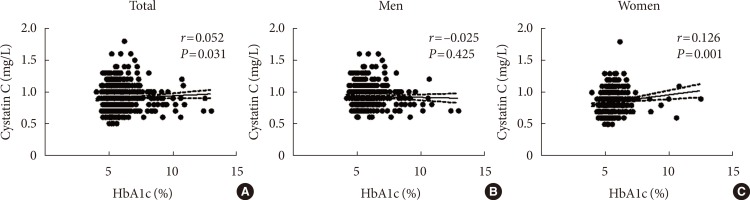
- In the bivariate correlation analysis between serum cystatin C and HbA1c, serum cystatin C had significant but weak positive correlations with HbA1c in total subjects (r=0.052, P= 0.031) and in women (r=0.126, P=0.001) (Fig. 2).
- The relative risk of subjects in the group with the highest serum cystatin C levels (fifth >1.0 mg/L) for the presence of diabetic conditions compared to those with the lowest serum cystatin C levels (first <0.8 mg/L) was significantly increased in the non-adjusted model (OR, 2.35; 95% CI, 1.54 to 3.58; P<0.001). However, this increased OR was attenuated and not significant in the age- and sex-adjusted model (OR, 1.21; 95% CI, 0.76 to 1.92) and the multivariable model (OR, 1.01; 95% CI, 0.62 to 1.63) (Table 3).
- When stratified by gender, there was no significant increase in the relative risk of subjects in the group with the highest cystatin C levels compared to those with the lowest cystatin C levels in all logistic regression models in men. However, in women, there was a significant OR increase in the non-adjusted model (OR, 4.13; 95% CI, 1.97 to 8.65; P<0.001), although it was attenuated and not significant in both the age-adjusted (OR, 1.32; 95% CI, 0.58 to 3.00) and the multivariable model (OR, 1.10; 95% CI, 0.47 to 2.57).
RESULTS
- In this study, we demonstrated that serum cystatin C levels are significantly increased in subjects with diabetic conditions compared to those with normal glucose levels according to the HbA1c range in Korean adults. Furthermore, higher levels of serum cystatin C were significantly associated with an increased prevalence of diabetic conditions. There have been several studies that have shown that cystatin C could be an early and better marker in estimating renal function in diabetes or diabetic nephropathy [3456]. However, to the best of our knowledge, our findings were the first data from an Asian population to be used to assess the association between serum cystatin C levels and the prevalence of diabetic conditions. Our study is consistent with some previous studies that have reported an association between cystatin C levels and diabetic conditions, which were performed in predominantly white populations [111213].
- In this study, the significantly increased relative risks of the group with the highest serum cystatin C levels for the prevalence of diabetic conditions in the total subjects and women were attenuated and not significant in both the age- and sex-adjusted and the multivariable (additionally adjusted for BMI, blood pressure, and cholesterol) models. According to the study by Sabanayagam et al. [13], the positive association between cystatin C and prediabetes was significant among non-Hispanic whites, whereas the association was not significant among other races and ethnicities in both the age- and sex-adjusted and the multivariable models. This finding provides a possible explanation for our results, suggesting that the positive association of cystatin C with diabetic conditions may be weaker in Asian populations compared to white populations although the possible existence of the ethnic differences in this association is not fully elucidated.
- Several possible mechanisms may explain the positive relationship between cystatin C and the incidence of diabetic conditions. First, cystatin C has been known to have a close relationship with the multiple risk factors of diabetes such as obesity [810], insulin resistance [15], chronic inflammation [1617], endothelial dysfunction [18], and metabolic syndrome [79]. Second, cystatin C has been shown to be not only a better and more specific marker of renal function than serum creatinine but also might play a role beyond renal function such as unforeseen toxic effects, which may contribute to predicting cardiovascular disease better than creatinine [1920].
- In a previous study [13], the association between cystatin C and prediabetes was stronger in women compared to men, and we also found that the relative risk of the group with the highest serum cystatin C levels for the prevalence of diabetic conditions compared to the group with the lowest levels was increased in Korean women. There were several reports that suggest possible explanations for this gender difference. One study demonstrated that women who progressed from normoglycemia to prediabetes have greater endothelial dysfunction and fibrinolysis than men [21], and another study showed that the elevated levels of C-reactive protein, a powerful inflammatory marker of diabetes, are associated with an increased risk of type 2 diabetes, which is stronger in women than in men [22].
- Our study has some limitations. First, it was conducted using a cross sectional design and thus did not identify a causal relationship. Second, the total number of enrolled subjects was relatively small. Therefore, the small number of diabetic conditions, especially subjects with diabetes, may have affected our results that showed no significant difference in the serum cystatin C levels between subjects with prediabetes and those with diabetes, and a significant but weak correlation between serum cystatin C and HbA1c. Third, because the oral glucose tolerance test was not included in the medical checkup program, we used HbA1c levels alone for the definition of prediabetes and diabetes. Fourth, we could not analyze social data such as a history of exercise, diet, and smoking status, and medication use for previously diagnosed hypertension and/or hyperlipidemia, which could affect the prevalence of diabetic conditions. Fifth, there might be a possibility that known diabetic patients who have used oral hypoglycemic agents and/or insulin were classified in the normal glucose or prediabetes groups. However, current blood glucose control reflected by the HbA1c test may be meaningful in the evaluation of the association with serum cystatin C.
- In conclusion, our study demonstrated that serum cystatin C levels were significantly increased in subjects with diabetic conditions compared to in those with normal glucose levels defined by HbA1c levels, a useful clinical test for the assessment of long term glucose control, in Korean adults. Furthermore, higher levels of serum cystatin C were associated with an increased prevalence of diabetic conditions. Our findings may be the first to describe this association in an Asian population and to extend the positive association between cystatin C and the incidence of diabetes to Asian as well as white populations.
DISCUSSION
-
CONFLICTS OF INTEREST: No potential conflict of interest relevant to this article was reported.
NOTES
- 1. Filler G, Bokenkamp A, Hofmann W, Le Bricon T, Martinez-Bru C, Grubb A. Cystatin C as a marker of GFR: history, indications, and future research. Clin Biochem 2005;38:1-8. ArticlePubMed
- 2. Coll E, Botey A, Alvarez L, Poch E, Quinto L, Saurina A, Vera M, Piera C, Darnell A. Serum cystatin C as a new marker for noninvasive estimation of glomerular filtration rate and as a marker for early renal impairment. Am J Kidney Dis 2000;36:29-34. ArticlePubMed
- 3. Mussap M, Dalla Vestra M, Fioretto P, Saller A, Varagnolo M, Nosadini R, Plebani M. Cystatin C is a more sensitive marker than creatinine for the estimation of GFR in type 2 diabetic patients. Kidney Int 2002;61:1453-1461. ArticlePubMed
- 4. Pucci L, Triscornia S, Lucchesi D, Fotino C, Pellegrini G, Pardini E, Miccoli R, Del Prato S, Penno G. Cystatin C and estimates of renal function: searching for a better measure of kidney function in diabetic patients. Clin Chem 2007;53:480-488. ArticlePubMedPDF
- 5. Willems D, Wolff F, Mekahli F, Gillet C. Cystatin C for early detection of renal impairment in diabetes. Clin Biochem 2009;42:108-110. ArticlePubMed
- 6. Jeon YK, Kim MR, Huh JE, Mok JY, Song SH, Kim SS, Kim BH, Lee SH, Kim YK, Kim IJ. Cystatin C as an early biomarker of nephropathy in patients with type 2 diabetes. J Korean Med Sci 2011;26:258-263. ArticlePubMedPMCPDF
- 7. Servais A, Giral P, Bernard M, Bruckert E, Deray G, Isnard Bagnis C. Is serum cystatin-C a reliable marker for metabolic syndrome? Am J Med 2008;121:426-432. ArticlePubMed
- 8. Lafarge JC, Naour N, Clement K, Guerre-Millo M. Cathepsins and cystatin C in atherosclerosis and obesity. Biochimie 2010;92:1580-1586. ArticlePubMed
- 9. Surendar J, Indulekha K, Aravindhan V, Ganesan A, Mohan V. Association of cystatin-C with metabolic syndrome in normal glucose-tolerant subjects (CURES-97). Diabetes Technol Ther 2010;12:907-912. ArticlePubMed
- 10. Shankar A, Teppala S. Relationship between body mass index and high cystatin levels among US adults. J Clin Hypertens (Greenwich) 2011;13:925-930. ArticlePubMedPMC
- 11. Donahue RP, Stranges S, Rejman K, Rafalson LB, Dmochowski J, Trevisan M. Elevated cystatin C concentration and progression to pre-diabetes: the Western New York study. Diabetes Care 2007;30:1724-1729. PubMed
- 12. Sahakyan K, Lee KE, Shankar A, Klein R. Serum cystatin C and the incidence of type 2 diabetes mellitus. Diabetologia 2011;54:1335-1340. ArticlePubMedPMCPDF
- 13. Sabanayagam C, Wong TY, Xiao J, Shankar A. Serum cystatin C and prediabetes in non-obese US adults. Eur J Epidemiol 2013;28:311-316. ArticlePubMedPDF
- 14. American Diabetes Association. Standards of medical care in diabetes: 2014. Diabetes Care 2014;37(Suppl 1):S14-S80. ArticlePubMedPDF
- 15. Lee SH, Park SA, Ko SH, Yim HW, Ahn YB, Yoon KH, Cha BY, Son HY, Kwon HS. Insulin resistance and inflammation may have an additional role in the link between cystatin C and cardiovascular disease in type 2 diabetes mellitus patients. Metabolism 2010;59:241-246. ArticlePubMed
- 16. Shlipak MG, Katz R, Cushman M, Sarnak MJ, Stehman-Breen C, Psaty BM, Siscovick D, Tracy RP, Newman A, Fried L. Cystatin-C and inflammatory markers in the ambulatory elderly. Am J Med 2005;118:1416Article
- 17. Taglieri N, Koenig W, Kaski JC. Cystatin C and cardiovascular risk. Clin Chem 2009;55:1932-1943. ArticlePubMedPDF
- 18. Reffelmann T, Krebs A, Ittermann T, Empen K, Hummel A, Dorr M, Volzke H, Felix SB. Mild renal dysfunction as a non-traditional cardiovascular risk factor? Association of cystatin C-based glomerular filtration rate with flow-mediated vasodilation. Atherosclerosis 2010;211:660-666. ArticlePubMed
- 19. Shlipak MG, Sarnak MJ, Katz R, Fried LF, Seliger SL, Newman AB, Siscovick DS, Stehman-Breen C. Cystatin C and the risk of death and cardiovascular events among elderly persons. N Engl J Med 2005;352:2049-2060. ArticlePubMed
- 20. Ristiniemi N, Lund J, Tertti R, Christensson A, Ilva T, Porela P, Pulkki K, Pettersson K. Cystatin C as a predictor of all-cause mortality and myocardial infarction in patients with non-ST-elevation acute coronary syndrome. Clin Biochem 2012;45:535-540. ArticlePubMed
- 21. Donahue RP, Rejman K, Rafalson LB, Dmochowski J, Stranges S, Trevisan M. Sex differences in endothelial function markers before conversion to pre-diabetes: does the clock start ticking earlier among women? The Western New York Study. Diabetes Care 2007;30:354-359. PubMed
- 22. Thorand B, Baumert J, Kolb H, Meisinger C, Chambless L, Koenig W, Herder C. Sex differences in the prediction of type 2 diabetes by inflammatory markers: results from the MONICA/KORA Augsburg case-cohort study, 1984-2002. Diabetes Care 2007;30:854-860. PubMed
REFERENCES
Differences in the proportions of the subjects with (A) prediabetes and (B) diabetes among the five groups classified according to serum cystatin C levels. Serum cystatin C groups: first (<0.8 mg/L), second (0.8 mg/L), third (0.9 mg/L), fourth (1.0 mg/L), and fifth (>1.0 mg/L). aP values were calculated using the chi-square test.


The characteristics of the subjects with normal glucose, prediabetes, and diabetes defined by HbA1c levels
Values are presented as mean±standard deviation unless other indicated. P values were calculated using one-way analysis of variance analysis followed by post hoc testing with the S-N-K test unless otherwise indicated.
HbA1c, glycosylated hemoglobin; WC, waist circumference; BMI, body mass index; SBP, systolic blood pressure; DBP, diastolic blood pressure; FBG, fasting blood sugar; HOMA-IR, homeostasis model assessment of insulin resistance; TC, total cholesterol; LDL-C, low density lipoprotein cholesterol; TG, triglyceride; HDL-C, high density lipoprotein cholesterol; AST, aspartate aminotransferase; ALT, alanine aminotransferase; GGT, gamma glutamyltransferase; BUN, blood urea nitrogen; hs-CRP, high sensitivity C-reactive protein.
a,b,cThe same letters indicate insignificant differences between groups, dKruskal-Wallis test and Dunn's multiple comparison test.
Differences in the parameter values among the five groups classified according to the range of serum cystatin C levels
Values are presented as mean±standard deviation unless other indicated. P values were calculated by one-way analysis of variance analysis followed by post hoc testing with the S-N-K test unless otherwise indicated.
WC, waist circumference; BMI, body mass index; SBP, systolic blood pressure; DBP, diastolic blood pressure; HbA1c, glycosylated hemoglobin; FBG, fasting blood sugar; HOMA-IR, homeostasis model assessment of insulin resistance; TC, total cholesterol; LDL-C, low density lipoprotein cholesterol; TG, triglyceride; HDL-C, high density lipoprotein cholesterol; AST, aspartate aminotransferase; ALT, alanine aminotransferase; GGT, gamma glutamyltransferase; BUN, blood urea nitrogen; hs-CRP, high sensitivity C-reactive protein.
a,b,c,d,eThe same letters indicate insignificant differences between groups, fSerum cystatin C groups: first (<0.8 mg/L), second (0.8 mg/L), third (0.9 mg/L), fourth (1.0 mg/L), and fifth (>1.0 mg/L), gKruskal-Wallis test and Dunn's multiple comparison test.
OR (95% CI) for the prevalence of diabetic conditions
OR, odds ratio; CI, confidence interval.
aSerum cystatin C groups: first (<0.8 mg/L), second (0.8 mg/L), third (0.9 mg/L), fourth (1.0 mg/L), and fifth (>1.0 mg/L), bNon-adjusted model, cAge-adjusted (in total group, age- and sex-adjusted) model, dMultivariable model (additionally adjusting for body mass index, total cholesterol, and systolic blood pressure).
Figure & Data
References
Citations
- Prognostic significance of serum cystatin C in acute brainstem infarctions patients
H. Li, B. Zhang, Z. Huang, H. Wu, B. Qin, L. Zhou, Z. Lu, F. Qin
Revue Neurologique.2024;[Epub] CrossRef - Cardiovascular risk assessment in prediabetic patients in a hypertensive population: The role of cystatin C
Rafael Garcia-Carretero, Luis Vigil-Medina, Inmaculada Mora-Jimenez, Cristina Soguero-Ruiz, Rebeca Goya-Esteban, Javier Ramos-Lopez, Oscar Barquero-Perez
Diabetes & Metabolic Syndrome: Clinical Research & Reviews.2018; 12(5): 625. CrossRef - Characteristics of Dapagliflozin Responders: A Longitudinal, Prospective, Nationwide Dapagliflozin Surveillance Study in Korea
Eugene Han, Ari Kim, Sung Jae Lee, Je-Yon Kim, Jae Hyeon Kim, Woo Je Lee, Byung-Wan Lee
Diabetes Therapy.2018; 9(4): 1689. CrossRef - Cystatin C as a Predictor for Diabetes according to Glycosylated Hemoglobin Levels in Korean Patients
Eon Ju Jeon, Ji Hyun Lee
Diabetes & Metabolism Journal.2016; 40(1): 32. CrossRef - Prevalence of Reduced Kidney Function by Estimated Glomerular Filtration Rate Using an Equation Based on Creatinine and Cystatin C in Metabolic Syndrome and Its Components in Korean Adults
Yang Ho Kang, Dong Wook Jeong, Seok Man Son
Endocrinology and Metabolism.2016; 31(3): 446. CrossRef - Letter: The Association of Serum Cystatin C with Glycosylated Hemoglobin in Korean Adults (Diabetes Metab J 2016;40:62-9)
Kyung-Soo Kim
Diabetes & Metabolism Journal.2016; 40(2): 171. CrossRef - Response: The Association of Serum Cystatin C with Glycosylated Hemoglobin in Korean Adults (Diabetes Metab J 2016;40:62-9)
Yang Ho Kang
Diabetes & Metabolism Journal.2016; 40(2): 173. CrossRef
 PubReader
 Cite
Cite