
- Current
- Browse
- Collections
-
For contributors
- For Authors
- Instructions to authors
- Article processing charge
- e-submission
- For Reviewers
- Instructions for reviewers
- How to become a reviewer
- Best reviewers
- For Readers
- Readership
- Subscription
- Permission guidelines
- About
- Editorial policy
Articles
- Page Path
- HOME > Diabetes Metab J > Volume 39(3); 2015 > Article
-
Original ArticleComplications The Relationship between Anemia and the Initiation of Dialysis in Patients with Type 2 Diabetic Nephropathy
- Sun Hee Kim, Kyung Ae Lee, Heung Yong Jin, Hong Sun Baek, Tae Sun Park
-
Diabetes & Metabolism Journal 2015;39(3):240-246.
DOI: https://doi.org/10.4093/dmj.2015.39.3.240
Published online: April 22, 2015
Division of Endocrinology and Metabolism, Department of Internal Medicine, Research Institute of Clinical Medicine of Chonbuk National University-Chonbuk National University Hospital, Chonbuk National University Medical School, Jeonju, Korea.
- Corresponding author: Tae Sun Park. Division of Endocrinology and Metabolism, Department of Internal Medicine, Chonbuk National University Medical School, 20 Geonji-ro, Deokjin-gu, Jeonju 561-712, Korea. pts@jbnu.ac.kr
Copyright © 2015 Korean Diabetes Association
This is an Open Access article distributed under the terms of the Creative Commons Attribution Non-Commercial License (http://creativecommons.org/licenses/by-nc/3.0/) which permits unrestricted non-commercial use, distribution, and reproduction in any medium, provided the original work is properly cited.
ABSTRACT
-
Background
- Anemia is associated with various poor clinical outcomes in chronic kidney disease patients. The aim of this study was to investigate the relationship between anemia and the initiation degree and time of dialysis in type 2 diabetic nephropathy patients.
-
Methods
- This observational retrospective study included 130 type 2 diabetic nephropathy patients in Korea. The existence of anemia, the degree and time of dialysis initiation were reviewed. Clinical characteristics and variables were also compared.
-
Results
- The levels of hemoglobin and serum creatinine were significantly correlated with the dialysis initiation (P<0.05) during the 10-year follow-up period. Patients with anemia showed rapid decline of renal function, causing significantly more dialysis initiation (54.1% vs. 5.4%, P<0.05) compare to the patients without anemia. Average time to initiate dialysis in patients with anemia was 45.1 months (range, 8.0 to 115.8 months), which was significantly faster than that (68.3 months [range, 23.3 to 108.8 months]) in patients without anemia (P<0.01). The risk to dialysis initiation was significantly increased in patients with anemia compared to the patients without anemia (adjusted hazard ratio, 8.1; 95% confidence interval, 2.4 to 27.0; P<0.05).
-
Conclusion
- Anemia is associated with rapid decline of renal dysfunction and faster initiation of dialysis in diabetic nephropathy patients. Therefore, clinicians should pay an earlier attention to anemia during the management of diabetes.
- Diabetes, a globally common metabolic disease, has many complications. Of various complications, diabetic nephropathy increased over time is associated with mortality and morbidity in diabetes [1]. Diabetic nephropathy, previously reported to be the leading cause of chronic kidney disease (CKD) in patients starting renal replacement therapy [2], is also associated with increased cardiovascular mortality in diabetes [3]. Hypertension, proteinuria, dyslipidemia, age, gender, and serum creatinine (Cr) level have been identified as important risk factors that predict progression of kidney disease [4].
- Diabetes affects the hematological system in various ways [5]. Among them, diabetes related anemia has been observed in diabetic nephropathy patients at advanced stage [6]. Furthermore, anemia might be associated with poor clinical outcomes in CKD patients with or without diabetes. There are left ventricular hypertrophy, increased cardiovascular mortality, more rapid loss of kidney function, increased hospitalization, and poor quality of life [7]. However, anemia in patients with diabetes is unrecognized, undetected and untreated in everyday clinical practice [8].
- Anemia, associated with a more rapid decline in glomerular filtration rate (GFR), is considered to be a major risk factor for progression of renal disease in non-dialysis CKD patients [9]. Previously, anemia affected over two-thirds (68%) of CKD patients starting dialysis. From sub-analysis of the reduction of end points in NIIDM with the angiotensin II antagonist lorsartan (RENAAL) study, hemoglobin (Hb) level was an independent risk factor that predicting renal outcomes [7]. However, no study has reported the relationship between anemia and the dialysis initiation time in patients with diabetic nephropathy. Therefore, the aim of this study was to investigate the potential association of anemia with progressive diabetic nephropathy requiring dialysis. We also determined whether there was a difference between the initiation time of dialysis in diabetic patients with anemia and that without anemia.
INTRODUCTION
- This study was a retrospectively designed observational study at single center. From January 2000 to September 2002, a total of 3,120 diabetic patients visited the Chonbuk National University Hospital, South Korea. Of them, 1,711 patients were screened for microalbuminuria, and 475 patients were diagnosed with diabetic nephropathy. Patients who had related factors for anemia such as malnutrition (n=15), alcohol abuse (n=35), bleeding (n=28), hematological disease (n=18), or any malignancy (n=31) were excluded from this study. Patients who did not agree to participate in this study were also excluded (n=161). Therefore, 187 patients were enrolled in this study, with 57 patients excluded during the study follow-up because of follow-up loss (n=37), or having another disease which affected anemia such as cancer or other hematological diseases (n=4), or giving transfusion (n=9), or pregnancy (n=3) or medicating some vitamins (n=4). However, patients who had chronic illness anemia were included. Patient who showed improved renal function during follow-up period were continued in this study. Therefore, a total 130 of patients were enrolled in this study (Fig. 1). Their medical records and laboratory examinations were reviewed for 10 years from the time of enrollment. Patients were divided into two groups based on the existence of anemia. Demographic information and important medical histories were reviewed by medical records, including age, sex, race, duration of diabetes, smoking habit, body mass index, blood pressure, medications, glycosylated hemoglobin (HbA1c), Hb, low density lipoprotein (LDL), Cr, GFR, and albumin to creatinine ratio (ACR). GFR was calculated using the simplified Modification of Diet in Renal Disease formula. A written informed consent was obtained from all the patients. Studies were approved by the Chonbuk National University Hospital Institutional Review Board for research.
- Diabetes was diagnosed based on the American Diabetes Association guidelines, when a patient showed one of three criteria on two occasions: (1) symptoms of diabetes plus casual plasma glucose concentration ≥200 mg/dL (11.1 mmol/L); (2) fasting plasma glucose ≥126 mg/dL (7.0 mmol/L); or (3) 2-hour post-prandial glucose ≥200 mg/dL. Diabetic nephropathy was diagnosed by two of three microalbuminuria test positive (the degree of urinary albumin excretion such as spot urine micro-ACR ≥30 mg/g or 24-hour urine micro-ACR ≥30 mg/day). Microalbuminuria was ranged by 30 mg/g≤ACR≤300 mg/g. All participants had diabetic retinopathy before diagnosis of nephropathy. Anemia was diagnosed based on the Kidney Disease Outcomes Quality Initiative guidelines: Hb level <13.5 g/dL in males, <12.0 g/dL in females [10].
- We compared the course of renal dysfunction at each group during the 10 years using Cr according to the following intervals: baseline ~6 months, 6 months to 1 year, 1 to 1.5, 1.5 to 2, 2 to 2.5, 2.5 to 3, 3 to 5, and 5 to 10 years. Cr was measured in patients who started dialysis until the time of dialysis. Therefore, Cr was measured in a total 87 patients for 10 years. The initiation time of dialysis in each group was also reviewed and compared.
- Statistical analysis
- Continuous variables were described using mean±standard deviation or median (interquartile range [IQR]). For comparisons between groups, Student t-test was used for normally distributed variables and Mann-Whitney U test was used for variables with skewed distribution. With the Spearman correlation analysis, it was evaluated that there was a significant correlation between the variables and the initiation of dialysis. To evaluate the hazard ratio (HR) for the risk of anemia to the initiation of dialysis, Cox regression analysis was performed. Related factors (age, diabetes duration, HbA1c, blood pressure, Cr, GFR, and ACR) were adjusted. Statistical analysis was done using the SPSS version 18 (SPSS Inc., Chicago, IL, USA). Statistically significance was considered when P value was less than 0.05.
METHODS
- Baseline characteristics of patients
- Demographics of patients were summarized in Table 1. The mean age of the 130 patients was 62.7±11.9 years. The subjects consisted of 70 men (53.8%) and 60 women (46.2%). All participants were Asian. The mean HbA1c was 7.8%±1.5%. The mean Hb was 11.4±2.2 mg/dL. Baseline Cr was 1.4±0.7 mg/dL. Baseline GFR was 53.9±22.7 mL/min/1.73 m2. Baseline ACR was 350.2 mg/g (IQR, 30.5 to 1,700.0 mg/g). Participants had CKD at grade 1 (6.2%), grade 2 (37.7%), grade 3a (21.5%), grade 3b (19.2%), and grade 4 (15.4%). Of them, 38.5% patients with diabetic nephropathy were prescribed with ferrous sulfate, 28.5% patients were prescribed with erythropoietin (EPO).
- Patients were divided into two groups: patients with anemia (n=74) and patients without anemia (n=56). Baseline characteristics of the two groups were listed in Table 2. There was no significant difference in age, gender, duration of diabetes, blood pressure, baseline HbA1c, Cr, GFR, the grade of CKD, ACR, LDL, the use of angiotensin converting enzyme inhibitor or angiotensin receptor blocker, the use of insulin, or the use of antiplatelet agents between the two groups. However, there was significant difference in baseline Hb level. Baseline Hb was 10.5±1.5 mg/dL in patients with anemia, which was significantly (P<0.05) lower than that (14.3±1.4 mg/dL) in patients without anemia.
- The effect of anemia on the course of renal dysfunction in patients with diabetic nephropathy
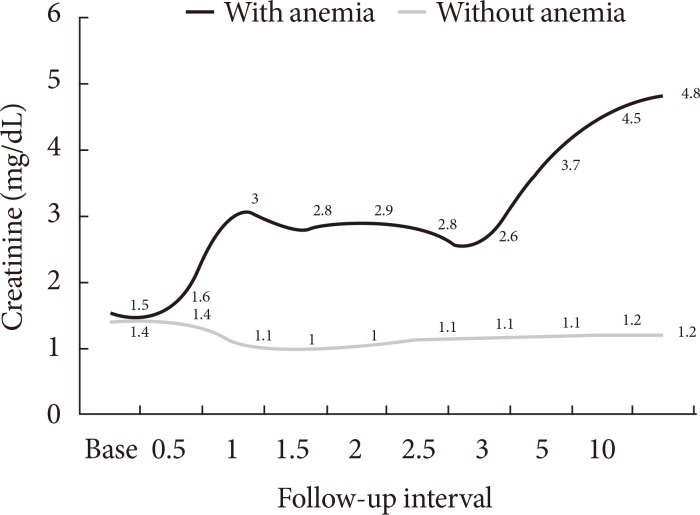
- We compared the average Cr levels in patients with diabetic nephropathy according to the time passage during the 10-year follow-up (74 patients with anemia, 56 patients without anemia) (Table 2, Fig. 2). During this study, the intensity of clinical cares including blood pressure, lipid, and HbA1c levels did not show any significant differences between the two groups (Table 2). The trend of increased Cr level was shown in the patients with anemia compared to that in patients without anemia (Fig. 2). Patients without anemia maintained relatively stable renal function compared to patients with anemia. After the 10-year follow-up periods, Cr was 4.8±1.1 mg/dL in patients with anemia group, which was significantly (P<0.05) higher than that (1.2±0.1 mg/dL) in patients without anemia. During this time period, significantly more patients with anemia (54.1%) started dialysis compared to the patients without anemia (5.4%, P<0.05) (Table 2). A total of 94.6% of patients without anemia did not start dialysis during the 10-year follow-up period. We also compared the average time to initiate dialysis between the two groups (Table 2). Average time to initiate dialysis in patients with anemia was 45.1 months (IQR, 8.0 to 115.8 months), which was significantly faster than that (68.3 months [IQR, 23.3 to 108.8 months]) in patients without anemia (P<0.01).
- The risk of anemia to the initiation of dialysis in patients with diabetic nephropathy
- We determined the correlation of variables to the dialysis initiation in patients with diabetic nephropathy. Baseline Hb (γ=-0.47, P<0.05) and Cr (γ=0.57, P<0.05) were significantly correlated with dialysis initiation in patients with diabetic nephropathy (Table 3). During the 10-year follow-up, we studied the risk of anemia to the initiation of dialysis using Cox regression analysis (Table 4). Crude HR was 7.5 (95% confidence interval [CI], 2.3 to 24.3; P<0.05). After adjusting by related variables (age, diabetes duration, HbA1c, blood pressure, Cr, GFR, and ACR), the HR was 8.1 (95% CI, 2.4 to 27.0; P<0.05).
RESULTS
- Anemia, a well known complication in CKD patients, is associated with various poor clinical outcomes such as left ventricular hypertrophy, cardiovascular morbidity, more rapid loss of kidney function, increased hospitalization, and poor quality of life [7911]. In this study, anemia is associated with rapid decline of renal dysfunction, increased need for dialysis, and the faster initiation of dialysis in patients with diabetic nephropathy.
- Anemia is common condition in CKD patients with or without diabetic nephropathy. Renal anemia is associated with a more rapid evolution to CKD 4 to 5, and a higher risk of cardiovascular events and hospitalization in nondialysis patients [9]. Previously, anemia was reported to affect annual rate of GFR decline in patients with diabetic nephropathy [12]. From the RENNAL study, Hb level was an independent risk factor that predicted renal outcomes including other factors such as proteinuria, degree of renal failure, and serum albumin [13]. In consistent with the RENNAL study, patients with anemia also showed rapid decline of renal function compared to patients without anemia in this study. Previous reports investigated the renal outcome such as doubling of Cr or end-stage renal disease (ESRD) or death [7]. We studied the effect of anemia focusing to the initiation time of dialysis in patients with diabetic nephropathy. In this study, patients with anemia showed rapid decline of renal function, which need earlier renal replacement therapy in diabetic nephropathy. The degree of dialysis initiation was also larger in patients with anemia compared to patients without anemia. Our study provided information in that it showed the course of diabetic nephropathy with or without anemia for a relatively long follow-up period.
- Previously, diabetes, hypertension, hypoalbuminemia, and chronic anemia were considered as predictive factors for the initiation of hemodialysis in CKD patients [14]. In this study, the presence of anemia affected the initiation of dialysis in patients with diabetic nephropathy. The adjusted HR was 8.1 during the 10-year follow-up. In RENNAL study, they studied the HR to ESRD according to the quartile Hb [13]. In Hb <11.3 group, the adjusted HR was 1.99 during a 3.4-year follow-up. Different HRs between our study and the RENNAL study could be due to different study design, and different ethnicity of patients. Anemia is associated with renal insufficiency. The exact mechanisms that anemia might influence progression of kidney disease are currently unknown. Some reports suggest that anemia is due to hypoxia which increases oxidative stress, thus enhancing tissue injury [15]. Renal hypoxia is known to stimulate cytokines such as hypoxia inducing factor-1, which contributes to renal scaring [16]. Others suggest that anemia associates with cardiovascular system. Changes in cardiac function can potentially affect renal vasculature [17].
- We enrolled the diabetic nephropathy patients and divided them based on anemia existence (excluding macrocytic anemia subtype, because metformim also affect macrocytic anemia). There was a big difference in Hb level (14.3 mg/dL in patients without anemia, 10.5 mg/dL in patients with anemia) in this study. However, we could not find the cause of such a difference in Hb level in this study because this study was retrospectively designed study with the aim to know the effect of anemia to the dialysis renal outcome. Previously, patients with renal dysfunction caused anemia by various factors, such as iron or EPO deficiency, hyporesponsiveness to the action of EPO, bleeding diathesis, hyperparathyroidism with consequent bone marrow fibrosis, and chronic inflammation [18]. In this study, patients with anemia included 54.1% of microcytic anemia and 45.9% of normocytic anemia. We could not check other related factors. Therefore, further studies considering other related factors are merited.
- There are several limitations of the current study. Firstly, it had a relatively small number of participants with a retrospectively designed single center study. Additionally, we did not check the exact mechanisms of anemia to the renal outcome. Therefore, studies supplementing these limitations are needed in near future.
- In conclusion, anemia is associated with aggravation of renal function and increased ratio of renal replacement therapy in patients with diabetic nephropathy. In addition, the average initiation time of dialysis was faster in patients with anemia compared to patients without anemia. Therefore, clinicians should pay an early attention to anemia during the management of patients with diabetic nephropathy. Further large scale multicenter studies are warranted to examine the clinical meanings of the relationship of anemia and initiation of dialysis in patients with type 2 diabetic nephropathy.
DISCUSSION
-
CONFLICTS OF INTEREST: No potential conflict of interest relevant to this article was reported.
NOTES
- 1. Mogensen CE. Microalbuminuria predicts clinical proteinuria and early mortality in maturity-onset diabetes. N Engl J Med 1984;310:356-360. ArticlePubMed
- 2. USRDS: the United States Renal Data System. Am J Kidney Dis 2003;42(6 Suppl 5):1-230.Article
- 3. Valmadrid CT, Klein R, Moss SE, Klein BE. The risk of cardiovascular disease mortality associated with microalbuminuria and gross proteinuria in persons with older-onset diabetes mellitus. Arch Intern Med 2000;160:1093-1100. ArticlePubMed
- 4. Peterson JC, Adler S, Burkart JM, Greene T, Hebert LA, Hunsicker LG, King AJ, Klahr S, Massry SG, Seifter JL. Blood pressure control, proteinuria, and the progression of renal disease. The Modification of Diet in Renal Disease Study. Ann Intern Med 1995;123:754-762. ArticlePubMed
- 5. Jones RL, Peterson CM. Hematologic alterations in diabetes mellitus. Am J Med 1981;70:339-352. ArticlePubMed
- 6. Jones SC, Smith D, Nag S, Bilous MT, Winship S, Wood A, Bilous RW. Prevalence and nature of anaemia in a prospective, population-based sample of people with diabetes: Teesside anaemia in diabetes (TAD) study. Diabet Med 2010;27:655-659. ArticlePubMed
- 7. Keane WF, Brenner BM, de Zeeuw D, Grunfeld JP, McGill J, Mitch WE, Ribeiro AB, Shahinfar S, Simpson RL, Snapinn SM, Toto R. RENAAL Study Investigators. The risk of developing end-stage renal disease in patients with type 2 diabetes and nephropathy: the RENAAL study. Kidney Int 2003;63:1499-1507. ArticlePubMed
- 8. Stevens PE, O'Donoghue DJ, Lameire NR. Anaemia in patients with diabetes: unrecognised, undetected and untreated? Curr Med Res Opin 2003;19:395-401. ArticlePubMed
- 9. Portoles J, Gorriz JL, Rubio E, de Alvaro F, Garcia F, Alvarez-Chivas V, Aranda P, Martinez-Castelao A. NADIR-3 Study Group. The development of anemia is associated to poor prognosis in NKF/KDOQI stage 3 chronic kidney disease. BMC Nephrol 2013;14:2ArticlePubMedPMCPDF
- 10. National Kidney Foundation. KDOQI Clinical Practice Guideline for Diabetes and CKD: 2012 update. Am J Kidney Dis 2012;60:850-886. ArticlePubMed
- 11. Ma JZ, Ebben J, Xia H, Collins AJ. Hematocrit level and associated mortality in hemodialysis patients. J Am Soc Nephrol 1999;10:610-619. ArticlePubMed
- 12. Unsal A, Koc Y, Basturk T, Akgun AO, Sakaci T, Ahbap E. Risk factors for progression of renal disease in patient with diabetic nephropathy. Eur Rev Med Pharmacol Sci 2012;16:878-883. PubMed
- 13. Mohanram A, Zhang Z, Shahinfar S, Keane WF, Brenner BM, Toto RD. Anemia and end-stage renal disease in patients with type 2 diabetes and nephropathy. Kidney Int 2004;66:1131-1138. ArticlePubMed
- 14. Valdivia J, Gutierrez C, Treto J, Delgado E, Mendez D, Fernandez I, Abdo A, Perez L, Forte M, Rodriguez Y. Prognostic factors in hemodialysis patients: experience of a Havana hospital. MEDICC Rev 2013;15:11-15.
- 15. Fine LG, Bandyopadhay D, Norman JT. Is there a common mechanism for the progression of different types of renal diseases other than proteinuria? Towards the unifying theme of chronic hypoxia. Kidney Int Suppl 2000;75:S22-S26. ArticlePubMed
- 16. Rosenberger C, Mandriota S, Jurgensen JS, Wiesener MS, Horstrup JH, Frei U, Ratcliffe PJ, Maxwell PH, Bachmann S, Eckardt KU. Expression of hypoxia-inducible factor-1alpha and -2alpha in hypoxic and ischemic rat kidneys. J Am Soc Nephrol 2002;13:1721-1732. PubMed
- 17. Silverberg DS, Wexler D, Blum M, Keren G, Sheps D, Leibovitch E, Brosh D, Laniado S, Schwartz D, Yachnin T, Shapira I, Gavish D, Baruch R, Koifman B, Kaplan C, Steinbruch S, Iaina A. The use of subcutaneous erythropoietin and intravenous iron for the treatment of the anemia of severe, resistant congestive heart failure improves cardiac and renal function and functional cardiac class, and markedly reduces hospitalizations. J Am Coll Cardiol 2000;35:1737-1744. ArticlePubMed
- 18. Ritz E. Anemia and diabetic nephropathy. Curr Diab Rep 2006;6:469-472. ArticlePubMedPDF
REFERENCES

The changes of renal function in type 2 diabetic nephropathy patients with or without anemia. X-axis: follow-up intervals (yr), Y-axis: Cr during each follow-up.
Baseline characteristics of type 2 diabetes patients with nephropathy
Values are presented as mean±standard deviation, number (%), or median (interquartile range).
HbA1c, glycosylated hemoglobin; GFR, glomerular filtration rate; CKD, chronic kidney disease; ACR, albumin to creatinine ratio; LDL, low density lipoprotein; ACEi, angiotensin converting enzyme inhibitor; ARB, angiotensin receptor blocker.
Clinical characteristics of patients with anemia or without anemia
Values are presented as mean±standard deviation, number (%), or median (interquartile range).
HbA1c, glycosylated hemoglobin; GFR, glomerular filtration rate; CKD, chronic kidney disease; ACR, albumin to creatinine ratio; LDL, low density lipoprotein; ACEi, angiotensin converting enzyme inhibitor; ARB, angiotensin receptor blocker.
The correlation of variables to the initiation of dialysis in patients with type 2 diabetic nephropathy
Figure & Data
References
Citations
- Microalbuminuria as the Tip of Iceberg in Type 2 Diabetes Mellitus: Prevalence, Risk Factors, and Associated Diabetic Complications
Sohaib Asghar, Shoaib Asghar, Tayyab Mahmood, Syed Muhammad Hassan Bukhari, Muhammad Habib Mumtaz, Ali Rasheed
Cureus.2023;[Epub] CrossRef - The Association between Serum Hemoglobin and Renal Prognosis of IgA Nephropathy
Tae Ryom Oh, Su Hyun Song, Hong Sang Choi, Chang Seong Kim, Seung Hyeok Han, Kyung Pyo Kang, Young Joo Kwon, Soo Wan Kim, Seong Kwon Ma, Eun Hui Bae
Journal of Clinical Medicine.2021; 10(2): 363. CrossRef - Prevalence of anemia in diabetic adult outpatients in Northeast Ethiopia
Temesgen Fiseha, Aderaw Adamu, Melkam Tesfaye, Angesom Gebreweld, Jennifer A. Hirst
PLOS ONE.2019; 14(9): e0222111. CrossRef - Targeted Clinical Metabolite Profiling Platform for the Stratification of Diabetic Patients
Ahonen, Jäntti, Suvitaival, Theilade, Risz, Kostiainen, Rossing, Orešič, Hyötyläinen
Metabolites.2019; 9(9): 184. CrossRef - Effect of high density lipoprotein cholesterol on the relationship of serum iron and hemoglobin with kidney function in diabetes
Ashley N. Williams, Baqiyyah N. Conway
Journal of Diabetes and its Complications.2017; 31(6): 958. CrossRef
 PubReader
 Cite
Cite


