Normal Glucose Tolerance with a High 1-Hour Postload Plasma Glucose Level Exhibits Decreased β-Cell Function Similar to Impaired Glucose Tolerance
Article information
Abstract
Background
Subjects with normal glucose tolerance (NGT) who have a high 1-hour postload plasma glucose level (≥155 mg/dL; NGT 1 hour-high) have been shown to be at higher risk for type 2 diabetes than subjects with NGT 1 hour-low postload plasma glucose level (<155 mg/dL). We compared β-cell function in subjects with NGT 1 hour-high, NGT 1 hour-low, and impaired glucose tolerance (IGT).
Methods
We classified subjects into NGT 1 hour-low (n=149), NGT 1 hour-high (n=43), and IGT (n=52). The β-cell function was assessed based on insulinogenic index (IGI), oral disposition index (DI), and insulin secretion-sensitivity index-2 (ISSI-2).
Results
Insulin sensitivity was comparable between the subjects with NGT 1 hour-high and NGT 1 hour-low. The β-cell function with/without adjusting insulin sensitivity was significantly different among the three groups. The IGI (pmol/mmol) was 116.8±107.3 vs. 64.8±47.8 vs. 65.8±80.6 (P=0.141), oral DI was 3.5±4.2 vs. 1.8±1.4 vs. 1.8±3.1 (P<0.001), and ISSI-2 was 301.2±113.7 vs. 213.2±67.3 vs. 172.5±87.5 (P<0.001) in NGT 1 hour-low, NGT 1 hour-high, and IGT, respectively. Post hoc analyses revealed that oral DI and ISSI-2 were significantly different between NGT 1 hour-low and NGT 1 hour-high but comparable between NGT 1 hour-high and IGT.
Conclusion
Among Korean subjects with NGT, those who have a higher 1-hour postload glucose level have a compromised insulin-sensitivity adjusted β-cell function to a similar degree as IGT subjects.
INTRODUCTION
The prevalence of diabetes is increasing with a changing lifestyle including increased calorie intake and decreased physical activity. Therefore, we have experienced a significant increase in the prevalence of diabetes over the past 40 years in Korea. The prevalence of diabetes was estimated to be 1.5% in the early 1970s, but is currently estimated to be as high as 10% in the adult Korean population [1]. In a 2-year follow-up study conducted in Yonchon county, which included 1,193 subjects without diabetes at baseline, the fasting plasma proinsulin level was a predictor of incident type 2 diabetes whereas the fasting plasma insulin levels was not [2]. This indicates that β-cell dysfunction rather than insulin resistance is a marker for increased risk of developing type 2 diabetes in non-diabetic Korean adults. In addition, a community cohort study conducted in the Mokdong area in Seoul reported that nondiabetic offspring of diabetic patients showed decreased acute insulin response but comparable insulin sensitivity relative to the matched nondiabetic controls without family history of diabetes [3]. Therefore, nondiabetic subjects with decreased β-cell capacity may have an increased risk of developing type 2 diabetes in Korea, which has been reproducibly reported in recent studies performed in Korea [4,5]. In line with this notion, genetic susceptibility to type 2 diabetes is largely related to the polymorphisms in the genes accountable for pancreatic β-cell function in Asians including Koreans [6,7].
In general, impaired fasting glucose (IFG) and impaired glucose tolerance (IGT) are regarded as indicating prediabetes [8], implying that these conditions are closely related to diabetes in a dysglycemia continuum. However, some subjects with normal glucose tolerance (NGT) may have an increased risk of type 2 diabetes. In the Baltimore Longitudinal Study of Aging [9], most NGT subjects who developed type 2 diabetes turned to IFG and/or IGT during the follow-up. However, a small proportion of NGT subjects (2.5%) progressed directly to diabetes without documented abnormalities in the oral glucose tolerance test (OGTT), which was performed biennially for up to 20 years [9]. Moreover, in a study with 74,309 person-years of follow-up, which was performed by the Israel Defense Forces, NGT subjects with relatively high fasting plasma glucose (FPG) levels (i.e., 87 to 99 mg/dL) were at a progressively increased risk for developing diabetes compared with NGT subjects with relatively low FPG levels (i.e., <81 mg/dL) [10]. Taken together, it is necessary to develop an effective way to identify individuals with an increased risk of future diabetes although they belong to the NGT category.
It has been known that subjects with NGT are heterogeneous with regard to β-cell function and insulin sensitivity [11]. Recently, a subgroup of NGT was suggested by measuring 1-hour postload plasma glucose levels during 75 g OGTTs [12,13,14]. During the 7 to 8 years of follow-up, 8% to 15% of subjects with NGT who had a 1-hour postload plasma glucose level ≥155 mg/dL (NGT 1 hour-high) at baseline developed type 2 diabetes, whereas only 1% to 3% of subjects with NGT who had a 1-hour postload plasma glucose level <155 mg/dL (NGT 1 hour-low) developed type 2 diabetes [13,14]. The cutoff 1-hour postload plasma glucose level of 155 mg/dL exhibited 75% sensitivity and 79% specificity for predicting type 2 diabetes [12]. Furthermore, 1 hour plasma glucose levels had a stronger correlation with insulin secretion and sensitivity indices than FPG or 2 hours plasma glucose levels [12,13]. Therefore, 1-hour plasma glucose levels could be an appropriate parameter for categorizing subjects with NGT who are at risk of developing type 2 diabetes. Although, compared with Caucasian or African counterparts, East Asians have distinct characteristics in glucose metabolism with higher insulin sensitivity and lower insulin secretory capacity across all glucose tolerance categories encompassing NGT, IFG/IGT, and type 2 diabetes [15], the clinical significance of the NGT 1 hour-high status has not yet been explored. Therefore, we compared metabolic characteristics of NGT 1 hour-high, NGT 1 hour-low, and IGT in Korean populations.
METHODS
The study protocol was approved by the Institutional Review Board at Seoul National University Hospital (registration number: H-1402-006-557). We recruited subjects aged 30 to 80 years by local advertisement. Subjects taking medications for diabetes, hypertension, hyperlipidemia, or obesity as well as pregnant women were excluded. Of the 280 subjects who were screened by means of the standard 75 g OGTT, 192 subjects with NGT, and 52 subjects with IGT were finally included in this study. For the OGTTs, subjects were asked to fast overnight. First, height, body weight, waist and hip circumferences, and systolic and diastolic blood pressures were measured. Then, fasting blood samples were drawn for the measurement of plasma concentrations of glucose, hemoglobin A1c, insulin, C-peptide, total cholesterol, triglyceride, low density lipoprotein cholesterol (LDL-C), and high density lipoprotein cholesterol (HDL-C). After a 75 g oral glucose load, blood samples were drawn at 30, 60, 90, and 120 minutes to measure plasma levels of glucose and insulin. Informed consent was obtained from all participants prior to any research procedures.
According to 1-hour postload plasma glucose levels, the subjects with NGT were divided into the following two groups: 149 subjects with NGT 1 hour-low (<155 mg/dL) and 43 subjects with NGT 1 hour-high (≥155 mg/dL). The homeostasis model assessment of insulin resistance (HOMA-IR) and pancreatic β-cell function (HOMA-β) were calculated by plasma insulin (µU/mL)×plasma glucose (mmol/L)/22.5, and plasma insulin (µU/mL]×20/(plasma glucose [mmol/L]-3.5), respectively [16]. The insulinogenic index (IGI; pmol/mmol) at 30 or 60 minutes was calculated by (insulin at 30 minutes-insulin at 0 minute)/(glucose at 30 minutes-glucose at 0 minute) and (insulin at 60 minutes-insulin at 0 minute)/(glucose at 60 minutes-glucose at 0 minute), respectively [17]. The oral disposition index (DI) was calculated by IGI×1/fasting insulin [18]. The Matsuda index was calculated by 10,000/√(fasting glucose×fasting insulin ×mean glucose×mean insulin) [19]. The area under the curve (AUC) was calculated by the trapezoidal rule. The insulin secretion-sensitivity index-2 (ISSI-2) was defined as AUCinsulin/AUCglucose×Matsuda index [20].
Statistical analyses
The data analysis was performed using SPSS version 21.0 (IBM Co., Armonk, NY, USA). Values are presented as mean ± standard deviation. The chi-square test was adopted to compare the sex distribution. Parameters that were not normally distributed were log transformed before analysis. One-way analysis of variance followed by Games-Howell post hoc test was used to compare the clinical and biochemical parameters. Next, an analysis of covariance (ANCOVA) test was used to adjust the effect of sex and body mass index (BMI). Sex-adjusted partial correlation tests were used to evaluate the correlations between parameters. A P value of less than 0.05 was considered statistically significant.
RESULTS
Table 1 shows the clinical and biochemical characteristics of the study subjects. Age was comparable between the three groups, but more female subjects were included in the NGT 1 hour-low group. In addition, BMI was also different among the three groups. Accordingly, we analyzed the data with adjustment of sex and BMI. FPG levels were 85.6 ±6.0, 89.1±6.8, 93.7±12.5 mg/dL in the NGT 1 hour-low group, the NGT 1 hour-high group, and the IGT group, respectively (P<0.001, with or without sex and BMI adjustment). One-hour postload plasma glucose levels were 115.3±23.7, 182.6±22.8, 195.2±34.8 mg/dL in the NGT 1 hour-low group, the NGT 1 hour-high group, and the IGT group, respectively (P<0.001, with or without sex and BMI adjustment) and post hoc analysis revealed that 1-hour plasma glucose was significantly different between the NGT 1 hour-low and the NGT 1 hour-high groups. Fasting C-peptide levels were gradually increased from the NGT 1 hour-low group to the IGT group (1.5±0.5, 1.6±0.8, and 1.9±0.9 ng/mL, P=0.031 and P=0.126 without and with sex and BMI adjustment, respectively). Triglyceride levels were significantly different among groups, but they were comparable after sex and BMI adjustment.
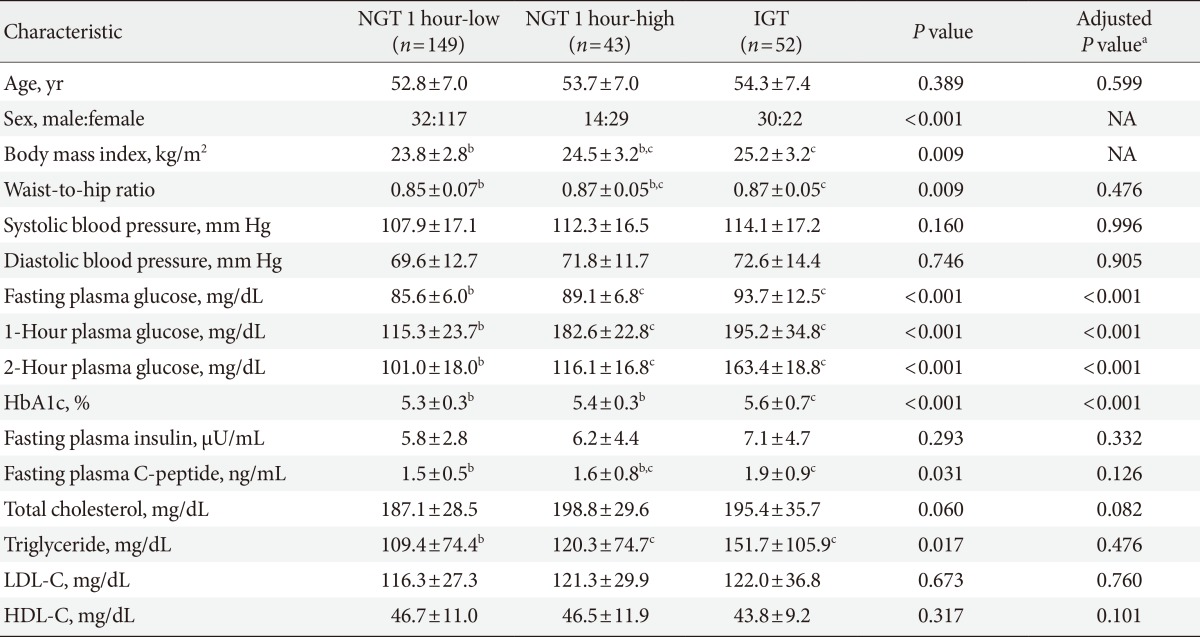
Clinical and biochemical characteristics of study subjects
Parameters of β-cell function, insulin resistance (or insulin sensitivity), and β-cell function adjusted by insulin resistance are presented in Table 2. Insulin secretory function assessed by IGI at 30 or 60 minutes was not significantly different among groups. Both HOMA-β-cell and HOMA-IR values were comparable among the three groups (Table 2). The Matsuda index was significantly different among groups, but the post hoc analysis revealed that the difference was comparable between the NGT 1 hour-low group and the NGT 1 hour-high group (Table 2). The oral DI and the ISSI-2, which represent β-cell function with adjustment for insulin resistance, were significantly different among the three groups. The post hoc test showed that oral DI and ISSI-2 were significantly different between the NGT 1 hour-low group and the NGT 1 hour-high group (Table 2).
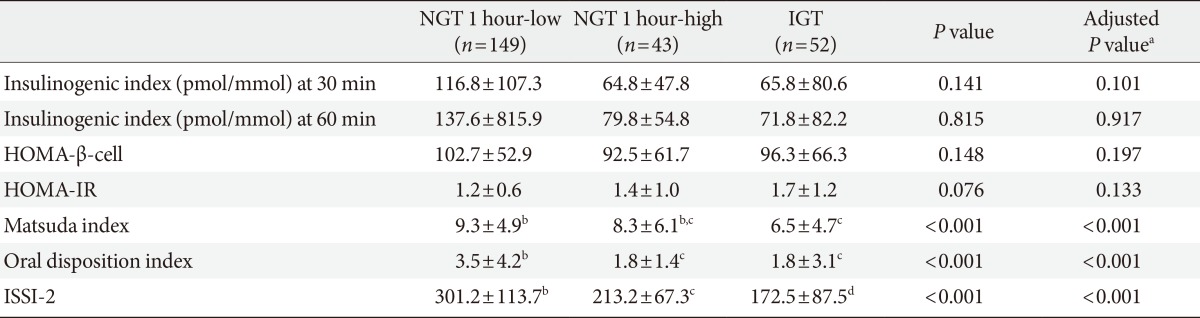
Parameters of β-cell function, insulin resistance (or insulin sensitivity) and β-cell function adjusted by insulin resistance
Table 3 shows the sex-adjusted partial correlation coefficients between clinical/metabolic parameters and either the FPG levels, 1-hour postload plasma glucose levels, and 2-hour postload plasma glucose levels. In general, the patterns of correlation appeared to be similar among three glycemic parameters such as fasting, 1-hour postload, and 2-hour postload plasma glucose levels. The 1-hour postload glucose level exhibited a significant correlation with all of the clinical/metabolic parameters except IGI at 60 minutes, HOMA-β-cell, blood pressure, and HDL-C.
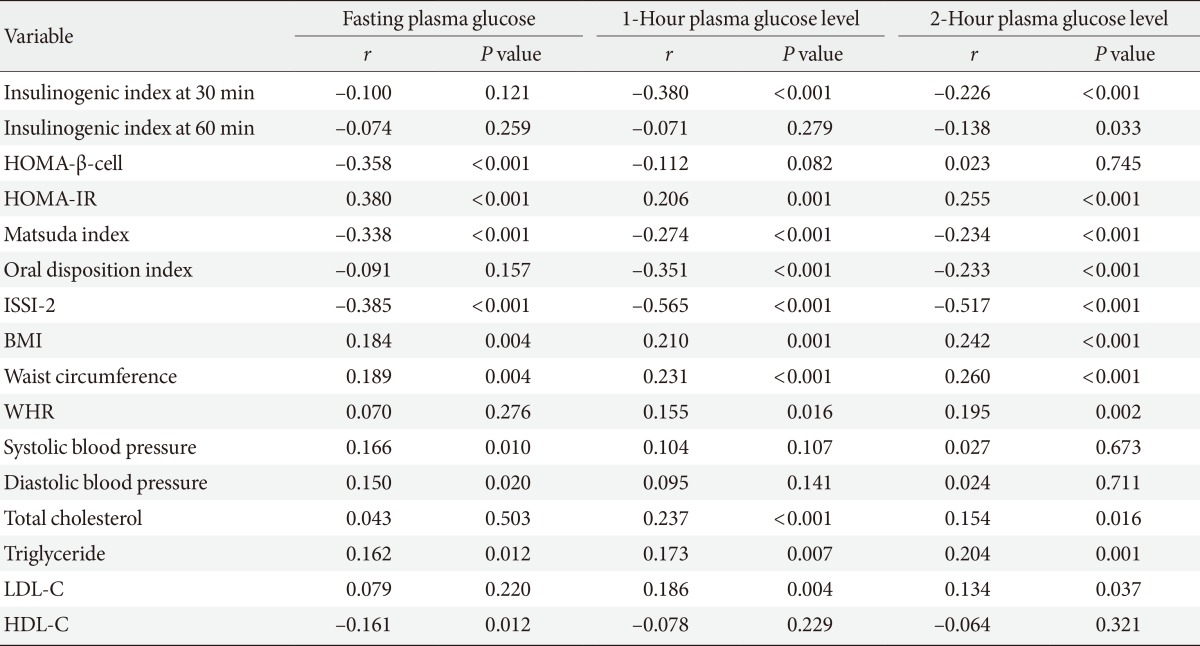
Sex-adjusted partial correlation between plasma glucose levels and biochemical parameters or cardiovascular risk profiles
DISCUSSION
In this study, β-cell function, insulin resistance (or insulin sensitivity) and indices of insulin secretion adjusted by the degree of insulin resistance were similar between the NGT 1 hour-high group and the IGT group. However, between the NGT 1 hour-low and the NGT 1 hour-high groups, there was a distinct difference in β-cell function adjusted by insulin sensitivity such as oral DI and ISSI-2 with comparable insulin sensitivity. In other words, subjects with NGT can be divided into two discrete groups based on β-cell function even in the Korean population.
In Caucasians, the NGT 1 hour-high group exhibited both decreased β-cell function and reduced insulin sensitivity compared to the NGT 1 hour-low group [21]. In contrast, the NGT 1 hour-high group in this study showed impaired β-cell function with relatively preserved insulin sensitivity relative to the NGT 1 hour-low group. Because the sample size of our current study was relatively small, we may not have been able to detect a difference in insulin sensitivity between the NGT 1-hour high/low groups. However, there is evidence for the dissociation in β-cell function and insulin sensitivity in Korean subjects with a high risk for type 2 diabetes. For example, impaired β-cell function assessed by fasting plasma proinsulin levels [2], acute insulin response during the frequently sampled intravenous glucose tolerance test [3], and IGI measured during the OGTT [22] was significantly associated with the clinical characteristics of subjects who developed type 2 diabetes in 2 years, subjects who were offspring of diabetic patients, and subjects with earlier stages of glucose intolerance, respectively. However, indices for insulin sensitivity did not show any statistical association with regard to the conditions listed above [2,3,22]. Taken together, the NGT 1-hour high group may represent a unique group of subjects with impaired β-cell function that have an increased risk of future type 2 diabetes in Koreans.
Elevated 1-hour plasma glucose levels have been reported to be related with an increase in cardiovascular risk [23,24]. The NGT 1-hour high group had a higher systolic blood pressure [23], higher LDL-C and triglyceride levels, lower HDL-C levels [24], and higher pulse wave velocity [23] than the NGT 1 hour-low group. In addition, 1-hour plasma glucose levels were significantly correlated with brachial-ankle pulse wave velocity [25] and carotid intima-media thickness [26]. We also observed that 1-hour plasma glucose levels exhibited significant correlation with BMI, waist circumference, WHR, and total and LDL-C levels. Therefore, 1-hour plasma glucose levels could be a useful marker for cardiovascular disease in Koreans, which needs to be explored in future studies.
To our knowledge, this is the first study examining the relationship between 1-hour plasma glucose levels with insulin secretory function in East Asian populations. However, because of the cross-sectional nature of this study, we cannot conclude whether the NGT 1 hour-high group has a higher risk for developing diabetes. The relatively small sample size, possible selection bias by recruiting subjects using local advertisement, and unequal sex distribution may limit the generalization of our results. In addition, we were unable to see the effect of different genetic makeup on insulin secretory function and insulin sensitivity. Importantly, this study was not designed to identify a cutoff of the 1-hour plasma glucose level, which predicts future development of prediabetes or diabetes in Koreans. However, there is a growing body of evidence supporting that the cutoff value for 1-hour plasma glucose level of 155 mg/dL might be universally implicated in predicting the risk for diabetes regardless of ethnic background. From the data of Asian Indians, diabetes and prediabetes were more prevalent in subjects with higher 1-hour plasma glucose levels during the 13 years of follow-up [27]. In other population with obese Latino youth with a family history of type 2 diabetes [28] and Finnish businessman [29], 1-hour plasma glucose levels also showed high prediction power of β-cell deterioration and development of diabetes over 8 years of follow-up and 34 years of follow-up, respectively. Although we do not know if the cutoff of 155 mg/dL is optimal for Koreans, this cutoff successfully differentiated two metabolically different groups in this study. Nevertheless, future longitudinal studies are necessary to investigate the predictive power of the 1-hour postload plasma glucose level for the development of type 2 diabetes in Koreans.
In conclusion, subjects with NGT can be further categorized by postload 1-hour plasma glucose levels with a cutoff of 155 mg/dL. The NGT 1-hour high group may represent a distinct group with impaired β-cell function adjusted by insulin sensitivity at a degree similar to the IGT group. Measurement of postload 1-hour plasma glucose levels during an OGTT would be useful in counseling patients at risk for developing type 2 diabetes. Now, it is the time to revisit the OGTT data from longitudinal cohorts in Korea with specific regard to the postload 1-hour plasma glucose level. Furthermore, prospective studies are necessary to examine the role of the postload 1-hour plasma glucose level in predicting the risk for developing type 2 diabetes and cardiovascular disease in Koreans.
Notes
CONFLICTS OF INTEREST: No potential conflict of interest relevant to this article was reported.