- Current
- Browse
- Collections
-
For contributors
- For Authors
- Instructions to authors
- Article processing charge
- e-submission
- For Reviewers
- Instructions for reviewers
- How to become a reviewer
- Best reviewers
- For Readers
- Readership
- Subscription
- Permission guidelines
- About
- Editorial policy
Articles
- Page Path
- HOME > Diabetes Metab J > Volume 39(2); 2015 > Article
-
Original ArticleEpidemiology The Insulin Resistance but Not the Insulin Secretion Parameters Have Changed in the Korean Population during the Last Decade
- Hae Kyung Yang1,2, Jin Hee Lee3, In-Young Choi4, Hyuk Sang Kwon1,5, Jeong Ah Shin1,2, Seung Hee Jeong6, Seung-Hwan Lee1,2, Jae Hyoung Cho1,2, Ho Young Son1,2, Kun Ho Yoon1,2
-
Diabetes & Metabolism Journal 2015;39(2):117-125.
DOI: https://doi.org/10.4093/dmj.2015.39.2.117
Published online: April 20, 2015
1Department of Internal Medicine, College of Medicine, The Catholic University of Korea, Seoul, Korea.
2Division of Endocrinology and Metabolism, Department of Internal Medicine, Seoul St. Mary's Hospital, College of Medicine, The Catholic University of Korea, Seoul, Korea.
3Catholic Institute of U-Healthcare, The Catholic University of Korea, Seoul, Korea.
4Graduate School of Healthcare Management and Policy, The Catholic University of Korea, Seoul, Korea.
5Division of Endocrinology and Metabolism, Department of Internal Medicine, Yeouido St. Mary's Hospital, College of Medicine, The Catholic University of Korea, Seoul, Korea.
6Clinical Research Coordinating Center, College of Medicine, The Catholic University of Korea, Seoul, Korea.
- Corresponding author: Kun-Ho Yoon. Division of Endocrinology and Metabolism, Department of Internal Medicine, Seoul St. Mary's Hospital, College of Medicine, The Catholic University of Korea, 222 Banpo-daero, Seocho-gu, Seoul 137-701, Korea. yoonk@catholic.ac.kr
- *Hae Kyung Yang and Jin Hee Lee contributed equally to this study as first authors.
Copyright © 2015 Korean Diabetes Association
This is an Open Access article distributed under the terms of the Creative Commons Attribution Non-Commercial License (http://creativecommons.org/licenses/by-nc/3.0/) which permits unrestricted non-commercial use, distribution, and reproduction in any medium, provided the original work is properly cited.
ABSTRACT
-
Background
- This study aimed to compare the patterns of insulin secretion and resistance between Korean subjects in the 1990s and 2000s.
-
Methods
- Insulin secretion and resistance indices were calculated from subjects who underwent 75-g oral glucose tolerance tests in the year 1997 to 1999 and 2007 to 2011 at the Seoul St. Mary's Hospital, Korea.
-
Results
- A total of 578 subjects from the 1990s (mean age, 48.5 years) and 504 subjects from the 2000s (mean age, 50.2 years) were enrolled. Compared with the subjects from the 1990s, those from the 2000s exhibited increased insulin resistance (increased homeostatic model assessment for insulin resistance), and reduced insulin sensitivity (reduced Matsuda index and quantitative insulin sensitivity check index), regardless of their glucose tolerance status. However, insulinogenic index did not reveal significant differences between the 2 decades in subjects with or without diabetes. A distinct relationship was confirmed between Matsuda index and total area under the curve (insulin/glucose) in each glucose tolerance group. The mean product of the Matsuda index and the total area under the curve (insulin/glucose) as well as the oral disposition index, was lower in subjects with normal glucose tolerance from the 2000s than in those from the 1990s.
-
Conclusion
- After rapid economic growth and changes in lifestyle patterns, insulin resistance has worsened across the glucose tolerance status; however, the insulin secretory function remained unchanged, which resulted in an increase in the susceptibility to the development of type 2 diabetes mellitus among Korean subjects without diabetes. We could not rule out the potential selection bias and therefore, further studies in general Korean population are needed.
- Type 2 diabetes mellitus (T2DM) in Asia differs in several aspects from that in Western countries [1]. The clinical characteristics of Asian T2DM include a rapid increase in the prevalence of diabetes during a relatively short period of time and early disease onset with a lesser degree of obesity relative to that observed in Western countries [2]. Pathophysiological differences in insulin secretion and resistance, including pronounced dysfunction in early-phase insulin secretion with a lower degree of compensatory insulin secretion, have been suggested as explanations for the ethnic differences [3,4]. Additionally, the β-cell mass is known to correlate with the body mass index (BMI) in subjects with and without diabetes in Korea [5], and a similar trend was observed in European subjects [6]. This finding suggests limited amount of β-cell masses in Asian subjects with relatively low BMI compared to those in Western countries. However, the recent socioeconomic transition in Asian countries has led to an increased prevalence of obesity [7].
- There have been several decades of impoverishment during the history of Korea, including the Japanese Colonial Period (1910 to 1945) and the Korean War (1950 to 1953). Despite being considered among the poorest countries in the 1950s, South Korea has currently accomplished remarkable economic development. Rapid economic improvements and modernization during the past 50 years have led to increased epidemics of obesity and dyslipidemia, and an increased prevalence of diabetes along with diabetes-related mortality [8]. However, it is unknown whether changes in β-cell function have occurred in response to environmental changes. A Westernized lifestyle, increased social stresses and increased prevalence of obesity could have affected β-cell functioning and insulin resistance, eventually leading to the altered nature of diabetes and pre-diabetes observed in the Korean population. The thrifty phenotype hypothesis proposes that fetal malnutrition might induce metabolic adaptations in order to maintain nutrient supply to vital organs (such as the brain) at the expense of other organs (such as the pancreas) and might result in the subsequent development of T2DM and metabolic syndrome [9]. Individuals of the Korean population who were born during periods of impoverishment might have acquired this thrifty phenotype; similarly, a Dutch Hunger Winter study showed that prenatal exposure to famine correlated with reduced glucose tolerance in adults [10]. However, in individuals born during periods of economic development, improved nutrition should have improved the insulin secretory function of pancreatic β-cell and insulin sensitivity of target organs.
- Therefore, this study aimed to assess the differences in insulin secretion and resistance between subjects in the Korean population who were evaluated during the 1990s and 2000s according to their glucose tolerance status and BMI.
INTRODUCTION
- Study population
- Subjects who underwent a 75-g oral glucose tolerance test (OGTT) between January 1997 and December 1999 and between January 2007 and December 2011 were enrolled at the Seoul St. Mary's Hospital, Korea. All the subjects were Korean men and women aged 19 to 80 years. Subjects with T1DM, active infection or inflammation, malignancy, impaired liver or renal function (alanine aminotransferase levels >2-fold above the upper limit of the normal range, a serum creatinine level >133 µmol/L, or a glomerular filtration rate <60 mL/min), pregnancy, or steroid use were excluded from the study. Patients with T2DM who were using oral hypoglycemic agents or insulin therapy were also excluded unless they had stopped using oral hypoglycemic agent or insulin for at least 3 months.
- Glucose tolerance classification
- According to the 2011 American Diabetes Association criteria [11], the subjects were categorized as having normal glucose tolerance (NGT; a fasting plasma glucose level <5.6 mmol/L and a 2-hour plasma glucose level <7.8 mmol/L), pre-diabetes mellitus (pre-DM; either impaired fasting glucose [defined as a fasting plasma glucose level of 5.6 to 6.9 mmol/L and a 2-hour plasma glucose level <7.8 mmol/L] and/or impaired glucose tolerance [defined as a fasting plasma glucose <5.6 mmol/L and a 2-hour plasma glucose of 7.8 to 11.0]), or DM (defined as a fasting plasma glucose level ≥7.0 mmol/L, a 2-hour plasma glucose level ≥11.1 mmol/L and/or a hemoglobin A1c level ≥6.5%).
- Explanatory variables
- All subjects underwent the 75-g OGTT after 12 hours of overnight fasting. Glucose and insulin levels were obtained during the 75-g OGTT from samples collected at 0, 30, 60, 90, and 120-minute. Plasma glucose levels were measured by using the hexokinase method, and insulin was measured using radioimmunoassay kit (Dainabot, Tokyo, Japan) in the hospital laboratory. We calculated several indices to measure insulin resistance and insulin secretion. The Matsuda index of insulin sensitivity was calculated as follows: 10,000/√(FPG×fasting insulin×mean of glucose during OGTT×mean of insulin during OGTT). The quantitative insulin sensitivity check index (QUICKI) and homeostatic model assessment for insulin resistance (HOMA-IR) were calculated by using the fasting insulin and fasting glucose levels. The total area under the curve (insulin/glucose) (total AUC [I/G]) was calculated by using the trapezoid method. The insulinogenic index was calculated as the early-phase insulin response relative to the glucose stimulus during OGTT as follows: (insulin at 30 minutes during OGTT-fasting insulin)/(plasma glucose at 30 minutes during OGTT-fasting plasma glucose). The oral disposition index was calculated as the combination of the insulinogenic index and 1/fasting insulin level.
- As a measure of insulin secretion, the insulinogenic index was shown to correlate strongly with the acute insulin response on the intravenous glucose tolerance test [12], and has been used as an early-phase insulin secretion index in clinical studies [13]. The Matsuda index correlates with the whole-body glucose disposal rate during the euglycemic insulin clamp, and therefore provides a reasonable approximation of whole-body insulin sensitivity during the OGTT. The total AUC (I/G) during the 75-g OGTT has been used as a measurement of total insulin secretion [13]. The subjects' heights and weights were measured, and the BMI was calculated by dividing the weight (kg) by the square of the height (m2).
- Confirmation of a hyperbolic relationship
- The hyperbolic relationship between insulin secretion and insulin sensitivity was characterized by using the following equation: log (insulin secretion)=constant+β log (insulin sensitivity). By applying a regression analysis to the model, a hyperbolic relationship can be established if β is approximately equal to -1 and the 95% confidence interval (CI) of β excludes 0. The OGTT-derived total AUC (I/G) and Matsuda index were used as the insulin secretion and sensitivity indices, respectively, across the glucose tolerance range [14].
- Statistical analysis
- Data are presented as mean±standard errors, or as numbers with proportions. Values were first assessed for normality and then compared between the groups. Differences in the baseline characteristics between subjects from the 1990s and 2000s were determined by using the t-test or Wilcoxon rank sum test for continuous variables, and the chi-square test for categorical variables. Comparison of time course curves during OGTT were analyzed by repeated measures analysis of variance, and is described as "P for trend." Comparisons of the insulin sensitivity and secretion indices were determined by using an analysis of covariance after adjusting for the age, sex, and BMI. As noted by Kahn et al. [15] we used perpendicular least squares properly weighted regression to confirm the hyperbolic relationship between the total AUC (I/G) and Matsuda index. The statistical analysis was performed by using a computer software program (SAS version 8.2; SAS Institute Inc., Cary, NC, USA) and P values <0.05 were considered statistically significant.
- Ethics statement
- This study protocol was approved by the Institutional Review Board of The Catholic University of Korea (No. KC13RISI0209). Only de-identified patient data from the database were accessed and were analyzed anonymously. Therefore, the institutional review board waived the need for written informed consent from the participants. This study was conducted according to the principles expressed in the Declaration of Helsinki.
METHODS
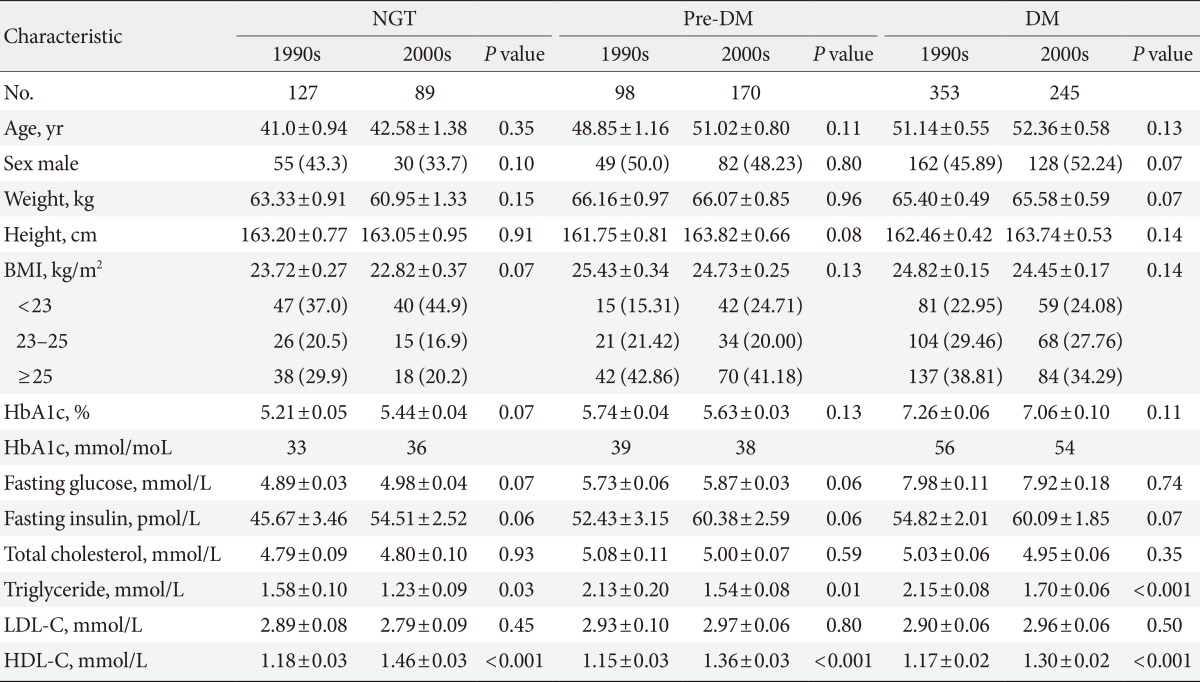
- Baseline clinical characteristics
- A total of 578 subjects from the 1990s and 504 subjects from the 2000s were enrolled (Table 1). The mean ages of the subjects in the 1990s and 2000s were 48.51±11.3 and 50.2±10.9 years respectively. Of the subjects, 127 in the 1990s and 89 in the 2000s had NGT, 98 in the 1990s and 170 in the 2000s had pre-DM, and 353 in the 1990s and 245 in the 2000s had DM. No significant differences were observed between the subjects from the 1990s and 2000s in the three glucose tolerance groups with respect to age, sex, weight, height, BMI, hemoglobin A1c level, fasting glucose level, and fasting insulin level. The enrolled subjects were further grouped into three categories according to their BMI values as follow: group 1, BMI <23 kg/m2; group 2, BMI=23 to 25 kg/m2; and group 3, BMI ≥25 kg/m2.
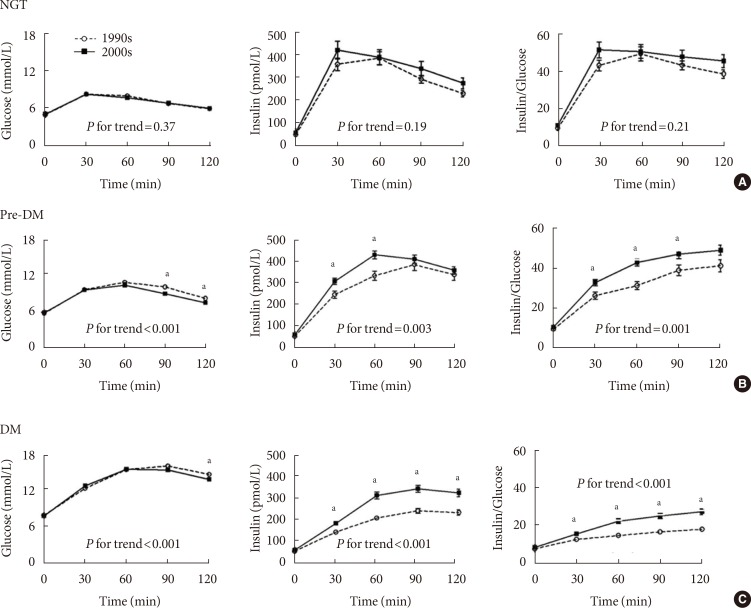
- Oral glucose tolerance test results of subjects in the 1990s and 2000s
- The glucose and insulin measurements and insulin-to-glucose ratios obtained during the 75-g OGTT are shown in Fig. 1. In the NGT group, no significant differences were observed with respect to the glucose (P for trend=0.37) and insulin (P for trend=0.19) levels and the insulin-to-glucose ratio (P for trend=0.21). However, in the pre-DM and DM groups, the insulin-to-glucose ratios were significantly higher in subjects from the 2000s than in those from the 1900s.
- Differences in insulin secretion and sensitivity between the 1990s and 2000s
- The Matsuda index of insulin sensitivity and QUICKI scores were both significantly lower in subjects from the 2000s than in those from the 1990s, regardless of the glucose tolerance status (Table 2). The HOMA-IR was significantly higher in subjects from the 2000s than in those from the 1990s, regardless of the glucose tolerance status. However there were no significant differences in the insulinogenic index between the 1990s and 2000s in the NGT, pre-DM, or DM groups, and the oral disposition index was significantly lower in the NGT group from the 2000s.
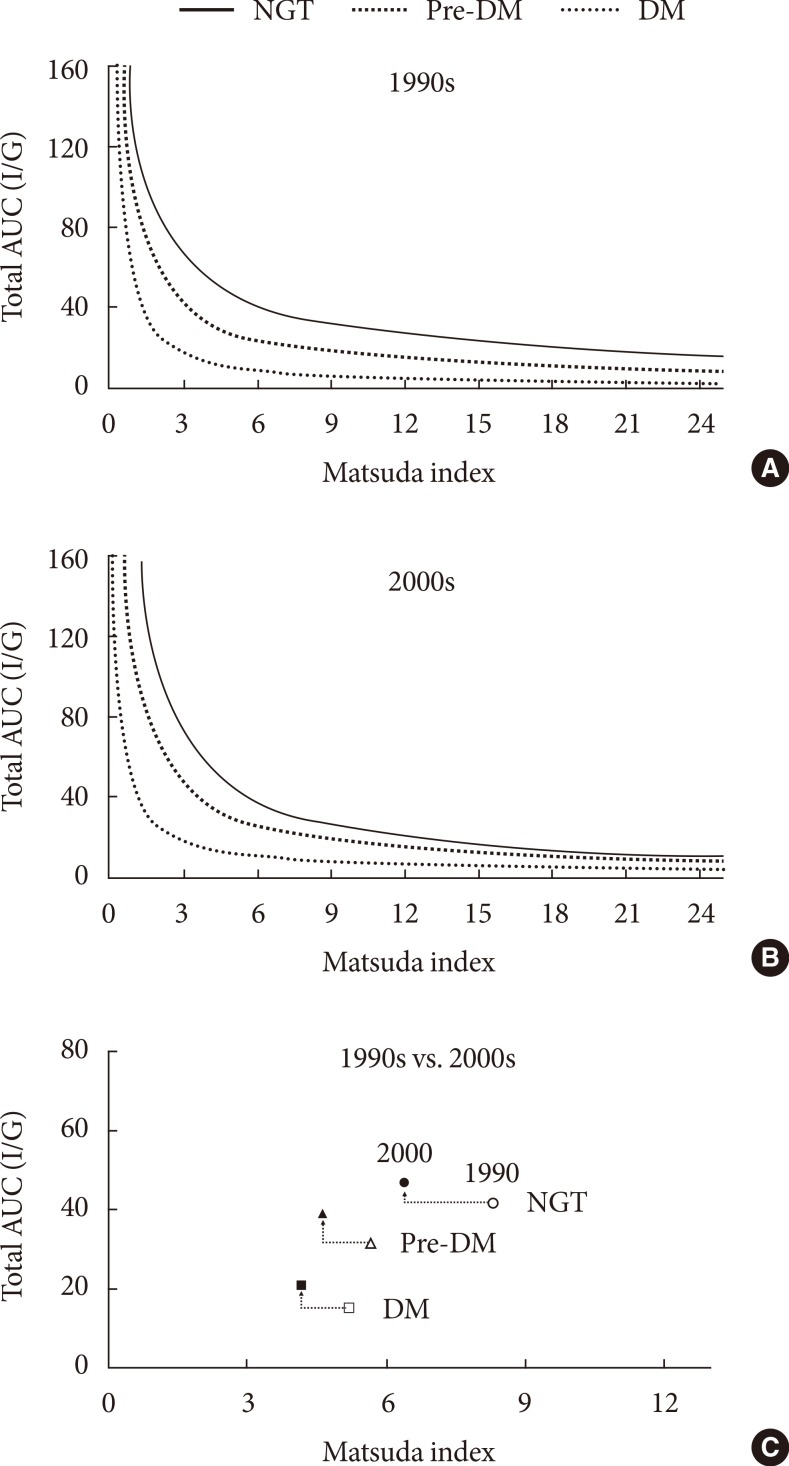
- Relationship between the Matsuda index and the total AUC (I/G)
- In Fig. 2, hyperbolic lines indicate the predicted means of the cross-sectional relationship between the Matsuda index and the total AUC (I/G). The Matsuda index and total AUC (I/G) yielded a distinct relationship for each glucose tolerance group (P<0.001) in the 1990s as follows: NGT, β=-0.69 (95% CI, -0.80 to -0.59); pre-DM, β=-0.84 (95% CI, -0.96 to -0.81); and DM, β=-1.07 (95% CI, -1.18 to -0.95) (Fig. 2A). The mean product (±standard error) of the Matsuda index and the total AUC (I/G) progressively decreased from NGT group (272.80±9.66) to that obtained from the pre-DM group (144.11±60.11) and subsequently to that obtained from the DM group (57.25±2.06), consistent with the notion of declining β-cell function (P<0.001). In subjects from the 2000s, the combination of two indices satisfied a distinct relationship (P<0.001) for each glucose tolerance group, as follows: NGT, β=-0.94 (95% CI, -1.07 to -0.81); pre-DM, β=-0.87 (95% CI, -0.96 to -0.78); and DM, β=-0.83 (95% CI, -1.00 to -0.66) (Fig. 2B). Similarly, the mean product (±standard error) of the Matsuda index and the total AUC (I/G) progressively decreased from the NGT group (236.21±74.06) to the pre-DM (151.03±42.77) and finally to the DM group (69.74±2.47; P<0.001). The mean product of the Matsuda index and the total AUC (I/G) was significantly lower (P<0.001) in the NGT subjects from the 2000s than in those from the 1990's. There were no such differences in the pre-DM or DM groups. Fig. 2C represents the mean values of the Matsuda index and total AUC (I/G) for each glucose tolerance group from 1990s and 2000s.
- Subgroup analysis according to the BMI
- We conducted a further analysis according to the BMI. The World Health Organization has recommended a BMI of 18.5 to 23 kg/m2 as healthy for Asians [16]; a BMI ≥23 kg/m2 is associated with a risk of diabetes [17]. However there were little significant differences with respect to increasing BMI levels in all the glucose tolerance groups.
RESULTS
- This study compared two cross-sectional studies on insulin sensitivity and insulin secretion based on the 75-g OGTT in a Korean population with different glucose tolerance status. Studies on secular trends of diabetes or metabolic syndrome components have been limited to the prevalence or anthropometric measures in the United States [18], Europe [19], and South Asia [20]. In a nationwide epidemiologic study, Danaei et al. [21], reported that the age-standardized, global, mean fasting plasma glucose have increase by 0.07 mmol/L per decade during the past 30 years. However there is insufficient data from studies that focused on changes in insulin secretion. Previously, a longitudinal study was conducted in 209 Pima Indians and demonstrated improved insulin secretion proportional to the amount of weight loss; however, the mean observation period was only 2.6 years [22]. Other studies have been conducted on changes in insulin secretion and resistance along with worsening of glucose tolerance [4,23], but these studies have mainly focused on the natural history of diabetes development.
- To our knowledge, this is the first study to compare the differences in insulin secretory function and sensitivity between 2 different decades using measures obtained during the OGTT. The mean ages of the enrolled subjects were 48.51 years in the 1990s and 50.2 years in the 2000s. Those who were in their late 40s in the 1990s had been born before the Korean War, whereas those who were in their early 50s in the 2000s were mostly born after the Korean War and during the period of rapid South Korean economic growth. Therefore, by comparing subjects from the 1990s and 2000s, we were able to compare the effect of environmental factors on insulin resistance and secretion.
- Subjects from the 2000s had significantly lower Matsuda index and QUICKI and higher level of HOMA-IR than those from the 1990s, regardless of their glucose tolerance statuses. Additionally, the total AUC (I/G) and I/G ratio curves during OGTT were higher in the pre-DM and DM groups from the 2000s, suggesting increased insulin resistance in subjects from this decade. However, early-phase insulin secretion, as measured by the insulinogenic index, did not differ significantly between the 2 decades in any of the glucose tolerance groups. These findings not only suggested that insulin resistance increased during the past decade, but also that compensation in early-phase insulin secretion was not observed in the subjects with or without diabetes. Even after accounting for the increased insulin resistance, the pancreatic β-cell function remained unchanged in all of the glucose tolerance groups. Moreover, oral disposition index in NGT group from 2000s was significantly lower than those from 1990s, which suggest a potential increase in the risk of T2DM development in the future.
- Similar to previous studies performed by using disposition index curves [24], the hyperbolic curves exhibit a shift toward the origin as glucose tolerance worsen in both the 1990s and 2000s. This finding was represented by a progressive decline in the product of the Matsuda index and the total AUC (I/G) along with the worsening of glucose tolerance. Similar to the oral disposition index, the product of the two indices was significantly lower (P<0.001) in the NGT subjects from 2000s vs. 1990s. These finding suggests an increased risk of DM development in the future. However, 95% CIs did not include -1 in the NGT and pre-DM groups from the 1990s and in the pre-DM group from the 2000s, and therefore did not fulfill the criteria for hyperbolic relationship in these groups. This may reflect either analytic limitation or complexities in the underlying physiology, as observed in other previous reports [25].
- We had expected that the changes in insulin resistance and secretion would differ according to the BMI levels. In this study, little significance was observed among the different BMI levels. However, further studies with larger populations in each BMI group are required. There are some other limitations in this study. The sample sizes of subjects with isolated impaired fasting glucose, isolated impaired glucose tolerance, and combined impaired fasting glucose and impaired glucose tolerance were too small, and were ultimately categorized into a single pre-DM group. As the pathogenesis of impaired fasting glucose and impaired glucose tolerance is thought to be different [13], a further analysis of detailed glucose tolerance groups would be more informative. Also, enrolled subjects were those who visited tertiary hospital. The subjects therefore do not represent randomly selected subjects collected in the general Korean population and we could not rule out a potential selection bias. Further studies on larger population representative of general Korean subjects are needed. Although we have shown a tendency of increased insulin resistance without significant changes in BMI or body weight between subjects from 1990s and 2000s, we could not fully explain the underlying mechanism. Increased insulin resistance without significant changes in BMI or body weight may be the consequences of differences in the body composition, degree of social stress or socioeconomic status, prevalence of hypertension, menopausal status or C reactive protein levels [26,27], which were not evaluated in our study. Finally, information on medication history, smoking status or alcohol consumption were not evaluated.
- In Korea, the proportions of patient with diabetes who are not obese was approximately 71.3% in the early 1980s [28], 68.5% in the early 1990s [29,30], and 57.5% in the mid-2000s [31]. These changes represent a decreased proportion of nonobese patients and an increased proportion of obese patients among subjects with diabetes, as well as the westernization of the T2DM phenotype. It remains unclear whether these changes are associated with physiologies of pancreatic β-cell and target organs (muscle, liver, and adipose tissue).
- In conclusion, insulin resistance has worsened across the glucose tolerance spectrum in response to rapid economic growth and changes in lifestyle patterns; however, insulin secretory functions remained unchanged, leading to increased susceptibility to T2DM development among Korean subjects without diabetes. Also, further studies on larger population representative of general Korean subjects are needed.
DISCUSSION
-
Acknowledgements
- This study was supported by the National Research Foundation of Korea (NRF) grant funded by the Korea Government (2013M3C8A2075675). The funders had no role in study design, data collection and analysis, decision to publish or preparation of the manuscript.
ACKNOWLEDGMENTS
-
CONFLICTS OF INTEREST: No potential conflict of interest relevant to this article was reported.
NOTES
- 1. Yoon KH, Lee JH, Kim JW, Cho JH, Choi YH, Ko SH, Zimmet P, Son HY. Epidemic obesity and type 2 diabetes in Asia. Lancet 2006;368:1681-1688. ArticlePubMed
- 2. He Q, Horlick M, Thornton J, Wang J, Pierson RN Jr, Heshka S, Gallagher D. Sex and race differences in fat distribution among Asian, African-American, and Caucasian prepubertal children. J Clin Endocrinol Metab 2002;87:2164-2170. ArticlePubMed
- 3. Kim DJ, Lee MS, Kim KW, Lee MK. Insulin secretory dysfunction and insulin resistance in the pathogenesis of korean type 2 diabetes mellitus. Metabolism 2001;50:590-593. ArticlePubMed
- 4. Fukushima M, Suzuki H, Seino Y. Insulin secretion capacity in the development from normal glucose tolerance to type 2 diabetes. Diabetes Res Clin Pract 2004;66(Suppl 1):S37-S43. ArticlePubMed
- 5. Yoon KH, Ko SH, Cho JH, Lee JM, Ahn YB, Song KH, Yoo SJ, Kang MI, Cha BY, Lee KW, Son HY, Kang SK, Kim HS, Lee IK, Bonner-Weir S. Selective beta-cell loss and alpha-cell expansion in patients with type 2 diabetes mellitus in Korea. J Clin Endocrinol Metab 2003;88:2300-2308. PubMed
- 6. Rahier J, Guiot Y, Goebbels RM, Sempoux C, Henquin JC. Pancreatic beta-cell mass in European subjects with type 2 diabetes. Diabetes Obes Metab 2008;10(Suppl 4):32-42. PubMed
- 7. Ramachandran A, Chamukuttan S, Shetty SA, Arun N, Susairaj P. Obesity in Asia: is it different from rest of the world. Diabetes Metab Res Rev 2012;28(Suppl 2):47-51. ArticlePubMed
- 8. Choi YJ, Cho YM, Park CK, Jang HC, Park KS, Kim SY, Lee HK. Rapidly increasing diabetes-related mortality with socio-environmental changes in South Korea during the last two decades. Diabetes Res Clin Pract 2006;74:295-300. ArticlePubMed
- 9. Fernandez-Twinn DS, Ozanne SE. Mechanisms by which poor early growth programs type-2 diabetes, obesity and the metabolic syndrome. Physiol Behav 2006;88:234-243. ArticlePubMed
- 10. Ravelli AC, van der Meulen JH, Michels RP, Osmond C, Barker DJ, Hales CN, Bleker OP. Glucose tolerance in adults after prenatal exposure to famine. Lancet 1998;351:173-177. ArticlePubMed
- 11. American Diabetes Association. Standards of medical care in diabetes: 2011. Diabetes Care 2011;34(Suppl 1):S11-S61. ArticlePubMedPMCPDF
- 12. Pratley RE, Weyer C. The role of impaired early insulin secretion in the pathogenesis of type II diabetes mellitus. Diabetologia 2001;44:929-945. ArticlePubMedPDF
- 13. Rhee SY, Woo JT, Chon S, Hwang YC, Oh S, Ahn KJ, Chung HY, Kim SW, Kim JW, Kim YS. Characteristics of insulin resistance and insulin secretory capacity in Korean subjects with IFG and IGT. Diabetes Res Clin Pract 2010;89:250-255. ArticlePubMed
- 14. Retnakaran R, Shen S, Hanley AJ, Vuksan V, Hamilton JK, Zinman B. Hyperbolic relationship between insulin secretion and sensitivity on oral glucose tolerance test. Obesity (Silver Spring) 2008;16:1901-1907. ArticlePubMedPDF
- 15. Kahn SE, Prigeon RL, McCulloch DK, Boyko EJ, Bergman RN, Schwartz MW, Neifing JL, Ward WK, Beard JC, Palmer JP. Quantification of the relationship between insulin sensitivity and beta-cell function in human subjects. Evidence for a hyperbolic function. Diabetes 1993;42:1663-1672. ArticlePubMed
- 16. WHO Expert Consultation. Appropriate body-mass index for Asian populations and its implications for policy and intervention strategies. Lancet 2004;363:157-163. ArticlePubMed
- 17. Ramachandran A, Ma RC, Snehalatha C. Diabetes in Asia. Lancet 2010;375:408-418. ArticlePubMed
- 18. Gregg EW, Cheng YJ, Cadwell BL, Imperatore G, Williams DE, Flegal KM, Narayan KM, Williamson DF. Secular trends in cardiovascular disease risk factors according to body mass index in US adults. JAMA 2005;293:1868-1874. ArticlePubMed
- 19. Bjorkelund C, Andersson-Hange D, Andersson K, Bengtsson C, Blomstrand A, Bondyr-Carlsson D, Eiben G, Rodstrom K, Sjoberg A, Sundh V, Weman L, Zylberstein D, Hakeberg M, Lissner L. Secular trends in cardiovascular risk factors with a 36-year perspective: observations from 38- and 50-year-olds in the Population Study of Women in Gothenburg. Scand J Prim Health Care 2008;26:140-146. ArticlePubMedPMC
- 20. Mohan V, Deepa M, Deepa R, Shanthirani CS, Farooq S, Ganesan A, Datta M. Secular trends in the prevalence of diabetes and impaired glucose tolerance in urban South India: the Chennai Urban Rural Epidemiology Study (CURES-17). Diabetologia 2006;49:1175-1178. ArticlePubMedPDF
- 21. Danaei G, Finucane MM, Lu Y, Singh GM, Cowan MJ, Paciorek CJ, Lin JK, Farzadfar F, Khang YH, Stevens GA, Rao M, Ali MK, Riley LM, Robinson CA, Ezzati M. Global Burden of Metabolic Risk Factors of Chronic Diseases Collaborating Group (Blood Glucose). National, regional, and global trends in fasting plasma glucose and diabetes prevalence since 1980: systematic analysis of health examination surveys and epidemiological studies with 370 country-years and 2.7 million participants. Lancet 2011;378:31-40. ArticlePubMed
- 22. Weyer C, Hanson K, Bogardus C, Pratley RE. Long-term changes in insulin action and insulin secretion associated with gain, loss, regain and maintenance of body weight. Diabetologia 2000;43:36-46. ArticlePubMedPDF
- 23. Weyer C, Bogardus C, Mott DM, Pratley RE. The natural history of insulin secretory dysfunction and insulin resistance in the pathogenesis of type 2 diabetes mellitus. J Clin Invest 1999;104:787-794. ArticlePubMedPMC
- 24. Bergman RN, Finegood DT, Kahn SE. The evolution of betacell dysfunction and insulin resistance in type 2 diabetes. Eur J Clin Invest 2002;32(Suppl 3):35-45.
- 25. Ferrannini E, Mari A. Beta cell function and its relation to insulin action in humans: a critical appraisal. Diabetologia 2004;47:943-956. ArticlePubMedPDF
- 26. van den Berg G, van Eijsden M, Vrijkotte TG, Gemke RJ. Socioeconomic inequalities in lipid and glucose metabolism in early childhood in a population-based cohort: the ABCD-Study. BMC Public Health 2012;12:591PubMedPMC
- 27. Chou HH, Hsu LA, Liu CJ, Teng MS, Wu S, Ko YL. Insulin resistance is associated with C-reactive protein independent of abdominal obesity in nondiabetic Taiwanese. Metabolism 2010;59:824-830. ArticlePubMed
- 28. Lee KW, Son HY, Kang SK, Bang BK, Park DH, Song HH, Min BS. Epidemiology of 18,201 Korean type 2 diabetes mellitus. J Korean Diabetes Assoc 1984;8:5-14.
- 29. Min HK. Clinical characteristics of diabetes in Korea. J Korean Diabetes Assoc 1992;16:163-174.
- 30. Park JY, Kim HK, Kim MS, Park KS, Kim SY, Cho BY, Lee HK, Koh CS, Min HK. Body weight changes of non-insulin dependent diabetic patients in Korea. J Korean Diabetes Assoc 1993;17:51-58.
- 31. Song KE, Kim DJ, Park JW, Cho HK, Lee KW, Huh KB. Clinical characteristics of Korean type 2 diabetic patients according to insulin secretion and insulin resistance. J Korean Diabetes Assoc 2007;31:123-129.Article
REFERENCES
Results of the 75-g oral glucose tolerance test in subjects from the 1990s and 2000s. Measurements obtained during the 75-g oral glucose tolerance test (OGTT) were compared at each time points using the t-test in subjects with (A) normal glucose tolerance (NGT), (B) pre-diabetes mellitus (pre-DM), and (C) diabetes mellitus (DM). Comparison of time course curves during OGTT were analyzed by repeated measures analysis of variance (ANOVA). Open circles and dashed lines represent measurements obtained in subjects from the 1990s. Black squares and solid lines represent measurements obtained in subjects from the 2000s. aP value <0.05 at the 0, 30, 60, 90, or 120-minute time points during the 75-g OGTT. "P for trend" indicates the comparison of time course curves during OGTT, analyzed by repeated measures ANOVA.

Hyperbolic relationship between the Matsuda index and the total area under the curve (total AUC; insulin/glucose [I/G]). A distinct hyperbolic relationship was observed between the Matsuda index and the total AUC (I/G) in subjects with normal glucose tolerance (NGT), pre-diabetes mellitus (pre-DM), and diabetes mellitus (DM) from (A) the 1990s (P<0.001) and (B) the 2000s (P<0.001). (C) Mean values of Matsuda index and total AUC (I/G) in each glucose tolerance group from the 1990s and 2000s. Open and filled circles represent the subjects with NGT from the 1990s and 2000s, respectively. Open and filled triangles represent the subjects with pre-DM from the 1990s and 2000s, respectively. Open and filled squares represent the subjects with DM from the 1990s and 2000s respectively.
Differences in insulin secretion and sensitivity between the 1990s and 2000s
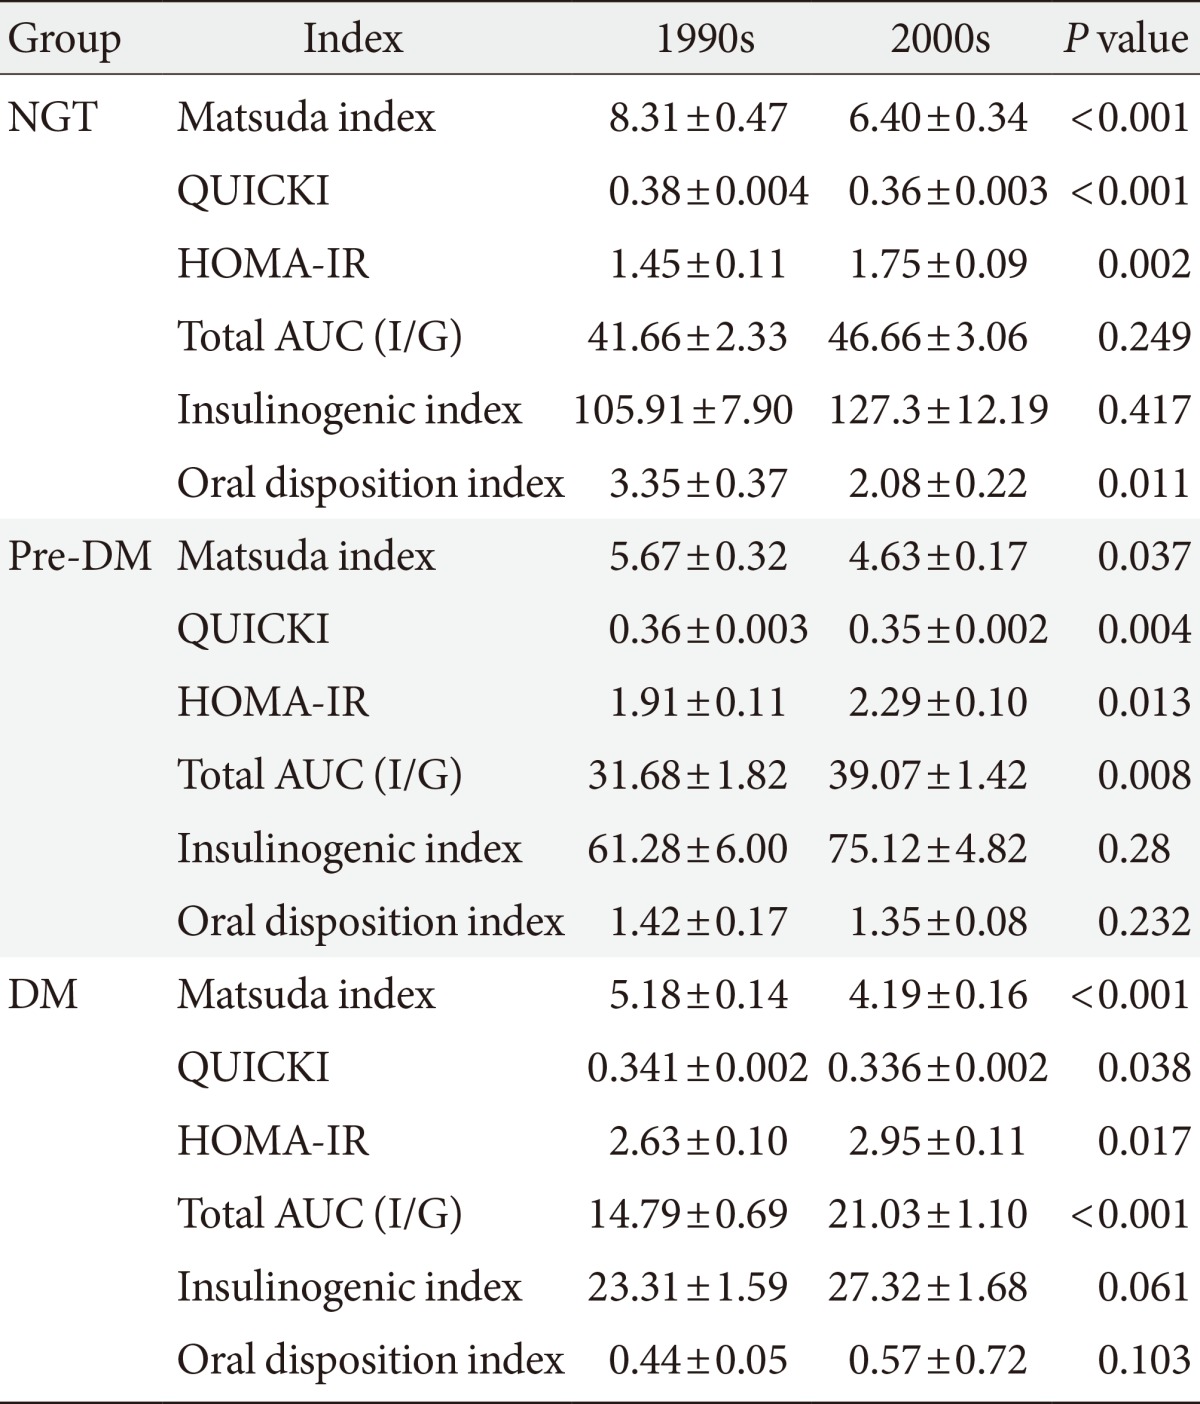
Values are presented as mean±standard error.
NGT, normal glucose tolerance; QUICKI, quantitative insulin sensitivity check index; HOMA-IR, homeostatic model assessment for insulin resistance; Total AUC (I/G), total area under the curve (insulin/glucose); pre-DM, pre-diabetes mellitus; DM, diabetes mellitus.
Figure & Data
References
Citations
- Longitudinal Changes in Insulin Resistance, Beta-Cell Function and Glucose Regulation Status in Prediabetes
Chul-Hee Kim, Hong-Kyu Kim, Eun-Hee Kim, Sung-Jin Bae, Jaewon Choe, Joong-Yeol Park
The American Journal of the Medical Sciences.2018; 355(1): 54. CrossRef - Association of serum 25-hydroxyvitamin D and diabetes-related factors in Korean adults without diabetes: The Fifth Korea National Health and Nutrition Examination Survey 2010–2012
Hyunah Kim, Hyunyong Lee, Hyeon Woo Yim, Hun-Sung Kim
Primary Care Diabetes.2018; 12(1): 59. CrossRef - Long‐term effects on glycaemic control and β‐cell preservation of early intensive treatment in patients with newly diagnosed type 2 diabetes: A multicentre randomized trial
Suk Chon, Sang Youl Rhee, Kyu Jeung Ahn, Sei Hyun Baik, Yongsoo Park, Moon Suk Nam, Kwan Woo Lee, Soon Jib Yoo, Gwanpyo Koh, Dae Ho Lee, Young Seol Kim, Jeong‐Taek Woo
Diabetes, Obesity and Metabolism.2018; 20(5): 1121. CrossRef - Four Plasma Glucose and Insulin Responses to a 75 g OGTT in Healthy Young Japanese Women
Kei Takahashi, Hidetaka Nakamura, Hiroshi Sato, Hideto Matsuda, Kazuo Takada, Tomiko Tsuji
Journal of Diabetes Research.2018; 2018: 1. CrossRef - Comparison of insulin intensification strategies with insulin lispro low mixture twice daily versus basal insulin glargine and prandial insulin lispro once daily in East Asian and Caucasian patients with type 2 diabetes mellitus
In‐Kyung Jeong, Choon Hee Chung, Zhiguang Zhou, Jeong Hee Han, Ran Duan, Diana M. Edralin, Angel Rodriguez
Journal of Diabetes.2017; 9(4): 396. CrossRef - Insulin Secretory Capacity and Insulin Resistance in Korean Type 2 Diabetes Mellitus Patients
Jong-Dai Kim, Won-Young Lee
Endocrinology and Metabolism.2016; 31(3): 354. CrossRef - Antisenescence activity of G9a inhibitor BIX01294 on human bone marrow mesenchymal stromal cells
Min-Ji AHN, Sin-Gu JEONG, Goang-Won CHO
TURKISH JOURNAL OF BIOLOGY.2016; 40: 443. CrossRef - Urinary N-acetyl-β-D-glucosaminidase, an early marker of diabetic kidney disease, might reflect glucose excursion in patients with type 2 diabetes
So Ra Kim, Yong-ho Lee, Sang-Guk Lee, Eun Seok Kang, Bong-Soo Cha, Jeong-Ho Kim, Byung-Wan Lee
Medicine.2016; 95(27): e4114. CrossRef
 PubReader
 Cite
Cite