Cardiovascular Outcomes according to Comorbidities and Low-Density Lipoprotein Cholesterol in Korean People with Type 2 Diabetes Mellitus
Article information
 , Junghyun Noh2, Eun-Jung Rhee3, Sang Hyun Park4, Hyeon Chang Kim5, Byung Jin Kim6, Hae Jin Kim7, Seonghoon Choi8, Jin Oh Na9, Young Youl Hyun10, Bum Joon Kim11, Kyung-Do Han12, In-Kyung Jeong,13, on Behalf of the Committee of Practice Guideline of Korean Lipid and Atheroscelerosis
Abstract
Background
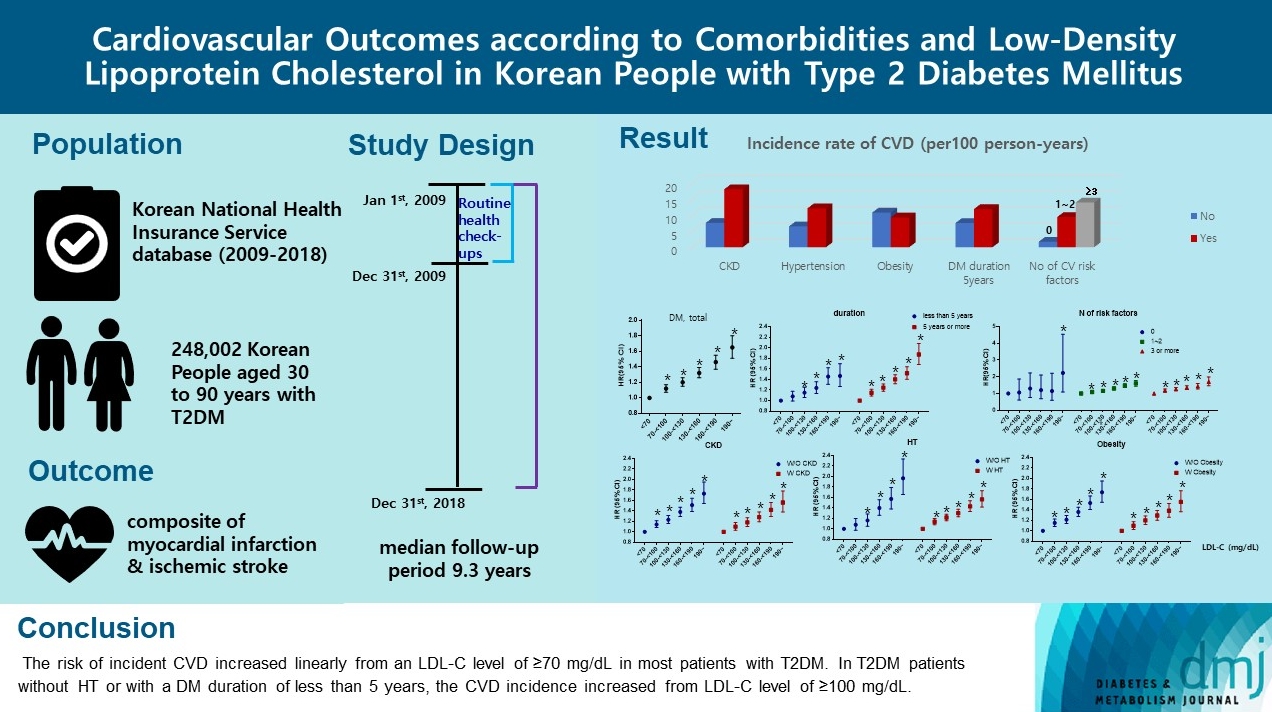
There are no clear data to support the cardiovascular (CV) risk categories and low-density lipoprotein cholesterol (LDL-C) treatment goals in Korean people with type 2 diabetes mellitus (T2DM). We evaluated the incidence of cardiovascular disease (CVD) according to comorbidities and suggested LDL-C treatment goals in Korean people with T2DM in nationwide cohort data.
Methods
Using the Korean National Health Insurance Service database, 248,002 people aged 30 to 90 years with T2DM who underwent routine health check-ups during 2009 were included. Subjects with previous CVD were excluded from the study. The primary outcome was incident CVD, defined as a composite of myocardial infarction and ischemic stroke during the follow-up period from 2009 to 2018.
Results
The mean age of the study participants was 59.6±10.9 years, and median follow-up period was 9.3 years. CVD incidence increased in the order of DM duration of 5 years or more (12.04/1,000 person-years), hypertension (HT) (12.27/1,000 personyears), three or more CV risk factors (14.10/1,000 person-years), and chronic kidney disease (18.28/1,000 person-years). The risk of incident CVD increased linearly from an LDL-C level of ≥70 mg/dL in most patients with T2DM. In T2DM patients without HT or with a DM duration of less than 5 years, the CVD incidence increased from LDL-C level of ≥100 mg/dL.
Conclusion
For primary prevention of CVD in Korean adults with T2DM, it can be helpful to lower LDL-C targets when there are chronic kidney disease, HT, a long duration of diabetes mellitus, or three or more CV risk factors.
INTRODUCTION
Diabetes mellitus (DM) is a risk factor for cardiovascular disease (CVD) and is commonly regarded as a coronary heart disease equivalent [1-3]. Therefore, in most lipid treatment guidelines, people with DM are classified as a high-risk group for CVD and are recommended to lower the low-density lipoprotein cholesterol (LDL-C) levels according to the target level [4,5]. However, not all patients with DM have the same risk of CVD. According to comorbidities, including established CVD, chronic kidney disease (CKD), hypertension (HT), and diabetic microvascular complications and duration of DM, the cardiovascular (CV) risks vary among people with DM [6-8]. Recent guidelines have categorized CVD risks of patients with DM according to established CVD, number of major risk factors, age, duration of DM, target organ damages including albuminuria or CKD, retinopathy, and neuropathy, and recommended the different treatment target of LDL-C levels [6,7]. In 2018, the Korean Society of Lipid and Atherosclerosis (KSoLA) guidelines for the management of dyslipidemia, the CVD risk categories were differentiated based on the level of CVD risk factors, and target LDL-C concentration was recommended with reference to study findings worldwide and in Korea, as well as with the 2013 American College of Cardiology (ACC)/American Heart Association (AHA), 2016 European Society of Carfdiology (ESC)/European Atherosclerosis Society (EAS), and treatment guidelines published in other countries [4,5]. Patients with DM were classified as a high-risk group, and the goal of LDL-C concentration was recommended as level of <100 mg/dL for primary prevention [4]. In addition, for type 2 diabetes mellitus (T2DM) patients with target organ damage or major CVD risk factors, the LDL-C target could be lowered [4,9].
The risk factors for CVD are well known, but the CVD incidence varies across regions and time, paralleling the distribution of these CVD risk factors [10]. Currently, there is insufficient Korean data to support the CV risk categories or LDL-C treatment goals recommended in the current treatment guidelines of the KSoLA. Therefore, in this study, based on a large cohort representing Koreans, we aimed to assess the CV outcomes and suggest appropriate LDL-C treatment goals in patients with T2DM according to comorbidities.
METHODS
Data sources
This study was performed based on the National Health Insurance Service (NHIS) database between January 1, 2009, and December 31, 2009. After de-identification, the NHIS provided data including age, sex, diagnosis, date of hospital visits, drug prescriptions received during inpatient and outpatient visits, hospital admissions, medical procedures, and emergency department visits. Drug information included the brand name, generic name, prescription date, duration, and route of administration. Diagnoses were coded according to the International Classification of Diseases 10th revision (ICD-10). As the NHIS provides biennial health screening examinations, the database also included body measurements, laboratory results, and additional information on smoking status, alcohol drinking habits, and menopausal status from self-reported questionnaires [11,12]. The dates of death of the participants provided by the NHIS were retrieved from the National Death Registry of the Korea National Statistical Office [11,12].
This study was approved by the Boramae Medical Center Institutional Review Board (IRB No. 07-2019-20). Informed consent was waived by the board.
Study participants
This study was conducted among adults aged 30 to 90 years who underwent routine health check-ups provided by the NHIS during 2009 and had been diagnosed with T2DM were selected for the analysis (n=248,002). Individuals with insufficient data on clinical parameters including lipid profile, LDL-C level of ≥400 mg/dL, a previous history of ischemic stroke or ischemic heart disease (IHD), or with an outcome within 90 days were excluded (Supplementary Fig. 1). T2DM was defined as follows [7,10]: (1) at least one service claim with a diagnosis of T2DM based on ICD-10 (E11–14) in the outpatient or inpatient setting and were prescribed at least one antidiabetic drug at any time over 1 year to exclude individuals with prediabetes or without diabetes or (2) fasting plasma glucose of ≥126 mg/dL during health examinations (newly diagnosed diabetes).
Blood samples were obtained after at least 8 hours of overnight fasting and were analyzed according to the standardized protocol. Total cholesterol, triglycerides (TG) and high-density lipoprotein cholesterol (HDL-C) levels were measured directly, and LDL-C levels were calculated from the Friedwald formula: LDL-C=total cholesterol−HDL-C−(TG/5).
HT was defined as a blood pressure of ≥140/90 mm Hg or use of an antihypertensive medication under ICD-10 codes I10–13 and I15. Dyslipidemia was defined as total cholesterol of ≥240 mg/dL or use of cholesterol-lowering agents under ICD-10 code E78. CKD was defined as estimated glomerular filtration rate (eGFR) of ≤60 mL/min/1.73 m2. Obesity was defined as a body mass index (BMI) of ≥25 kg/m2. Major CV risk factors were old age (men ≥45 years, women ≥55 years), family history of CVD, HT, current smoking, and low HDL-C (<40 mg/dL).
Based on the self-reported questionnaire, participants were classified according to their alcohol drinking habits into three groups: non-drinkers, mild drinkers (daily alcohol intake <30 g/day), and heavy drinkers (daily alcohol intake ≥30 g/day). Smoking history, duration of diabetes and family history of CVD were also assessed using self-reported questionnaires. Regular exercise was defined as performing more than 30 minutes of moderate physical activity at least five times per week or more than 20 minutes of strenuous physical activity at least three times per week.
Study outcomes
The primary outcome was a composite of myocardial infarction (MI) and ischemic stroke, during the follow-up period from 2009 to 2018. Secondary outcomes were the incidence of MI and ischemic stroke. MI was diagnosed using hospitalization with the primary diagnostic ICD-10 codes I21–22 [13]. Ischemic stroke was defined as hospitalization under ICD-10 codes I63–64 and having brain imaging such as computed tomography and magnetic resonance imaging during admission [13]. A previous history of IHD and MI was diagnosed using the codes I20–25 and I21–22, with more than one diagnosis during admission or at outpatient clinics, respectively [11]. The wash-out period for defining incident cases was 2002 to 2008.
Statistical analysis
Baseline characteristics are presented as number (%), mean± standard deviation or median (interquartile range). To compare the participants' clinical characteristics according to the primary outcome, the Mood median test or analysis of variance for continuous variables and the chi-square test for categorical variables were used. The incidence rate of primary outcomes was calculated by dividing the number of incident cases by the total follow-up duration (person-years). Participants were divided into the following categories according to LDL-C level: <70, 70–99, 100–129, 130–159, and ≥160 mg/dL. Cox regression analyses were performed to estimate the risk of CVD for each LDL-C group using the <70 mg/dL group as the reference group. A multivariable Cox proportional hazards model was applied and was adjusted for age, sex, BMI (kg/m2), current smoking status, alcohol consumption, regular exercise (no, yes), HT (no, yes), eGFR, statin use and TG-lowering medication. The hazard ratio (HR) and 95% confidence interval (CI) for primary outcomes were calculated using multivariable Cox proportional hazards regression analysis. All data were analyzed using SAS version 9.3 (SAS Institute Inc., Cary, NC, USA) and a P value of <0.05 was considered significant.
RESULTS
Baseline characteristics
The baseline characteristics of the participants were presented in Table 1. The mean age of the study participants (n=248,002) was 59.6±10.9 years, and 142,566 (57.5%) were men. The median follow-up period was 9.3 years (interquartile range, 9.0 to 9.6). The mean total cholesterol, TG, HDL-C and LDL-C levels were 193.1±41.8, 143.3 (interquartile range, 142.9 to 143.6), 52.2±29.7, and 108.2±37.8 mg/dL, respectively. The characteristics of the participants grouped according to the presence or absence of CKD, HT, and obesity were listed in Supplementary Table 1 .
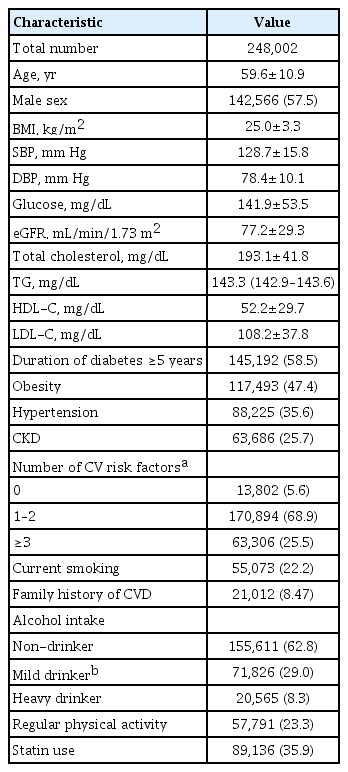
Baseline characteristics of study population
Incidence rate of CVD according to comorbidities
The incidence rate of CVD among Korean adults with T2DM and no previous CVD was 10.19 per 1,000 person-years. The incidence rate of CVD according to accompanying CKD, HT, and obesity, duration of DM, and number of risk factors were significantly different (Table 2). Among these CV risk enhancing factors, CKD was associated with the highest risk of CVD in patients with T2DM. People with T2DM and CKD had a 2.4-fold higher incidence of CVD than those without CKD. The CVD incidence of patients with T2DM and HT was doubled compared to that of patients with T2DM without HT. In the case of obesity, CVD incidence did not increase, but was lower in obese people with T2DM than in non-obese individuals. The incidence rate of CVD was 1.6 times higher in people with DM for more than 5 years compared with those with DM for less than 5 years. The CVD incidence was increased when accompanied by CKD or HT, a duration of more than 5 years, and three or more risk factors. In T2DM patients without CV risk factors, the incidence rate of CVD was 1.73 per 1,000 person-years.

Incidence rate (confidence interval) of CVD according to comorbidities (per 1,000 person-years)
Incidence of CVD according to LDL-C levels and comorbidity
The incidence of composite of MI and stroke, each incidence of MI and stroke were increased among people with T2DM with LDL-C level of ≥70 mg/dL compared to those with LDL-C level of <70 mg/dL (Table 3 and Fig. 1A). In the fully adjusted model, there was a significant dose-response relationship between LDL-C levels and the risk of the composite outcome, MI, and stroke among people with T2DM (P for trend <0.001) (Table 3 and Fig. 1A). LDL-C levels of 70–<100 and 100–<130 mg/dL were associated with a significant increase in the incidence of composite outcome, and the HRs were 1.12 (95% CI, 1.07 to 1.17; P<0.001) and 1.20 (95% CI, 1.15 to 1.26; P<0.001), respectively, compared with an LDL-C level of <70 mg/dL.
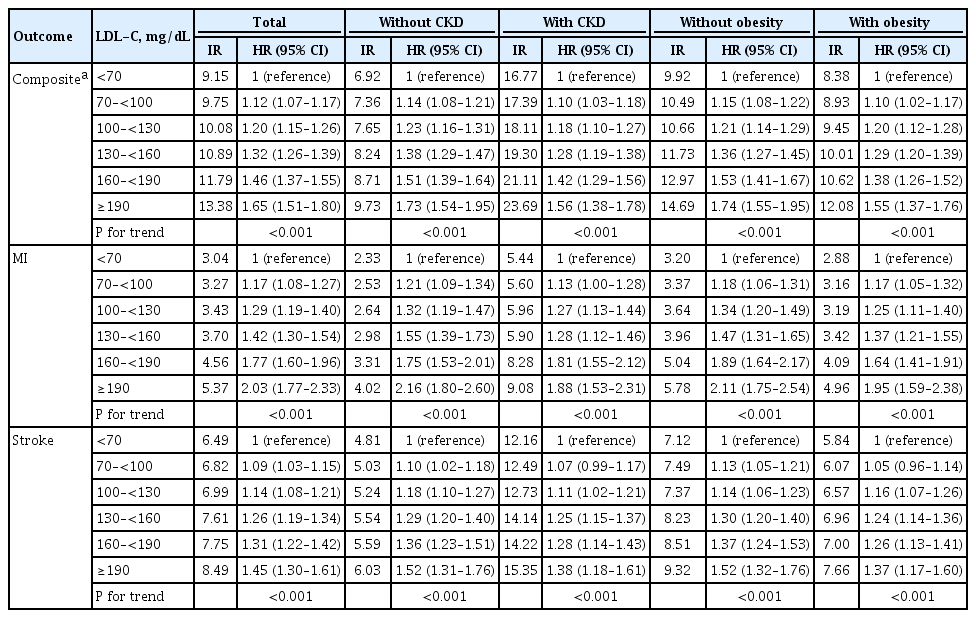
Incidence rate and risk of CVD according to LDL-C levels in subjects with and without CKD or obesity
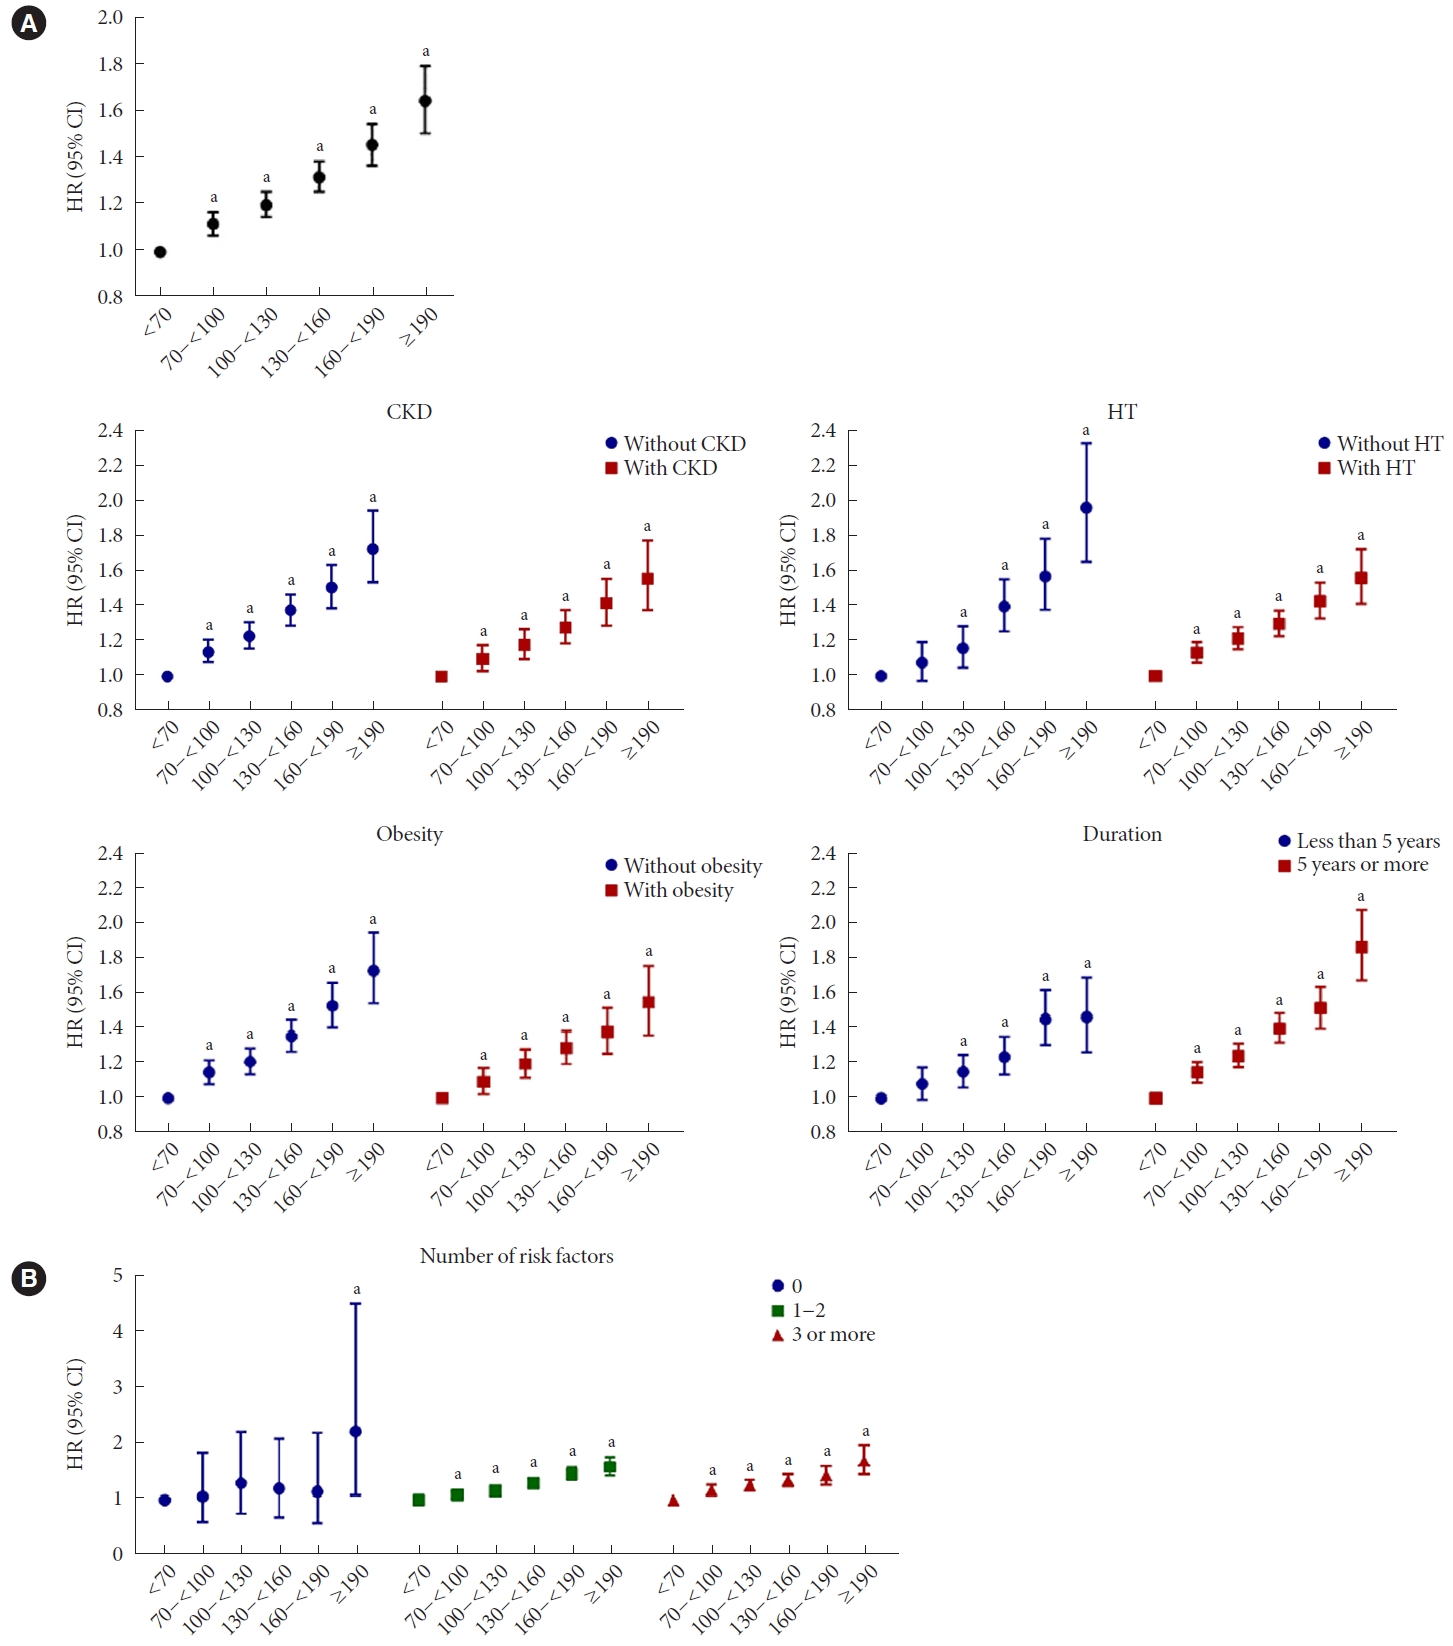
Incidence of cardiovascular disease (CVD) according to low-density lipoprotein cholesterol (LDL-C) levels in total subjects with diabetes mellitus (A) and in those with comorbidities (B). Multivariable Cox proportional hazards regression analysis was performed by adjusting for age, sex, body mass index, hypertension (HT), current smoking, alcohol intake, regular physical activity, estimated glomerular filtration rate, triglyceride-lowering medication, and statin treatment. Risk factors: age (male ≥45 years, female ≥55 years), family history of CVD, HT (systolic blood pressure ≥140 mm Hg or diastolic blood pressure ≥90 mm Hg or taking antihypertensive drugs), current smoking, low high-density lipoprotein cholesterol (<40 mg/dL). HR, hazard ratio; CI, confidence interval. aP<0.001 compared with an LDL-C level of <70 mg/dL.
The risk of composite, MI, and stroke increased linearly from an LDL-C level of ≥70 mg/dL regardless of combined CKD or obesity (Table 3 and Fig. 1B). In T2DM patients without HT or with a DM duration of less than 5 years, the incidence of composite outcome increased from LDL-C level of ≥100 mg/dL (Table 4 and Fig. 1B).

Incidence rate and risk of CVD according to LDL-C levels in subjects with and without HT or more or less than 5 years of DM duration
However, in patients with HT or with a DM duration more than 5 years, CVD risk increased linearly from LDL-C level of ≥70 mg/dL. In terms of the number of risk factors, among people with at least one risk factor, the risk of composite, MI, and stroke increased from an LDL-C level of ≥70 mg/dL (Table 5 and Fig. 1B). In people without risk factors, no significant increase in CVD risk was observed until the LDL-C level was 190 mg/dL.
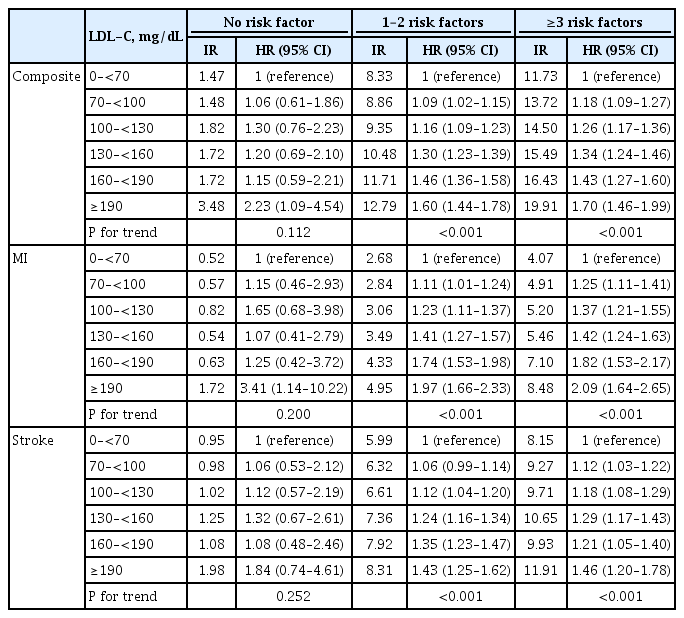
Incidence rate and risk of CVD according to LDL-C levels and number of risk factors
When analysis was performed based on LDL-C level of <55 mg/dL in patients with CKD and three or more risk factors analyzed as very high-risk groups, the risk of composite, MI, and stroke increased linearly from an LDL-C level of ≥55 mg/dL in both groups (Table 6). However, when compared for each category of LDL-C level, the incidence of composite outcome significantly increased from LDL-C level of ≥70 mg/dL in patients with CKD and LDL-C level of ≥55 mg/dL in those with three or more risk factors (Table 6).
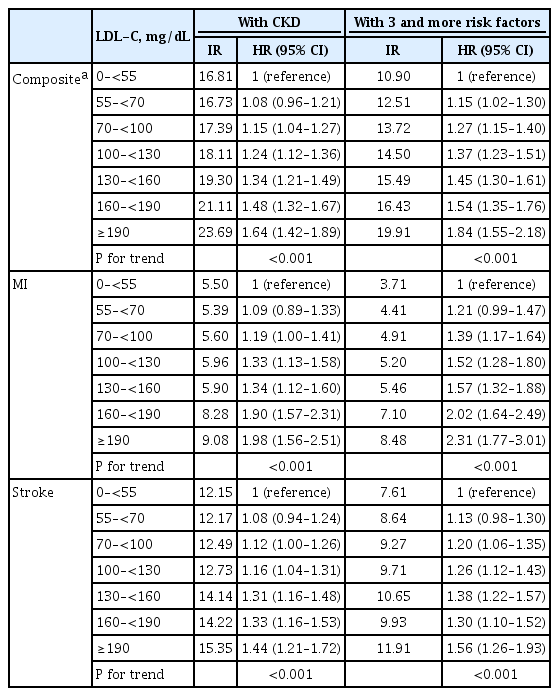
Incidence rate and risk of CVD according to LDL-C levels among people with CKD or 3 and more risk factors (reference by LDL-C <55 mg/dL)
Additional analysis was performed to investigate the association between LDL-C levels and CVD outcomes among statin users and nonusers. The results were consistent regardless of statin use (Supplementary Table 2). The incidence of CVD was the lowest at LDL-C level of <70 mg/dL regardless of statin use and significantly increased with an increase in LDL-C levels although the tendencies were attenuated in statin users.
To evaluate the effects of other types of cholesterol such as HDL-C and TGs on CVD outcomes, we performed additional analyses among subgroups stratified by TG (<200 mg/dL vs. ≥200 mg/dL) or HDL-C concentrations (<40 mg/dL vs. ≥40 mg/dL). The associations between LDL-C levels and CVD outcomes were consistent regardless of HDL-C or TG levels (Supplementary Table 3).
The association LDL-C levels and CV outcomes by different age groups
When we performed analysis regarding the association between LDL-C levels and CVDs according to three different age groups: under 40, 40–75, and over 75 years old. There were 223,438 subjects aged 40 to 75 years, accounting for over 90%, and their results were similar to those of total subjects (Supplementary Table 4).
Among people under 40 years of age, no significant increase in CVD risk was observed until the LDL-C level was 190 mg/dL. Among people over 75 years of age, the incidence of composite outcome increased from LDL-C level of ≥100 mg/dL. However, the increase in HR according to the increase in LDL-C level did not show a strong linear trend compared to that of subjects aged 40 to 75 years.
DISCUSSION
This study showed that the incidence of CVD in Korean people with T2DM accompanying CKD, HT, long duration of DM, and multiple CV risk factors was higher than that of people with T2DM without comorbidities. In addition, the incidence of CVD was the lowest at LDL-C level of <70 mg/dL regardless of comorbidities including CKD, HT, and obesity, and significantly increased with an increase in LDL-C levels. However, in patients with a short duration of DM within 5 years or without HT, the CVD risk significantly increased from LDL-C level of 100 mg/dL. In the case of T2DM patients without CV risk factors, the CVD risk was not high.
In 2018, the KSoLA guidelines for the management of dyslipidemia, patients with DM were classified as high-risk group [4]. The incidence rate of CVD among Korean adults with T2DM and no previous CVD was 10.19 per 1,000 person-years, which was a comparable rate among Korean adults at high risk, which was 10.39 per 1,000 person-years (Supplementary Table 5) [14]. Among the comorbidities evaluated in this study, CKD increased the risk of CVD the most, and the incidence rate among people with CKD was 18.28 per 1,000 person-years, which was similar to the incidence rate of CVD in the very high-risk group reported previously (Supplementary Table 5). As reported in Western studies, CKD, HT, DM duration of 5 years or more, and three or more risk factors were risk enhancing factors among Korean adults with T2DM. The CVD incidence increased in the order of DM duration of 5 years or more, HT, three or more risk factors, and CKD. In particular, it was confirmed that the incidence rate of CVD was the same as that of the very high-risk group with three or more risk factors and it was higher among T2DM patients with CKD than that of the very high-risk group. In T2DM patients without CV risk factors, the incidence rate of CVD was 1.73 per 1,000 person-years, which was lower than that in the moderate-risk group (5.46 per 1,000 person-years) (Supplementary Table 5).
In general, a lower LDL-C goal is recommended in people with a higher risk of CVD. However, in cases of CKD, as eGFR declines, the magnitude of the excess risk associated with increased LDL-C decreases [15]. In addition, dialysis patients with the highest and lowest levels of LDL-C and TC are at the highest risk of CV mortality [16,17]. CV risk is increased even in dialysis patients with higher LDL-C and TC, but target LDL-C level was not suggested in patients with kidney failure because it cannot identify those with low cholesterol who are also at high risk [15]. The 2017 American Association of Clinical Endocrinologists and American College of Endocrinology guidelines for the management of dyslipidemia defined the extreme risk category and recommended a target LDL-C level of <55 mg/dL [8]. It was based on the results of the IMProved Reduction of Outcomes: Vytorin Efficacy International Trial (IMPROVE-IT) and the Further Cardiovascular Outcomes Research With PCSK9 Inhibition in Subjects With Elevated Risk (FOURIER) study [8,18,19]. CKD stages 3 and 4 were included in the extreme risk category [8]. When we re-analyzed LDL-C levels of <55 mg/dL as the reference group among T2DM patients with CKD, the difference in HR was not significant. Although a threshold does not always mean the optimal cutoff level, among Korean T2DM patients with CKD and without prior CVD, the risk of CVD was the lowest at LDL-C <70 mg/dL.
In the case of T2DM patients without CV risk factors, the incidence of CVD was similar to that of the low-risk group, and the CVD risk significantly increased LDL-C levels of >190 mg/dL. However, the number of patients without risk factors was as small as 13,802, and the number of events that occurred among them was 220 cases, which can be insufficient to draw concrete results.
Since previous randomized clinical studies have been conducted on people aged 40 to75 years, there is insufficient evidence for an appropriate target LDL-C level in people of other age groups. Accordingly, in this study, the analysis was conducted by different age groups: under 40, 40–75, and over 75 years old. Among people under 40 years of age, no significant increase in CVD risk was observed until the LDL-C level was 190 mg/dL, which was similar to the results of participants without risk factors. This may mean that the LDL-C level is not so important in this low-risk group, but it may be because the number of subjects under the age of 40 is relatively small (n=8,471), and the number of events is small. Among people over 75 years of age, the incidence of composite outcome increased from LDL-C level of ≥100 mg/dL. However, the increase in HR according to the increase in LDL-C level did not show a strong linear trend compared to that of subjects aged 40 to 75 years. Because the purpose of this study was not to compare the association between LDL-C and CV outcomes by age groups and the number of people under 40 and over 75 years of age was relatively small compared to those aged 40 to 75, we could not draw a concrete conclusion regarding optimal LDL-C levels according to different age groups. However, in Korean people with DM aged 40 to 75 years, the lower the LDL-C, the lower the incidence of CVD and the benefit of low LDL-C level can be also expected in the old people over 75 years of age.
Although we could not evaluate all related factors reported in the European and American lipid treatment guidelines, similar risk factors including CKD, three or more major risk factors, and long duration of diabetes also contributed to increase CVD risk among Korean patients with T2DM. In addition, in most patients with T2DM, the incidence rate of CVD was the lowest at the LDL-C level of less than 70 mg/dL, and in the case of patients with a duration of less than 5 years or without HT, it was the lowest at less than 100 mg/dL. These results are consistent with the recommendations of the ESC guideline. Therefore, although the previous large clinical studies that were the basis of the current KSoLA lipid treatment guidelines were not performed among Koreans, they can be applied to Korean patients with T2DM.
In this study, CVD incidence was lower in obese people with T2DM than in non-obese individuals. Although obesity is a well-established risk factor for CVD, evidence from cohort studies and meta‐analyses suggested that the obesity paradox phenomenon may exist in patients with DM [20,21]. In a study using the Korean National Health Insurance Service-National Health Screening Cohort, overweight or obese people had a lower risk for major adverse CV events and all-cause mortality than those with a normal weight in people with DM [22]. In that study, underweight people had a higher risk for CV death and MI than those with the normal-weight classification. In the present study, underweight people with DM were included among non-obese people, so the incidence of CVD could be lower in obese people. In another study using a nationwide health examination database and claims data in Korea, there was no significant increment in the risk of MI or stroke in obese women with DM. Furthermore, among postmenopausal women with DM, the risks of MI and stroke were significantly lower in women with BMI 25.0 to 29.9 kg/m2 compared to those in women with normal BMI [23]. Although there has been debate whether the obesity paradox really exits, a possible explanation is BMI cannot be a reliable obesity parameter. It cannot discriminate between lean body mass and fat mass and visceral and subcutaneous fat accumulation [24-26]. In addition, obesity can be related to the increased muscle mass and strength represented as physical activity or cardiorespiratory fitness [26]. Therefore, the paradoxical effect of obesity might be attributable to unmeasured confounding factors [25,26]. In addition, HT, or dyslipidemia, which frequently accompany DM as well as obesity, play more important roles in the development of CVD compared to obesity [27,28].
The major limitation of the current study is that the events during the follow-up period were assessed using claims data. Even though the sensitivity and positive predictive values of claims data with identical definitions for CVD as those used in the current study were reported to be as high as 90% in a previous validation study in Korea [29], the findings might have been affected both by underestimation of the real incidence of CVD, especially for ischemic stroke [30], and overestimation due to the low sensitivity of claims-based definitions [9,29]. Second, the primary outcome in this study was a composite of MI and ischemic stroke, and CV mortality could not be evaluated because cause of death was not provided in this database. Third, as this study is a retrospective cohort study, there can be biases to the association between LDL-C levels and CV outcomes. The baseline LDL-C target could be changed during the follow-up, and those with lower baseline LDL-C might have better statin tolerance. Therefore, optimal LDL-C target value obtained by this study could be false positive results. Fourth, only baseline clinical data were considered, and disease severity, comorbid conditions, past medical history, or specific treatment could not be considered due to lack of information. Especially, only baseline LDL-C level was considered as a primary exposure variable. Considering that more patients have been treated during the follow-up period, the LDL-C levels must be changed considerably. However, the changes or actual mean attained LDL-C levels during the 9 years of follow-up were not considered in this study. Therefore, the results of this study provide limited evidence to suggest LDL-C treatment goals. However, when subgroup analyses were performed on statin users, non-users, and statin nonusers at event during the observation period, the same results were obtained in all three groups (Supplementary Table 2). The association between LDL-C levels and CV outcomes was confirmed regardless of statin treatment, especially in subjects who did not take any statin during the observation period (persistent statin nonuser), and the incidence of CVD was the lowest in people with serum LDL-C levels <70 mg/dL. In addition, although we adjusted use of statin as a confounding factor in analyses, the duration of statin treatment could not be considered. Fifth, we did not analyze separately among the people who did or did not take lipid-lowering medications other than statins, such as fibrates or omega 3 fatty acids. Instead, we adjusted the lipid-lowering medication in our model and performed subgroup analyses in terms of hypertriglyceridemia and low HDL-C. Sixth, in this study, antihypertensive medications including angiotensin-converting enzyme inhibitors and angiotensin II receptor blockers, antiplatelet agents, and some anti-diabetes medications including sodium-glucose cotransporter-2 (SGLT2) inhibitors and glucagon-like peptide 1 (GLP-1) receptor agonists that could affect CVD risks were not considered. A long duration of DM is usually defined as DM with a duration of more than 10 or 20 years. In this study, we could only determine the history of taking anti-diabetic drugs up to 7 years ago as of 2009, so we could not define whether the duration of DM was more than 10 years. The number of analyzed subjects was only a fraction of all Korean people with T2DM. Nevertheless, the current study was based on nationwide claims data and enrolled over 200,000 people with DM, and the median follow-up duration reached 9.3 years. In addition to claims data, the current study incorporated baseline clinical characteristics, including biochemical data from health checkups, which could enable adjustments for CVD risk factors.
In conclusion, the CVD incidence was increased when accompanied by CKD or HT, a duration of more than 5 years, and three or more risk factors among Korean people with T2DM. For the primary prevention of CVD in Korean adults with T2DM, it is generally recommended to control LDL-C levels of <70 mg/dL. In patients with CKD or three or more risk factors, a lower LDL-C target may be considered as the incidence of CVD was the lowest at LDL-C <55 mg/dL. In patients with a short duration of DM within 5 years or without HT, an LDL-C goal of <100 mg/dL can be recommended.
SUPPLEMENTARY MATERIALS
Supplementary materials related to this article can be found online at https://doi.org/10.4093/dmj.2021.0344.
Flow chart of the study population. T2DM, type 2 diabetes mellitus; LDL-C, low-density lipoprotein cholesterol.
Baseline characteristics of study population according to comorbidities
Incidence rate and risk of CVD according to LDL-C levels depending on statin treatment
Incidence rate and risk of CVD according to LDL-C levels among subgroups stratified by TG or HDL-C levels
Incidence rate and risk of CVD according to LDL-C levels by different age groups
Incidence rate (confidence interval) of cardiovascular disease according to risk levels
Notes
CONFLICTS OF INTEREST
In-Kyung Jeong was editor in chief of the Diabetes & Metabolism Journal from 2020 to 2021. Jung Hyun Noh was associate editor of the Diabetes & Metabolism Journal from 2020 to 2021. Hyeon Chang Kim has been statistical advisor of the Diabetes & Metabolism Journal since 2021. They were not involved in the review process of this article. Otherwise, there was no conflict of interest.
AUTHOR CONTRIBUTIONS
Conception or design: M.K.M., J.N., E.J.R, I.K.J.
Acquisition, analysis, or interpretation of data: M.K.M., J.N., E.J.R, S.H.P., H.C.K., B.J.K., H.J.K., S.C., J.O.N., Y.Y.H., B.J.K., K.D.H., I.K.J.
Drafting the work or revising: M.K.M., I.K.J.
Final approval of the manuscript: M.K.M., J.N., E.J.R, S.H.P., H.C.K., B.J.K., H.J.K., S.C., J.O.N., Y.Y.H., B.J.K., K.D.H., I.K.J.
FUNDING
The current study was funded by the Korean Society of Lipid and Atherosclerosis (KSoLA) 2019 and supported by the NHIS (NHIS- 2020-1-314).
Acknowledgements
None