- Current
- Browse
- Collections
-
For contributors
- For Authors
- Instructions to authors
- Article processing charge
- e-submission
- For Reviewers
- Instructions for reviewers
- How to become a reviewer
- Best reviewers
- For Readers
- Readership
- Subscription
- Permission guidelines
- About
- Editorial policy
Articles
- Page Path
- HOME > Diabetes Metab J > Volume 47(2); 2023 > Article
-
Original ArticleMetabolic Risk/Epidemiology Metabolic Dysfunction-Associated Fatty Liver Disease and Mortality: A Population-Based Cohort Study
-
Kyung-Soo Kim1
 , Sangmo Hong2, Hong-Yup Ahn3, Cheol-Young Park4
 -
Diabetes & Metabolism Journal 2023;47(2):220-231.
DOI: https://doi.org/10.4093/dmj.2021.0327
Published online: January 12, 2023
1Department of Internal Medicine, CHA Bundang Medical Center, CHA University School of Medicine, Seongnam, Korea
2Department of Internal Medicine, Hanyang University Guri Hospital, Hanyang University College of Medicine, Guri, Korea
3Department of Statistics, Dongguk University, Seoul, Korea
4Department of Internal Medicine, Kangbuk Samsung Hospital, Sungkyunkwan University School of Medicine, Seoul, Korea
-
Corresponding author: Cheol-Young Park Department of Internal Medicine, Kangbuk Samsung Hospital, Sungkyunkwan University School of Medicine, 29 Saemunan-ro, Jongno-gu, Seoul 03181, Korea E-mail: cydoctor@chol.com
Copyright © 2023 Korean Diabetes Association
This is an Open Access article distributed under the terms of the Creative Commons Attribution Non-Commercial License (http://creativecommons.org/licenses/by-nc/4.0/) which permits unrestricted non-commercial use, distribution, and reproduction in any medium, provided the original work is properly cited.
ABSTRACT
-
Background
- We investigated whether metabolic dysfunction-associated fatty liver disease (MAFLD) is associated with an elevated risk of all-cause and cardiovascular mortality using a large-scale health examination cohort.
-
Methods
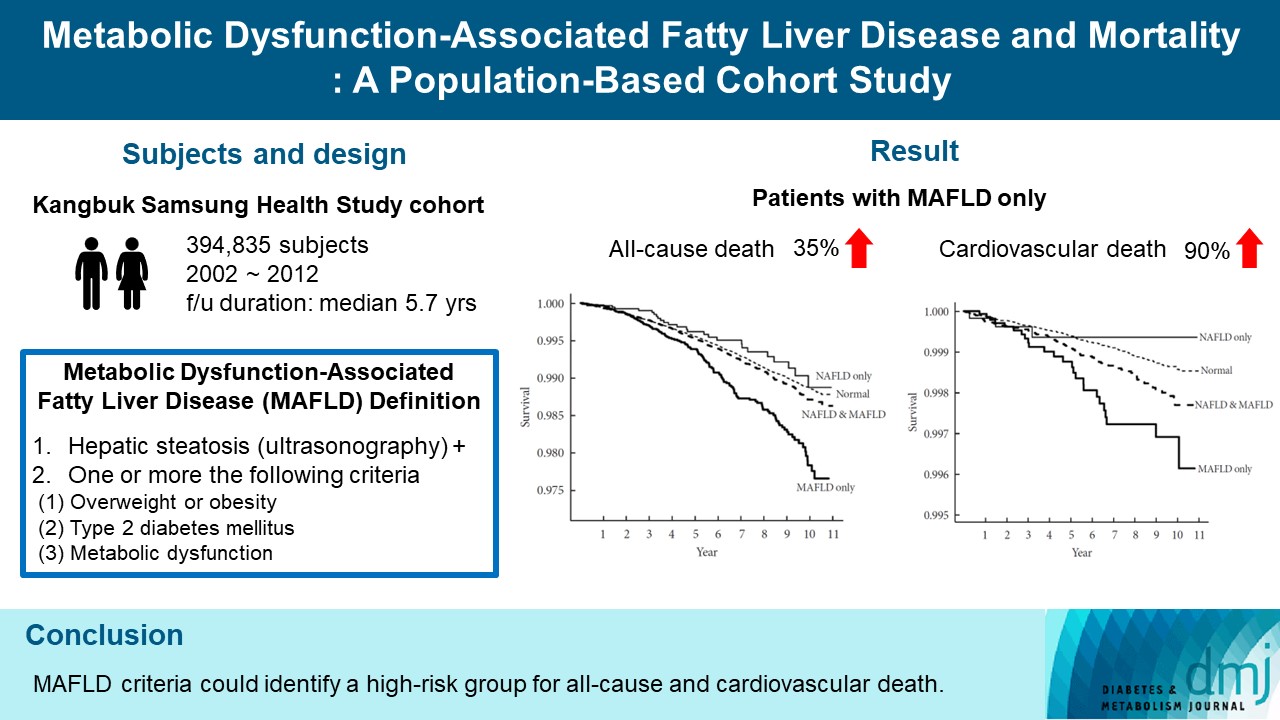
- A total of 394,835 subjects in the Kangbuk Samsung Health Study cohort were enrolled from 2002 to 2012. Participants were categorized by the presence of nonalcoholic fatty liver disease (NAFLD) and MAFLD as follows: normal subjects; patients with both NAFLD and MAFLD; patients with NAFLD only; and patients with MAFLD only. Cox proportional hazards models were used to analyze the risk of mortality.
-
Results
- During a median 5.7 years of follow-up, 20.69% was patients with both NAFLD and MAFLD, 1.51% was patients with NAFLD only, and 4.29% was patients with MAFLD only. All-cause and cardiovascular death was higher in patients with MAFLD than those without MAFLD (P<0.001, respectively). In patients with MAFLD only, the hazard ratio (HR) of all-cause and cardiovascular death was 1.35 (95% confidence interval [CI], 1.13 to 1.60) and 1.90 (95% CI, 1.26 to 2.88) after adjusting for age, which lost its statistical significance by multivariable adjustments. Compared to patients with less than two components of metabolic dysfunction, patients with more than two components of metabolic dysfunction were a higher risk of cardiovascular death (HR, 2.05; 95% CI, 1.25 to 3.38) and only women with more than two components of metabolic dysfunction were a higher risk of all-cause death (HR, 1.44; 95% CI, 1.02 to 2.03).
-
Conclusion
- MAFLD criteria could identify a high-risk group for all-cause and cardiovascular death.
- Nonalcoholic fatty liver disease (NAFLD) affects about a quarter of the population in the world and is increasing the socioeconomic burden of disease [1-3]. NAFLD is associated with various metabolic diseases and an increased risk of morbidity and mortality [4-10]. However, there is an important problem in that the definition of NAFLD does not fully represent the complexity of metabolic dysfunction [11,12], as the diagnosis of NAFLD is solely based on the exclusion of other chronic liver diseases, including excess alcohol intake.
- Recently, metabolic dysfunction-associated fatty liver disease (MAFLD) has been proposed as a more appropriate term to describe liver disease associated with known metabolic dysfunction [13-15]. MAFLD was contrived to represent the hepatic manifestation of a multisystem disorder with metabolic dysfunction and has positive criteria for diagnosis regardless of alcohol consumption or the presence of another concomitant liver disease, unlike NAFLD. The diagnostic criteria of MAFLD have consisted of the evidence for fat accumulation in the liver (hepatic steatosis) in addition to the following three criteria: overweight or obesity, presence of type 2 diabetes mellitus, or evidence of metabolic dysfunction [13-15]. Recent studies reported that the prevalence of MAFLD was 25.9% in United States adults [16] and 31.5% in Chinese adults [17].
- Among many outcome indicators, mortality is the most important factor in assessing the risk of the causative disease. The association between NAFLD and mortality remained controversial [18-20]. Some studies showed that MAFLD was associated with increased risk of cardiovascular disease (CVD) [21] and mortality [16,17], but limitation was that they used old dataset (the third National Health and Nutrition Examination Surveys 1988 to 1994 [NHANES III]) or could not define MAFLD by all diagnostic criteria. In this study, we investigated whether MAFLD is associated with an elevated risk of mortality using a large-scale health examination cohort.
INTRODUCTION
- Study population
- We performed this longitudinal cohort study using the Kangbuk Samsung Health Study cohort consisting of 396,354 adults aged 18 years or older who underwent comprehensive annual or biennial health examinations at the clinics of the Kangbuk Samsung Hospital Total Healthcare Center in Seoul or Suwon, South Korea. We identified participants who underwent comprehensive health screening examinations at Kangbuk Samsung Hospital in Seoul, Korea at least twice between 2002 and 2012. We used the first record as the baseline if a participant had multiple examinations during this period. After excluding participants with missing information (n=1,519), a total of 394,835 subjects were enrolled and followed up for a median of 5.7 years. Approval for the present study protocol (2015-11-016-005) was obtained from the Institutional Review Board of Kangbuk Samsung Hospital. The requirement for informed consent was waived because we did not access personal identifying information.
- Clinical and laboratory measurements
- Complete medical history and physical examinations were performed in which information about patients’ personal medical history and lifestyle factors, including cigarette smoking and alcohol consumption, were obtained using a standardized questionnaire. Details of such health examinations are described elsewhere [20]. Briefly, body mass index (BMI), blood pressure, waist circumference, and blood chemistry were measured. Type 2 diabetes mellitus was defined as the presence of one or more of the following: (1) fasting glucose level ≥126 mg/dL; (2) glycosylated hemoglobin (HbA1c) level ≥6.5%; (3) use of oral hypoglycemic agents or insulin therapy; or (4) a self-reported history of diabetes. Hypertension was defined as systolic blood pressure ≥140 mm Hg, diastolic blood pressure ≥90 mm Hg, or by the use of antihypertensive medications. Hypercholesterolemia was defined as a total cholesterol level ≥240 mg/dL or by the use of lipid-lowering medications. History of CVD (stroke or coronary artery disease) was defined as based on a questionnaire.
- Hepatic steatosis was assessed using abdominal ultrasonography (Logic Q700 MR, GE, Milwaukee, WI, USA) for all subjects at baseline and was defined as an increase in echogenicity of the liver compared with the echogenicity of the renal cortex when the diaphragm and intrahepatic vessels appeared normal. Abdominal ultrasonography was performed by clinical radiologists using a 3.5-MHz probe, and the interobserver and intraobserver reliability values for the diagnosis of fatty liver were very high (Cohen’s k coefficients, 0.74 and 0.94, respectively).
- Definition of NAFLD and MAFLD
- NAFLD was defined as the presence of hepatic steatosis with the following exclusion criteria: viral hepatitis (hepatitis B surface antigen-positivity or hepatitis C virus antibody positivity) or excessive alcohol consumption (≥30 g/day in men or ≥20 g/day in women). MAFLD was defined as the presence of hepatic steatosis with one or more the following criteria: (1) overweight or obesity by the Asia-Pacific criteria (BMI ≥23 kg/m2); (2) type 2 diabetes mellitus; or (3) metabolic dysfunction: at least two metabolic abnormalities among waist circumference ≥90/80 cm in men and women, blood pressure ≥130/85 mm Hg or specific drug treatment, plasma triglycerides ≥150 mg/dL or specific drug treatment, plasma high density lipoprotein (HDL)-cholesterol <40 mg/dL for men and <50 mg/dL for women or specific drug treatment, prediabetes (i.e., fasting plasma glucose levels 100 to 125 mg/dL or HbA1c between 5.7% and 6.4%), homeostasis model assessment of insulin resistance (HOMA-IR) score ≥2.5, or plasma high-sensitivity C-reactive protein (hs-CRP) level >2 mg/L. In this study, we divided the cohort into four groups as follows: (1) normal subjects; (2) patients with both NAFLD and MAFLD; (3) patients with NAFLD only; and (4) patients with MAFLD only.
- We further divided patients with MAFLD into three subgroups: (1) obesity; (2) type 2 diabetes mellitus; and (3) lean with metabolic dysfunction (at least two metabolic abnormalities without obesity and diabetes).
- Mortality assessment
- Death was ascertained based on nationwide death certificates from the National Statistical Office. Mortality follow-up evaluation was performed from January 1, 2002, to December 31, 2012. The causes of death were coded according to the International Classification of Diseases, 10th revision. All-cause and cardiovascular mortalities were investigated.
- Statistical analyses
- Data for categorical factors were reported as percentages, and continuous variables were presented as mean±standard deviation. Kaplan-Meier survival curves were constructed to compare survival rates between various groups. The follow-up time was computed from baseline until the occurrence of death. Cox proportional hazards models with time-dependent coefficients were used to determine the hazard ratio (HR) and its corresponding 95% confidence interval (CI) for all-cause and cardiovascular mortalities. The multivariable model was adjusted for age, daily alcohol consumption, regular physical activity, smoking status, total cholesterol, and statin use. All statistical analyses were performed using R version 3.6.3 (Vienna, Austria; http://www.rproject.org). A P<0.05 was considered statistically significant.
METHODS
- Table 1 showed the baseline characteristics of the study subjects. The mean age was 39.58 years, and the mean BMI was 23.40 kg/m2. Among the study subjects, 20.69% (n=81,697) were patients with both NAFLD and MAFLD, 1.51% (n=5,979) were patients with NAFLD only, and 4.29% (n=16,952) were patients with MAFLD only (Supplementary Fig. 1). Compared to normal subjects, patients with both NAFLD and MAFLD tended to be older men whose BMI and waist circumference were higher. Metabolic parameters, including blood pressure, glucose level, and lipid profiles, were worse in patients with both NAFLD and MAFLD than normal subjects. In patients with NAFLD only, age, BMI, waist circumference, and metabolic parameters were similar to those of normal subjects. In the case of the MAFLD only group, their clinical characteristics were similar to those of patients with both NAFLD and MAFLD, but patients with MAFLD only tended to be more likely male, current smokers and consumed more alcohol in addition to being more likely to have type 2 diabetes mellitus, hypertension, hypercholesterolemia, and viral hepatitis than patients with both NAFLD and MAFLD. Women with NAFLD only, MAFLD only, and both NAFLD and MAFLD were older than men, but normal women was not (Supplementary Table 1).
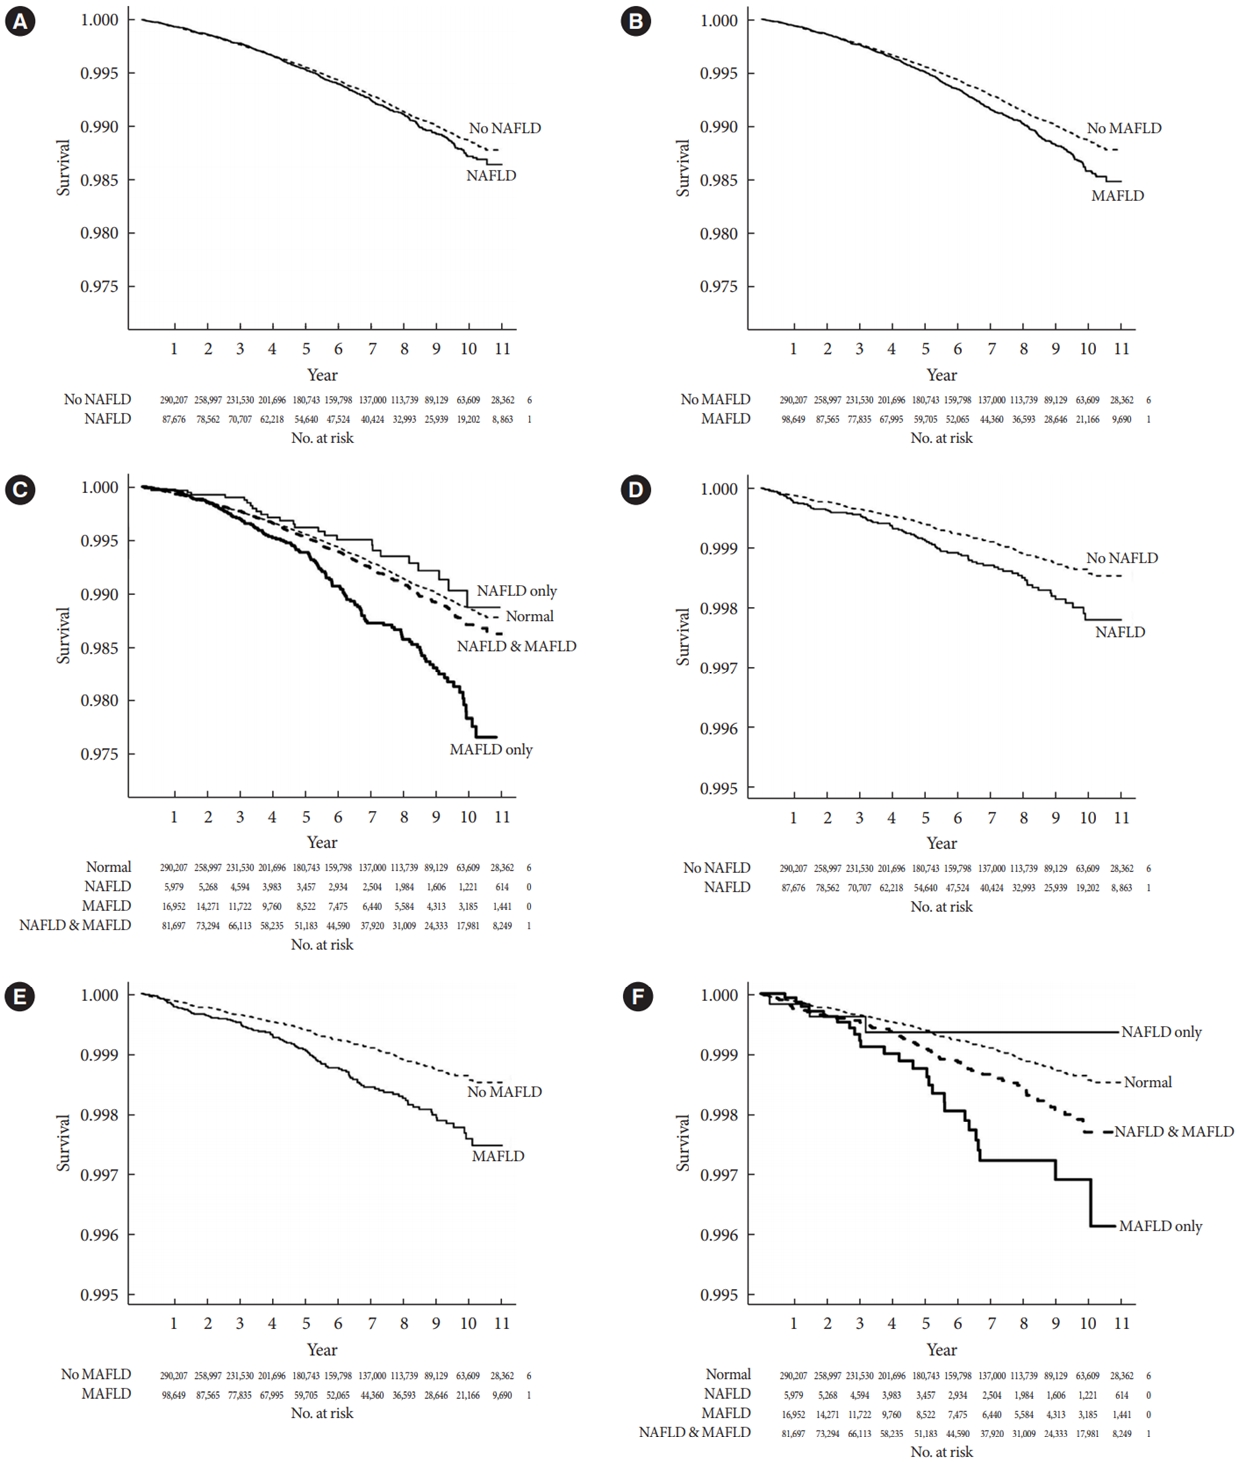
- During a median 5.7-year follow-up, the cumulative allcause and cardiovascular mortalities were 0.41% (1,636 deaths) and 0.05% (212 deaths). All-cause survival was not different between patients with and without NAFLD (Fig. 1A), but patients with MAFLD had shorter all-cause survival compared to patients without MAFLD (P<0.001) (Fig. 1B). Among the four groups, patients with MAFLD only showed the shortest all-cause survival (P<0.001) (Fig. 1C). Patients with NAFLD (P=0.002) (Fig. 1D) and patients with MAFLD (P<0.001) (Fig. 1E) had shorter cardiovascular survival compared to those without NAFLD or MAFLD. Especially, the MAFLD only group had the lowest cardiovascular survival compared to normal subjects, patients with NAFLD only, and patients with both NAFLD and MAFLD (P<0.001) (Fig. 1F).
- The incidence rate for all-cause death was lowest in patients with NAFLD only (0.848 per 1,000 person-years) and highest in patients with MAFLD only (1.686 per 1,000 person-years) (Table 2). The risk of all-cause death in patients with NAFLD only was not increased in both crude and adjusted models. However, the risk of all-cause death was 1.67 times higher in patients with MAFLD only than in normal subjects, but there was no difference in the risk of all-cause death between patients with both NAFLD and MAFLD and patients with NAFLD only. After adjustment for age, patients with MAFLD only were still at higher risk (HR, 1.35; 95% CI, 1.13 to 1.60) for all-cause death than normal subjects, but statistical significance disappeared after adjusting for age, daily alcohol consumption, regular physical activity, smoking status, total cholesterol and statin use. In patients with both NAFLD and MAFLD, the risk for all-cause death was lower than that of normal subjects after age and multivariable adjustments (HR, 0.86; 95% CI, 0.78 to 0.96). In men, the risk of all-cause death of patients with NAFLD only and MAFLD only was not high compared with normal men, but men with both NAFLD and MAFLD showed low risk for all-cause mortality than normal men. However, women with MAFLD only were at two fold higher risk (95% CI, 1.20 to 3.34) for all-cause death than normal subjects after multivariable adjustment.
- A similar trend was shown in the risk of cardiovascular death (Table 3). The incidence rate for cardiovascular death was the lowest in patients with NAFLD only (0.098 per 1,000 person-years) and the highest in patients with MAFLD only (0.312 per 1,000 person-years). The risks of cardiovascular death in patients with both NAFLD and MAFLD and patients with NAFLD only were not different with normal subjects. In patients with MAFLD only, the crude HR and age-adjusted HR for cardiovascular death were 2.35 (95% CI, 1.55 to 3.56) and 1.90 (95% CI, 1.26 to 2.88), but multivariable-adjusted HR was not significantly high. In men, the risk for cardiovascular death was not different among four groups. However, an increased risk for cardiovascular death was observed in women (crude HR, 8.04; age-adjusted HR, 3.38), but this association was not significant after multivariable adjustment.
- Patients who have obesity, type 2 diabetes mellitus, or were lean with metabolic dysfunction were not associated with all-cause and cardiovascular death (Supplementary Tables 2 and 3). Women with more than two components of metabolic dysfunction were a higher risk of all-cause death (HR, 1.44; 95% CI, 1.02 to 2.03) compared with women with less than two components of metabolic dysfunction, but not in men (Table 4). In addition, patients with more than two components of metabolic dysfunction were a higher risk of cardiovascular death than those with less than two components of metabolic dysfunction (HR, 2.05; 95% CI, 1.25 to 3.38). This association was also shown in men (HR, 2.06; 95% CI, 1.19 to 3.56), but not in women.
- Subgroup analyses stratified by sex, age, physical activity, smoking status, and total cholesterol were performed (Fig. 2). Among them, the risks of all-cause and cardiovascular death in women with NAFLD (Fig. 2A and B) and women with MAFLD (Fig. 2C and D) were tended to be higher than in men.
RESULTS
- In this study, we showed that all-cause and cardiovascular death was higher in patients with MAFLD than those without MAFLD using a large-scale health examination cohort. Furthermore, patients with MAFLD only showed the lowest all-cause and cardiovascular survival among four groups. The risk of all-cause and cardiovascular death was higher in patients with MAFLD only than normal subjects after adjusting for age. Patients with more than two components of metabolic dysfunction were a higher risk of all-cause (only in women) and cardiovascular death than those with less than two components of metabolic dysfunction. These results demonstrated that MAFLD criteria could identify a high-risk group for allcause and cardiovascular death.
- Several studies investigated the prevalence of MAFLD compared to NAFLD [12,21,22]. A study conducted in 765 Japanese patients with fatty liver disease noticed that the prevalence of MAFLD and NAFLD were 79.6% and 70.7%, respectively [22]. In a Chinese cohort study from 2006 to 2012, the prevalence of MAFLD was 31.5% [17]. In Korea, the prevalence of NAFLD and MAFLD were 28.0% and 37.3%, respectively, among 8,962,813 participants aged 40 to 64 years in the nationwide health screening database [21]. However, these studies had a limitation in that MAFLD could not be exactly diagnosed because some data was not available, such as laboratory findings (e.g., waist circumference, HOMA-IR, or hs-CRP) or ultrasonography. The prevalence of MAFLD and NAFLD were 31.24% and 33.23%, respectively, among 13,083 patients of NHANES III [12]. Although NHANES III is an old dataset, it is the only survey containing the results of both liver ultrasonography and biochemical examinations, so it was used to perform analysis. In this study, we evaluated MAFLD by liver ultrasonography plus all components of metabolic dysfunction and used a more recent dataset than NHANES III. The prevalence of MAFLD and NAFLD were 24.89% and 22.20%, respectively and were relatively lower than previous studies. A possible reason might be that participants were younger (mean age, 39.58 years) and have lower BMI (mean BMI, 23.40 kg/m2) than the participants of previous studies. The prevalence of NAFLD or MAFLD was low in women because 81.44% of women were under 50 years old. In this study, the prevalence of NAFLD or MAFLD in women under 50 years old and over 50 years old was 8.75% and 32.16%, respectively. The difference in prevalence of NAFLD or MAFLD according to age in women was similar to that of previous studies. Another possible explanation may be because, unlike other studies, all criteria were used for the diagnosis of MAFLD in this study.
- Several studies have reported that MAFLD was associated with an increased risk of CVDs and death. Kim et al. [16] found that individuals with MAFLD had a 17% higher risk of all-cause mortality during a median follow-up of 23 years. In a Chinese cohort study, the MAFLD only group had higher mortality that the NAFLD only in males aged ≥60 (adjusted HR, 1.43; 95% CI, 1.00 to 2.03) and lower risk in males aged 40 to 59 (adjusted HR, 0.65; 95% CI, 0.48 to 0.90) [17]. A study performed in middle-aged Korean adults shown that multivariable-adjusted HRs for CVD events were 1.43 in patients with MAFLD only and 1.56 in patients with NAFLD and MAFLD [21]. They evaluated all criteria for metabolic dysfunction, but hepatic steatosis was defined by fatty liver index instead of histology or ultrasonography. In this study, we evaluated MAFLD by liver ultrasonography plus all components of metabolic dysfunction and investigated an association between MAFLD and mortality. As a result of this study, we showed that all-cause and cardiovascular death was higher in patients with MAFLD than those without MAFLD. In addition, patients with MAFLD only showed the lowest all-cause and cardiovascular survival among four groups. Almost all patients with MAFLD also shared the characteristics of NAFLD, but 4.29% of patients had only MAFLD characteristics and an elevated risk of death. Patients with MAFLD only had poor metabolic parameters, more alcohol consumption, and were more likely to be current smokers. Naturally, the patients with MAFLD only had the characteristics of fatty liver disease as well as viral hepatitis or alcohol consumption. This result was compatible with previous studies that dual etiology, which is fatty liver plus concomitant liver disease or alcohol consumption, might influence the elevated risk for CVD or death [23,24]. Especially in our study, viral hepatitis was associated with an elevated risk for all-cause death in patients with MAFLD only, but excessive alcohol consumption was not (Supplementary Table 4). Recently, Nguyen et al. [25] reported that non-NAFLD MAFLD was significantly and independently associated with higher risk for all-cause mortality (HR, 2.4; 95% CI, 1.2 to 4.6) compared with non-MAFLD NAFLD.
- Aforementioned Chinese study showed that MAFLD patients with diabetes and metabolic dysregulation were related to higher mortality than those without MAFLD [17]. The association between each diagnostic criterion of MAFLD (obesity, type 2 diabetes mellitus, and lean with metabolic dysfunction) and mortality was not significant in this study. We could not explain the reason, but it might be that events were not sufficient. However, patients with more than two components of metabolic dysfunction were a higher risk of all-cause (only in women) and cardiovascular death than those with less than two components of metabolic dysfunction. More specifically, high blood pressure, prediabetes, high hs-CRP, and high HOMA-IR were associated with an elevated risk for all-cause death, and low HDL-cholesterol, high blood pressure, and high HOMA-IR was associated with an elevated risk for cardiovascular death (Supplementary Table 5). This is consistent with previous studies that MAFLD criteria can discriminate high-risk patients more effectively compared with NAFLD criteria [12].
- The risk of mortality was not elevated, even showed a decreasing trend, in patients with NAFLD only compared with normal subjects in this study. This was also consistent with previous studies that NAFLD without metabolic dysfunction was not associated with an increased risk for CVD or death [11,12]. This would be because NAFLD is consisted of wide range status from simple steatosis to advanced fibrosis with diverse metabolic profiles, so that NAFLD per se is not associated with an increase mortality [16,26,27]. Consequently, metabolic dysfunction is an important risk factor for poor outcomes of fatty liver disease, and the concept of MAFLD could successfully screen high-risk patients. Furthermore, in this study, patients with both NAFLD and MAFLD had a lower risk for all-cause death than that of normal subjects after age and multivariable adjustments. We could not explain exactly about this result, but a possible explanation is that fatty liver of them might have been a simple steatosis rather than an advanced fibrosis because study population was relatively young and non-obese.
- Interestingly, the association between elevated risk of mortality and MAFLD was prominent in women but not in men. It is not easy to explain clearly why these associations were different in men and women. So far, most studies for NAFLD have also failed to appropriately examine sex differences [28]. Energy metabolism, adiposity, and hormone function are possible candidates for the explanation of sex difference, but further studies are warranted. In this study, this difference might have been because more women were identified as normal subjects, so there were fewer women in the NAFLD only, MAFLD only, and both NAFLD and MAFLD groups. In addition, women with NAFLD only, MAFLD only, or both NAFLD and MAFLD were older than normal women. Especially, women in the MAFLD only group were more likely to be current smokers, have high alcohol consumption, and viral hepatitis than women of the other groups. Estrogen status might be one of the most important factors for this difference [29]. Although we could not know the menopausal status due to limited data, women under 50 years old who were usually not likely to be menopause were 81.44% (Supplementary Table 6). However, women with MAFLD only were 0.50% of women under 50 years old and 1.50% of women over 50 years old. Not only in general, but also in this study, men were more likely to be smokers and drinkers, did less regular physical activity, and had more hypertension and hypercholesterolemia compared to women. These differences in characteristics between men and women might have influenced why the clinical impact of MAFLD was stronger in women than men. Our previous study conducted in the same cohort had shown that NAFLD was associated with increased mortality in women, not in men, despite the exclusion of those with high alcohol consumption or viral hepatitis [20].
- There are several reasons why MAFLD is introduced. NAFLD can be diagnosed after the exclusion of viral hepatitis, autoimmune disease, and alcohol, but many studies have shown that these conditions have synergistic effects with fatty liver disease in terms of disease progression [23,24]. In addition, another problem with the definition of NAFLD is that there is no consensus on the safe limit of alcohol intake [30]; it is difficult to determine how much alcohol is not harmful. Furthermore, because information regarding alcohol consumption is usually collected by questionnaires [31,32], measuring alcohol consumption might not be accurate due to recall bias and patient underreporting. The heterogeneous nature and pathophysiologic feature of fatty liver disease also support the definition and nomenclature of MAFLD [33-35].
- Several limitations need to be considered in the interpretation of this study. First, because MAFLD was defined at a single baseline assessment, we could not evaluate the effects of dynamic changes in metabolic parameters. Second, the allcause (0.41%) and cardiovascular (0.05%) mortality rates were relatively low. This might be because the participants tended to be young, otherwise healthy, and regularly received comprehensive health screenings. Third, we did not have information on several factors such as medications, diet, or mental health, which might have influenced the association between MAFLD and mortality. Finally, this study should be interpreted with caution when applied to other ethnicities because this study was conducted in Koreans. This study, however, is valuable because we evaluated the association between the presence of MAFLD and mortality using a large-scale health examination cohort and used the all criteria necessary for MAFLD diagnosis.
- In conclusion, MAFLD criteria could identify a high-risk group for all-cause and cardiovascular death. Therefore, we should pay attention to manage patients with MAFLD.
DISCUSSION
SUPPLEMENTARY MATERIALS
Supplementary Fig. 1.
Supplementary Table 1.
Supplementary Table. 2.
Supplementary Table. 3.
Supplementary Table. 4.
Supplementary Table. 5.
Supplementary Table. 6.
-
CONFLICTS OF INTEREST
No potential conflict of interest relevant to this article was reported.
-
AUTHOR CONTRIBUTIONS
Conception or design: K.S.K., C.Y.P.
Acquisition, analysis, or interpretations of data: K.S.K., S.H., H.Y.A., C.Y.P.
Drafting the work or revising: K.S.K., S.H., H.Y.A., C.Y.P.
Final approval of the manuscript: K.S.K., S.H., H.Y.A., C.Y.P.
-
FUNDING
None
NOTES
-
Acknowledgements
- None


Values are presented as mean±standard deviation or percentage (number).
NAFLD, nonalcoholic fatty liver disease; MAFLD, metabolic dysfunction-associated fatty liver disease; HBsAg, hepatitis B surface antigen; HCV, hepatitis C virus; HbA1c, glycosylated hemoglobin; HDL, high density lipoprotein; LDL, low density lipoprotein; HOMA-IR, homeostasis model assessment of insulin resistance.
| Variable | Normal | NAFLD only | MAFLD only | NAFLD and MAFLD | |
|---|---|---|---|---|---|
| All | |||||
| Events | 1,636 | 26 | 135 | 498 | |
| Person-years | 15,911,948.6 | 30,648.0 | 80,086.2 | 449,175.3 | |
| Incidence rate (per 1,000 person-years) | 1.028 | 0.848 | 1.686 | 1.109 | |
| Crude HR | 1.0 (ref) | 0.84 (0.57–1.23) | 1.67 (1.40–1.99) | 1.08 (0.98–1.20) | |
| Age-adjusted HR | 1.0 (ref) | 0.94 (0.64–1.38) | 1.35 (1.13–1.60) | 0.80 (0.72–0.88) | |
| Multivariable-adjusteda HR | 1.0 (ref) | 0.98 (0.66–1.46) | 0.96 (0.80–1.16) | 0.86 (0.78–0.96) | |
| Men | |||||
| Events | 1,114 | 21 | 118 | 363 | |
| Person-years | 789,744.6 | 21,865.1 | 75,141.1 | 345,628.7 | |
| Incidence rate (per 1,000 person-years) | 1.411 | 0.960 | 1.570 | 1.050 | |
| Crude HR | 1.0 (ref) | 0.70 (0.45–1.07) | 1.14 (0.94–1.38) | 0.75 (0.67–0.85) | |
| Age-adjusted HR | 1.0 (ref) | 0.91 (0.59–1.41) | 0.98 (0.81–1.18) | 0.75 (0.67–0.85) | |
| Multivariable-adjusteda HR | 1.0 (ref) | 0.95 (0.61–1.48) | 0.87 (0.71–1.06) | 0.83 (0.73–0.93) | |
| Women | |||||
| Events | 522 | 5 | 17 | 135 | |
| Person-years | 802,204.1 | 8,782.9 | 4,945.2 | 103,546.6 | |
| Incidence rate (per 1,000 person-years) | 0.651 | 0.569 | 0.536 | 1.304 | |
| Crude HR | 1.0 (ref) | 0.90 (0.37–2.16) | 5.57 (3.44–9.03) | 2.02 (1.67–2.44) | |
| Age-adjusted HR | 1.0 (ref) | 0.76 (0.31–1.83) | 2.68 (1.65–4.35) | 0.85 (0.70–1.03) | |
| Multivariable-adjusteda HR | 1.0 (ref) | 0.88 (0.36–2.11) | 2.00 (1.20–3.34) | 0.91 (0.74–1.11) | |
| Variable | Normal | NAFLD only | MAFLD only | NAFLD and MAFLD | |
|---|---|---|---|---|---|
| All | |||||
| Events | 212 | 3 | 25 | 90 | |
| Person-years | 15,911,948.6 | 30,648.0 | 80,086.2 | 449,175.3 | |
| Incidence rate (per 1,000 person-years) | 0.133 | 0.098 | 0.312 | 0.200 | |
| Crude HR | 1.0 (ref) | 0.74 (0.24–2.31) | 2.35 (1.55–3.56) | 1.51 (1.18–1.93) | |
| Age-adjusted HR | 1.0 (ref) | 0.84 (0.27–2.63) | 1.90 (1.26–2.88) | 1.09 (0.85–1.39) | |
| Multivariable-adjusteda HR | 1.0 (ref) | 0.87 (0.28–2.74) | 1.18 (0.77–1.83) | 1.13 (0.87–1.46) | |
| Men | |||||
| Events | 149 | 2 | 22 | 67 | |
| Person-years | 789,744.6 | 21,865.1 | 75,141.1 | 345,628.7 | |
| Incidence rate (per 1,000 person-years) | 0.189 | 0.091 | 0.293 | 0.194 | |
| Crude HR | 1.0 (ref) | 0.49 (0.12–1.97) | 1.55 (0.99–2.43) | 1.03 (0.77–1.38) | |
| Age-adjusted HR | 1.0 (ref) | 0.64 (0.16–2.58) | 1.35 (0.86–2.11) | 1.03 (0.77–1.37) | |
| Multivariable-adjusteda HR | 1.0 (ref) | 0.70 (0.17–2.81) | 1.05 (0.66–1.67) | 1.12 (0.83–1.52) | |
| Women | |||||
| Events | 63 | 1 | 3 | 23 | |
| Person-years | 802,204.1 | 8,782.9 | 4,945.2 | 103,546.6 | |
| Incidence rate (per 1,000 person-years) | 0.079 | 0.114 | 0.607 | 0.222 | |
| Crude HR | 1.0 (ref) | 1.48 (0.21–10.67) | 8.04 (2.52–25.61) | 2.85 (1.77–4.59) | |
| Age-adjusted HR | 1.0 (ref) | 1.24 (0.17–8.94) | 3.38 (1.06–10.80) | 0.97 (0.59–1.59) | |
| Multivariable-adjusteda HR | 1.0 (ref) | 1.39 (0.19–10.10) | 2.69 (0.80–9.04) | 0.95 (0.57–1.61) | |
| Variable |
Number of metabolic dysfunction |
||||
|---|---|---|---|---|---|
|
All-cause death |
Cardiovascular death |
||||
| <2 | ≥2 | <2 | ≥2 | ||
| All | |||||
| Crude HR | 1.0 (ref) | 2.02 (1.75–2.34) | 1.0 (ref) | 4.11 (2.51–6.72) | |
| Age-adjusted HR | 1.0 (ref) | 1.12 (0.97–1.30) | 1.0 (ref) | 2.30 (1.40–3.78) | |
| Multivariable-adjusteda HR | 1.0 (ref) | 1.09 (0.94–1.27) | 1.0 (ref) | 2.05 (1.25–3.38) | |
| Men | |||||
| Crude HR | 1.0 (ref) | 1.81 (1.54–2.12) | 1.0 (ref) | 3.72 (2.16–6.41) | |
| Age-adjusted HR | 1.0 (ref) | 1.07 (0.91–1.26) | 1.0 (ref) | 2.31 (1.34–3.99) | |
| Multivariable-adjusteda HR | 1.0 (ref) | 1.05 (0.89–1.23) | 1.0 (ref) | 2.06 (1.19–3.56) | |
| Women | |||||
| Crude HR | 1.0 (ref) | 2.95 (2.14–4.07) | 1.0 (ref) | 6.05 (1.90–19.31) | |
| Age-adjusted HR | 1.0 (ref) | 1.39 (1.00–1.94) | 1.0 (ref) | 2.21 (0.68–7.18) | |
| Multivariable-adjusteda HR | 1.0 (ref) | 1.44 (1.02–2.03) | 1.0 (ref) | 2.05 (0.63–6.72) | |
- 1. Younossi ZM, Koenig AB, Abdelatif D, Fazel Y, Henry L, Wymer M. Global epidemiology of nonalcoholic fatty liver disease: meta-analytic assessment of prevalence, incidence, and outcomes. Hepatology 2016;64:73-84.ArticlePubMed
- 2. Lee YH, Cho Y, Lee BW, Park CY, Lee DH, Cha BS, et al. Non-alcoholic fatty liver disease in diabetes. Part I: epidemiology and diagnosis. Diabetes Metab J 2019;43:31-45.ArticlePubMedPMCPDF
- 3. Rhee EJ. Nonalcoholic fatty liver disease and diabetes: an epidemiological perspective. Endocrinol Metab (Seoul) 2019;34:226-33.ArticlePubMedPMCPDF
- 4. Targher G, Byrne CD, Lonardo A, Zoppini G, Barbui C. Nonalcoholic fatty liver disease and risk of incident cardiovascular disease: a meta-analysis. J Hepatol 2016;65:589-600.ArticlePubMed
- 5. Anstee QM, Mantovani A, Tilg H, Targher G. Risk of cardiomyopathy and cardiac arrhythmias in patients with nonalcoholic fatty liver disease. Nat Rev Gastroenterol Hepatol 2018;15:425-39.ArticlePubMedPDF
- 6. Han JM, Kim HI, Lee YJ, Lee JW, Kim KM, Bae JC. Differing associations between fatty liver and dyslipidemia according to the degree of hepatic steatosis in Korea. J Lipid Atheroscler 2019;8:258-66.ArticlePubMedPMCPDF
- 7. Chung GE, Kim MJ, Yim JY, Kim JS, Yoon JW. Sarcopenia is significantly associated with presence and severity of nonalcoholic fatty liver disease. J Obes Metab Syndr 2019;28:129-38.PubMedPMC
- 8. Li F, Ye J, Sun Y, Lin Y, Wu T, Shao C, et al. Distinct dose-dependent association of free fatty acids with diabetes development in nonalcoholic fatty liver disease patients. Diabetes Metab J 2021;45:417-29.ArticlePubMedPMCPDF
- 9. Kim KS, Lee BW, Kim YJ, Lee DH, Cha BS, Park CY. Nonalcoholic fatty liver disease and diabetes. Part II: treatment. Diabetes Metab J 2019;43:127-43.ArticlePubMedPMCPDF
- 10. Lee H, Kim G, Choi YJ, Huh BW, Lee BW, Kang ES, et al. Association between non-alcoholic steatohepatitis and left ventricular diastolic dysfunction in type 2 diabetes mellitus. Diabetes Metab J 2020;44:267-76.ArticlePubMedPMCPDF
- 11. Lee YH, Kim KJ, Yoo ME, Kim G, Yoon HJ, Jo K, et al. Association of non-alcoholic steatohepatitis with subclinical myocardial dysfunction in non-cirrhotic patients. J Hepatol 2018;68:764-72.ArticlePubMed
- 12. Lin S, Huang J, Wang M, Kumar R, Liu Y, Liu S, et al. Comparison of MAFLD and NAFLD diagnostic criteria in real world. Liver Int 2020;40:2082-9.ArticlePubMedPDF
- 13. Eslam M, Newsome PN, Sarin SK, Anstee QM, Targher G, Romero-Gomez M, et al. A new definition for metabolic dysfunction-associated fatty liver disease: an international expert consensus statement. J Hepatol 2020;73:202-9.ArticlePubMed
- 14. Eslam M, Sanyal AJ, George J; International Consensus Panel. MAFLD: a consensus-driven proposed nomenclature for metabolic associated fatty liver disease. Gastroenterology 2020;158:1999-2014.ArticlePubMed
- 15. Eslam M, Sarin SK, Wong VW, Fan JG, Kawaguchi T, Ahn SH, et al. The Asian Pacific Association for the Study of the Liver clinical practice guidelines for the diagnosis and management of metabolic associated fatty liver disease. Hepatol Int 2020;14:889-919.ArticlePubMedPDF
- 16. Kim D, Konyn P, Sandhu KK, Dennis BB, Cheung AC, Ahmed A. Metabolic dysfunction-associated fatty liver disease is associated with increased all-cause mortality in the United States. J Hepatol 2021;75:1284-91.ArticlePubMed
- 17. Wang X, Wu S, Yuan X, Chen S, Fu Q, Sun Y, et al. Metabolic dysfunction-associated fatty liver disease and mortality among Chinese adults: a prospective cohort study. J Clin Endocrinol Metab 2022;107:e745-55.ArticlePubMedPDF
- 18. Angulo P, Kleiner DE, Dam-Larsen S, Adams LA, Bjornsson ES, Charatcharoenwitthaya P, et al. Liver fibrosis, but no other histologic features, is associated with long-term outcomes of patients with nonalcoholic fatty liver disease. Gastroenterology 2015;149:389-97.ArticlePubMedPMC
- 19. Ekstedt M, Hagstrom H, Nasr P, Fredrikson M, Stal P, Kechagias S, et al. Fibrosis stage is the strongest predictor for disease-specific mortality in NAFLD after up to 33 years of follow-up. Hepatology 2015;61:1547-54.ArticlePubMed
- 20. Hwang YC, Ahn HY, Park SW, Park CY. Nonalcoholic fatty liver disease associates with increased overall mortality and death from cancer, cardiovascular disease, and liver disease in women but not men. Clin Gastroenterol Hepatol 2018;16:1131-7.ArticlePubMed
- 21. Lee H, Lee YH, Kim SU, Kim HC. Metabolic dysfunction-associated fatty liver disease and incident cardiovascular disease risk: a nationwide cohort study. Clin Gastroenterol Hepatol 2021;19:2138-47.ArticlePubMed
- 22. Yamamura S, Eslam M, Kawaguchi T, Tsutsumi T, Nakano D, Yoshinaga S, et al. MAFLD identifies patients with significant hepatic fibrosis better than NAFLD. Liver Int 2020;40:3018-30.ArticlePubMedPDF
- 23. Chiang DJ, McCullough AJ. The impact of obesity and metabolic syndrome on alcoholic liver disease. Clin Liver Dis 2014;18:157-63.ArticlePubMedPMC
- 24. Choi HS, Brouwer WP, Zanjir WM, de Man RA, Feld JJ, Hansen BE, et al. Nonalcoholic steatohepatitis is associated with liver-related outcomes and all-cause mortality in chronic hepatitis B. Hepatology 2020;71:539-48.ArticlePubMedPDF
- 25. Nguyen VH, Le MH, Cheung RC, Nguyen MH. Differential clinical characteristics and mortality outcomes in persons with NAFLD and/or MAFLD. Clin Gastroenterol Hepatol 2021;19:2172-81.ArticlePubMed
- 26. Jeong SW. Nonalcoholic fatty liver disease: a drug revolution is coming. Diabetes Metab J 2020;44:640-57.ArticlePubMedPMCPDF
- 27. Lee DH. Noninvasive evaluation of nonalcoholic fatty liver disease. Endocrinol Metab (Seoul) 2020;35:243-59.ArticlePubMedPMCPDF
- 28. Lonardo A, Nascimbeni F, Ballestri S, Fairweather D, Win S, Than TA, et al. Sex differences in nonalcoholic fatty liver disease: state of the art and identification of research gaps. Hepatology 2019;70:1457-69.ArticlePubMedPMCPDF
- 29. Maas AH, Rosano G, Cifkova R, Chieffo A, van Dijken D, Hamoda H, et al. Cardiovascular health after menopause transition, pregnancy disorders, and other gynaecologic conditions: a consensus document from European cardiologists, gynaecologists, and endocrinologists. Eur Heart J 2021;42:967-84.ArticlePubMedPMCPDF
- 30. Eslam M, Sanyal AJ, George J. Toward more accurate nomenclature for fatty liver diseases. Gastroenterology 2019;157:590-3.ArticlePubMed
- 31. Jung CH, Rhee EJ, Kwon H, Chang Y, Ryu S, Lee WY. Visceral-to-subcutaneous abdominal fat ratio is associated with nonalcoholic fatty liver disease and liver fibrosis. Endocrinol Metab (Seoul) 2020;35:165-76.ArticlePubMedPMCPDF
- 32. Lee SB, Kim MK, Kang S, Park K, Kim JH, Baik SJ, et al. Triglyceride glucose index is superior to the homeostasis model assessment of insulin resistance for predicting nonalcoholic fatty liver disease in Korean adults. Endocrinol Metab (Seoul) 2019;34:179-86.ArticlePubMedPMCPDF
- 33. Byrne CD, Targher G. NAFLD: a multisystem disease. J Hepatol 2015;62(1 Suppl):S47-64.Article
- 34. Vilar-Gomez E, Calzadilla-Bertot L, Wai-Sun Wong V, Castellanos M, Aller-de la Fuente R, Metwally M, et al. Fibrosis severity as a determinant of cause-specific mortality in patients with advanced nonalcoholic fatty liver disease: a multi-national cohort study. Gastroenterology 2018;155:443-57.ArticlePubMed
- 35. Pelusi S, Cespiati A, Rametta R, Pennisi G, Mannisto V, Rosso C, et al. Prevalence and risk factors of significant fibrosis in patients with nonalcoholic fatty liver without steatohepatitis. Clin Gastroenterol Hepatol 2019;17:2310-9.ArticlePubMed
REFERENCES
Figure & Data
References
Citations
- Mortality in metabolic dysfunction-associated steatotic liver disease: A nationwide population-based cohort study
Eugene Han, Byung-Wan Lee, Eun Seok Kang, Bong-Soo Cha, Sang Hoon Ahn, Yong-ho Lee, Seung Up Kim
Metabolism.2024; 152: 155789. CrossRef - Association of non-alcoholic fatty liver disease with cardiovascular disease and all cause death in patients with type 2 diabetes mellitus: nationwide population based study
Kyung-Soo Kim, Sangmo Hong, Kyungdo Han, Cheol-Young Park
BMJ.2024; : e076388. CrossRef - Sex differences in mortality and liver‐related events in non‐alcoholic fatty liver disease: A systematic review and meta‐analysis
Huimin Zhou, Haiyan Chen, Hanxiao Lu, Bo Wu, Shuo Zhang, Yuanlong Gu, Guangwen Zhou, Jie Xiang, Jun Yang
Liver International.2024;[Epub] CrossRef - Association between dietary carbohydrate to fiber ratio and metabolic dysfunction associated fatty liver disease in adults: evidence from the NHANES 2017–2020
Zhenmin Liu, Taiyong Fang
Journal of Health, Population and Nutrition.2024;[Epub] CrossRef - Comparison of Outcomes Between Metabolic Dysfunction-Associated Fatty Liver Disease and Non-alcoholic Fatty Liver Disease: A Meta-Analysis
Ghazala S Virk, Jaahnavi Vajje, Nausheen K Virk, Raam Mannam, Wajeeh Rehman, Naglaa G Ghobriel , Irfan-ud-din Mian, Muhammad Usama
Cureus.2023;[Epub] CrossRef - Trends in prevalence and all-cause mortality of metabolic dysfunction-associated fatty liver disease among adults in the past three decades: Results from the NHANES study
Zhi-Qin Xie, Hong-Xia Li, Bing-Kun Wang, Zhao-Ming Yang, Zi-Yu Zhang, Wen-Liang Tan, Wen-Xin Li, Qing-Bin Wang, Lei Yang, Hong-Kai Zhuang, Chen-Wei Tang, Chang-Zhen Shang, Ya-Jin Chen
European Journal of Internal Medicine.2023; 110: 62. CrossRef - Comparing the Mortality Risk between Metabolic Dysfunction-Associated Fatty Liver Disease and Non-Alcoholic Fatty Liver Disease
Han Na Jung, Chang Hee Jung
Diabetes & Metabolism Journal.2023; 47(2): 198. CrossRef - Increased expression of sodium-glucose cotransporter 2 and O-GlcNAcylation in hepatocytes drives non-alcoholic steatohepatitis
Hye Jin Chun, Eun Ran Kim, Minyoung Lee, Da Hyun Choi, Soo Hyun Kim, Eugene Shin, Jin-Hong Kim, Jin Won Cho, Dai Hoon Han, Bong-Soo Cha, Yong-ho Lee
Metabolism.2023; 145: 155612. CrossRef - Current understanding and future perspectives on the impact of changing NAFLD to MAFLD on global epidemiology and clinical outcomes
Karl Vaz, Daniel Clayton-Chubb, Ammar Majeed, John Lubel, David Simmons, William Kemp, Stuart K. Roberts
Hepatology International.2023; 17(5): 1082. CrossRef - Mitochondrial Quality Control: Its Role in Metabolic Dysfunction-Associated Steatotic Liver Disease (MASLD)
Soyeon Shin, Jaeyoung Kim, Ju Yeon Lee, Jun Kim, Chang-Myung Oh
Journal of Obesity & Metabolic Syndrome.2023; 32(4): 289. CrossRef
 PubReader
 ePub Link
 Cite
Cite