
- Current
- Browse
- Collections
-
For contributors
- For Authors
- Instructions to authors
- Article processing charge
- e-submission
- For Reviewers
- Instructions for reviewers
- How to become a reviewer
- Best reviewers
- For Readers
- Readership
- Subscription
- Permission guidelines
- About
- Editorial policy
Articles
- Page Path
- HOME > Diabetes Metab J > Volume 46(5); 2022 > Article
-
Original ArticleComplication Waist Circumference and Body Mass Index Variability and Incident Diabetic Microvascular Complications: A Post Hoc Analysis of ACCORD Trial
-
Daniel Nyarko Hukportie1*
 , Fu-Rong Li1,2*, Rui Zhou1, Jia-Zhen Zheng1, Xiao-Xiang Wu3, Xian-Bo Wu1
 -
Diabetes & Metabolism Journal 2022;46(5):767-780.
DOI: https://doi.org/10.4093/dmj.2021.0258
Published online: May 10, 2022
1Department of Epidemiology, School of Public Health, Southern Medical University (Guangdong Provincial Key Laboratory of Tropical Disease Research), Guangzhou, China
2School of Medicine, Southern University of Science and Technology, Shenzhen, China
3Department of General Surgery, 157th Hospital, General Hospital of Guangzhou Military Command, Guangzhou, China
-
Corresponding authors: Xian-Bo Wu Department of Epidemiology, School of Public health Southern Medical University (Guangdong Provincial Key Laboratory of Tropical Disease Research), Guangzhou, Guangdong 510515, China E-mail: wuxb1010@smu.edu.cn
-
Xiao-Xiang Wu Department of General Surgery, 157th Hospital, General Hospital of Guangzhou Military Command, Guangzhou, China E-mail: 786486617@qq.com
- *Daniel Nyarko Hukportie and Fu-Rong Li contributed equally to this study as first authors.
Copyright © 2022 Korean Diabetes Association
This is an Open Access article distributed under the terms of the Creative Commons Attribution Non-Commercial License (http://creativecommons.org/licenses/by-nc/4.0/) which permits unrestricted non-commercial use, distribution, and reproduction in any medium, provided the original work is properly cited.
ABSTRACT
-
Background
- Obesity is associated with adverse health events among diabetic patients, however, the relationship between obesity fluctuation and risk of microvascular complications among this specific population is unclear. We aimed to examine the effect of waist circumference (WC) and body mass index (BMI) variability on the risk of diabetic microvascular outcome
-
Methods
- Annually recorded anthropometric data in the Action to Control Cardiovascular Risk in Diabetes (ACCORD) study was used to examine the association of WC and BMI variability defined as variability independent of mean, with the risk of microvascular outcomes, including neuropathy, nephropathy, and retinopathy. Cox proportional hazards models were used to estimate the hazard ratios (HRs) and 95% confidence intervals (CIs) (Trial registration: ClinicalTrials.gov., no. NCT00000620).
-
Results
- There were 4,031, 5,369, and 2,601 cases of neuropathy, nephropathy, and retinopathy during a follow-up period of 22,524, 23,941, and 23,850 person-years, respectively. Higher levels of WC and BMI variability were associated with an increased risk of neuropathy. Compared with the lowest quartile, the fully-adjusted HR (95% CI) for the highest quartile of WC and BMI variability for neuropathy risk were 1.21 (1.05 to 1.40) and 1.16 (1.00 to 1.33), respectively. Also, higher quartiles of BMI variability but not WC variability were associated with increased risk of nephropathic events. The fully-adjusted HR (95% CI) for the highest quartile compared with the lowest quartile of BMI variability was 1.31 (1.18 to 1.46). However, the results for retinopathic events were all insignificant.
-
Conclusion
- Among participants with type 2 diabetes mellitus, WC and BMI variability were associated with a higher risk of neuropathic events, whereas BMI variability was associated with an increased risk of nephropathic events.
- Despite decades of improvement in public health services, the prevalence of diabetes mellitus (DM) has been on the rise globally and has in recent times been recognized as a global public health problem [1]. According to the World Health Organization (WHO), the number of people living with DM rose from 108 million in 1980 to 422 million in 2014 [2], a figure that has been projected to rise to 592 million by 2035 [3]. Similarly, complications associated with DM have also been on the rise in tandem with trends of DM worldwide [2]. Reports show that about 20% to 40% of patients with DM would develop diabetic kidney disease [4], while 10% are likely to develop diabetic retinopathy [5], and up to 50% would eventually develop diabetic neuropathy [6].
- Several factors including obesity have been identified as plausible risk factors for the pathology of microvascular complications among patients with diabetes [6-8]. Indeed, adequate weight loss in individuals with obesity has been associated with a substantial decline in blood pressure (BP), improvement in insulin sensitivity, decrease in proteinuria, and metabolic benefits [9-11]. Hence, maintenance of ‘normal’ body weight has been a target as part of the management of noncommunicable diseases such as DM [12]. However, prospective studies have shown that obesity indexes frequently fluctuate and may be linked to the risk of macrovascular and microvascular outcomes [13,14]. Although a number of studies have examined the relationship between body weight variability and cardiovascular complications and mortality in patients with diabetes [15-17], there is a paucity of studies examining the association between waist circumference (WC) or body mass index (BMI) variability and diabetic microvascular complications. Since WC and BMI may reflect different forms of adiposities [18-20], variability in these measures could differently be associated with certain health outcomes.
- In this context, we conducted a post hoc analysis of publicly available Action to Control Cardiovascular Risk in Diabetes (ACCORD) study data to examine the association between intraindividual variability in WC and BMI with the risk of microvascular complications among patients with diabetes. The ACCORD trial was a randomized, multi-center, double 2×2 factorial trial in 10,251 participants with type 2 diabetes mellitus (T2DM). The current study gives a unique sample of patients with T2DM, with comprehensive baseline measurements and almost complete follow-up for diabetic microvascular complications, including neuropathy, nephropathy, and retinopathy.
INTRODUCTION
- Study participants and data collection
- ACCORD was a randomized clinical trial of 10,251 participants with T2DM who were followed to assess the health effects of intensive glycemic, lipid, and BP control as against standard control [21,22]. The design and main results of the ACCORD study have been published previously [22]. Briefly, ACCORD had three study arms: (1) glycaemia trial (glycosylated hemoglobin [HbA1c] <6.0% vs. 7.0%< HbA1c <7.9%); (2) lipid trial (fenofibrate vs. placebo); and (3) BP trial (systolic blood pressure [SBP] <120 mm Hg vs. SBP <140 mm Hg), with all participants involved in the glycaemia trial [23]. Recruitment of participants into the study began in January 2001 through to October 2005 from 77 clinical sites across Northern America (i.e., USA and Canada). Participants were followed up until June 2009 when the ACCORD study was ended [24]. Ethical approval for the ACCORD study was granted by Institutional Review Boards (IRB) of each clinical site and written informed consent was obtained from all recruited participants (trial registration: ClinicalTrials.gov., no. NCT00000620) [25]. It is noteworthy to mention that the authors of this current study were not involved in the ACCORD trial project but only conducted a post hoc analysis of the ACCORD dataset.
- For this study, participants were excluded if they had less than two recorded anthropometric measurements (n=460). Then, for the analysis of each microvascular outcome, individuals with the very prevalent microvascular outcome at baseline were excluded. For neuropathy outcome, 2,587 participants with prevalent neuropathy were excluded; for nephropathy outcome, 1,037 participants with prevalent macroalbuminuria and 34 persons with serum creatinine >3.3 mg/dL were excluded; and for retinopathy, 1,003 patients with retinopathy, 2,184 patients with eye disease and 387 patients who have had eye surgeries were excluded from the analysis. The analytic samples for neuropathy, nephropathy, and retinopathy outcomes were 7,204, 8,720, and 6,217, respectively.
- Measures of variabilities in WC and BMI
- Exposure of interest was anthropometric measurements obtained at baseline and then annually, including WC and BMI. WC was measured at the smallest point between the 10th rib and the iliac crest over bare skin using steel or non-stretching plastic tape. Height was measured using either a steel tape measure marked in centimeters which was hung vertically on the wall with a headboard at a right angle or commercial stadiometers. Participants were asked to position themselves against the wall having their heels, buttocks, and/or shoulder blades touching the board (tape), and their eyes looking straight, feet together with ankles touching or as close as possible. Bare feet were preferred while light or nylon socks were also allowed during the measurement. Finally, the weight of participants was measured using high-quality scales in clinical practice; during the weighing procedure, participants were asked to wear as little clothing as possible, removing shoes, and other external accessories. All values were recorded to the nearest decimal place. BMI was calculated as weight (kg) divided by squared height (m).
- Variabilities in WC and BMI were defined as intra-individual variabilities between measurements using the following four variability measures: (1) average successive variability (ASV), which was defined as the average absolute difference between successive visits; (2) standard deviation (SD); (3) coefficient of variation (CV); and (4) variability independent of the mean (VIM). VIM was calculated as 100×SD/meanβ, where β is the regression coefficient, based on the natural logarithm of the SD on the natural logarithm of the mean. The uncorrected VIM was corrected using this formula: (VIM uncorrected×mean of CV)/mean of VIM uncorrected [26]. Because the results from all variability measures were similar (with exception of the results between variability measures and the relationship with retinopathy in our primary analysis), the corrected variability independent of the mean (cVIM) was used as the primary variability measure in this study whiles results from the other variability measures are reported for comparative purposes [16,27,28].
- Study outcomes and follow-up
- The endpoints considered in our analysis were the predefined ACCORD microvascular outcomes defined as neuropathy: a composite of (1) new score of >2.0 on the Michigan Neuropathy Screening Instrument (MNSI), (2) new loss of vibratory sensation (tested using 128 Hz tuning fork), (3) new loss of ankle jerk during Jendrassik maneuver, or (4) new loss of light touch (as measured by 10 g force monofilament test); nephropathy: a composite of (1) development of macroalbuminuria, (2) development of renal failure, or (3) doubling of baseline serum creatinine or more than 20 mL/min/1.73 m2 decrease in estimated glomerular filtration rate (eGFR); and retinopathy: a composite of (1) retinal photocoagulation or vitrectomy to treat retinopathy, (2) eye surgery for cataract extraction, (3) three‐line change in visual acuity (as measured using Log MAR visual acuity chart), or (4) severe vision loss (as measured by Snellen fraction <20/200). Patients who experienced any one of the predefined microvascular events that comprised the composite neuropathy, nephropathy, and retinopathy outcome were considered to have experienced that specific disease. Supplementary Table 1 shows the three predefined ACCORD microvascular endpoints and their frequency of assessment.
- Statistical analysis
- Participants’ characteristics were described using mean±SD or median (interquartile range) for continuous variables, depending on whether the data distribution was normal (assessed by the Shapiro-Wilk test); categorical variables were described by frequency and percentage. The association between WC and BMI variability (as measured by corrected variability independent of mean) and the risk of outcomes was evaluated with the use of WC and BMI variability as a categorical variable.
- Cox proportional hazards regression model was used to estimate the hazard ratio (HR) and 95% confidence interval (CI), using WC and BMI variability as a time-dependent covariate. The crude models and fully adjusted models were used. With the exception of baseline age, sex, and race, all baseline characteristics with a P<0.10 in the univariate analysis were included in the multivariable models for respective microvascular outcomes. In Kaplan-Meier analysis for the outcomes, the highest quartile (Q4) category was compared with the lower three quartiles (Q1–Q3) as a reference category. The differences between categories were assessed using the log-rank test. Additionally, to account for WC and BMI variability as a categorical variable, patients were divided into quartiles, using the lowest quartiles as the reference.
- The multivariable models comprised baseline age (continuous), sex (male or female), race (white or non-white), diabetes duration (continuous), BP versus lipid treatment arm (standard BP, intensive BP, fibrate, and placebo), SBP (continuous), diastolic blood pressure (DBP; continuous), low density lipoprotein (LDL; continuous), high density lipoprotein (HDL; continuous), HbA1c (continuous), baseline BMI (continuous) (or baseline WC) in addition to allocation to glycemia treatment arm (intensive and standard), insulin use (yes or no), alcohol consumption (yes or no) for neuropathy (model 21); antihypertensive medication (yes or no), cardiovascular disease (CVD) history (yes or no), eGFR (continuous), and UACR (continuous) for nephropathy (model 22); allocation to glycemia treatment arm (intensive and standard) and insulin use (yes or no) for retinopathy (model 23).
- Further exploration was carried out to examine possible interactions between each SD increase in WC and BMI variability (cVIM), and the following baseline characteristics of the participants with respect to each microvascular outcome: age (≤65 or >65 years), sex, diabetes duration (≤9 or >9 years), glycemia arm (intensive or standard), BP versus lipid treatment arm (standard BP, intensive BP, lipid placebo, and lipid fenofibrate), and SBP (≤139 or >139 mm Hg). The statistical significance of the interactions was assessed by adding a multiplicative term to the Cox models. Sensitivity analyses were also performed by excluding participants who had the respective events within the first year of follow-up and participants with any serious adverse event (attributed to study medication and not related to hypoglycemia) that occurred in the first 18 months of follow-up.
- All statistical analyses were 2-sided, and we considered a P value of <0.05 to be statistically significant. All analyses were performed using Stata version 14.2 (StataCorp., College Station, TX, USA).
- Ethics statement
- The studies involving human participants were reviewed and approved by ACCORD Protocol Review Committee appointed by National Heart, Lung, and Blood Institute (NHLBI) & local IRBs of participating clinical sites. This study has been reviewed and found the study exempted from IRB approval (No. 2022-0407). The patients/participants provided their written informed consent to participate in this study.
- Data availability statement
- Publicly available dataset was analysed in this study. This data can be found at: https://biolincc.nhlbi.nih.gov/studies/accord/ (Repository: Biologic Specimen and Data Repository).
METHODS
- Table 1 shows the distribution of baseline characteristics of individuals according to whether they developed neuropathy, nephropathy, and retinopathy or not. For participants who were included in the study, participants who developed neuropathy were more likely to be older, men, whites, have higher levels of WC, BMI, longer duration of diabetes, non-insulin users, alcohol abstainers, and had lower levels of DBP and HDL. Also, participants who subsequently developed nephropathy were more likely to be men, whites, have higher levels of WC, BMI, HbA1c, use antihypertensive, less likely to have CVD, have higher levels of SBP, eGFR, UACR, but lower levels of HDL, LDL, serum creatinine. Participants who developed retinopathy were older, had higher levels of HbA1c, SBP, HDL, longer duration of diabetes, but had lower levels of WC and BMI and were non-insulin users (Table 1). ACCORD recorded 4,031, 5,369, and 2,601 cases of neuropathy, nephropathy, and retinopathy for a follow-up period of 22,524, 23,941, and 23,850 person-years, respectively.
- WC and BMI variability and risk of the outcome
- The Kaplan-Meier curves for the relationship between obesity variability measures and neuropathic, nephropathic, and retinopathic events are shown in Supplementary Figs. 1-3. The highest quartile in cVIM of WC showed a higher risk for neuropathy and nephropathy compared to lower quartiles (Supplementary Figs. 1 and 2), while the highest quartile in cVIM of BMI showed a higher risk for nephropathy, compared to lower quartiles (Supplementary Fig. 2).
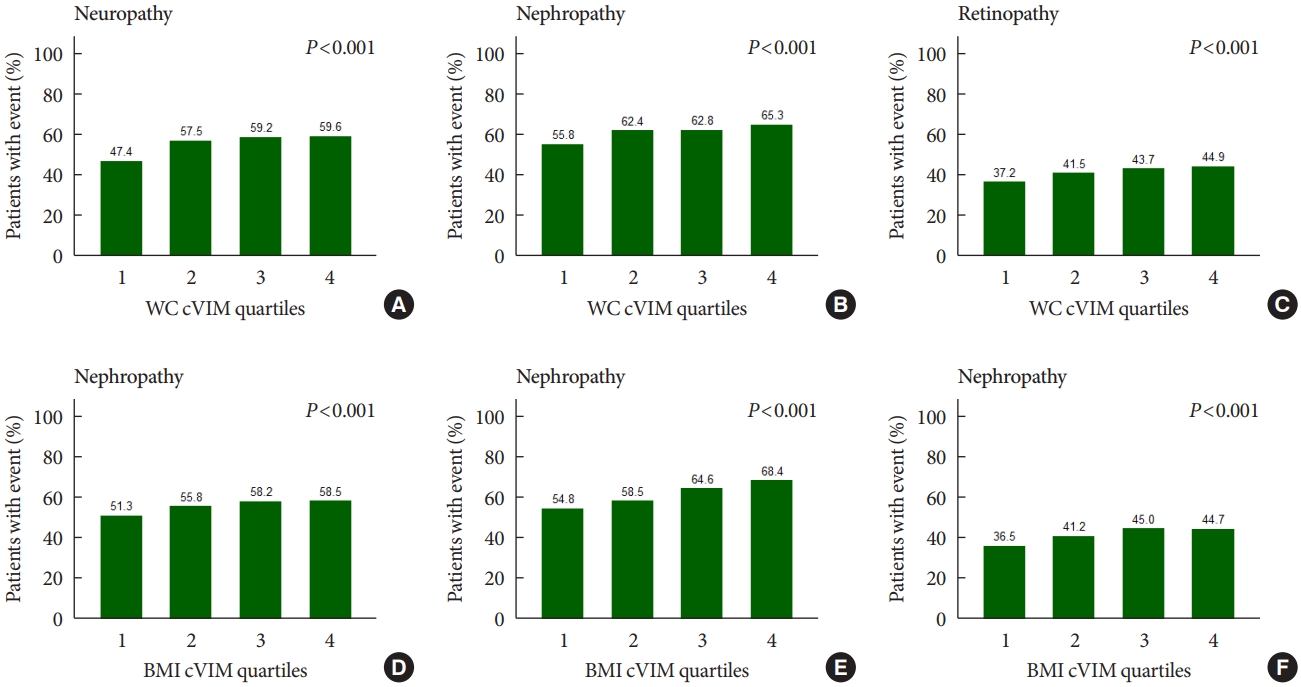
- Fig. 1 shows that the rates of any neuropathic, nephropathic, and retinopathic event increased in increasing quartiles of mean WC and BMI variability as measured by cVIM. Compared with the lowest quartile, the hazard ratio (HR) (95% confidence interval [CI]) for the highest quartiles of WC and BMI variability measured by cVIM in the fully-adjusted model were 1.21 (95% CI, 1.05 to 1.40) and 1.16 (95% CI, 1.00 to 1.33) for any neuropathic event, respectively (Table 2). A similar trend of association of observed when ASV, CV, and SD were used to evaluate the relationship of WC and BMI variability with neuropathy risk (Table 2). For the relationship of WC and BMI variability with the nephropathic outcome, higher quartiles of BMI variability were also associated with increased risk of nephropathic events but not WC variability. The fully-adjusted HR (95% CI) for the 4th quartile of BMI variability measured cVIM was 1.31 (95% CI, 1.18 to 1.46), compared with the 1st quartile (Table 3). A similar trend of association was observed when other variability measures (ASV, CV, and SD) were used in the analysis (Table 3). Meanwhile, for the retinopathic outcome, the results were null for both WC and BMI variability using cVIM and ASV as the measures of variability (Table 4); but, when CV and SD were used as the measures of variability, a significant association was observed between BMI variability and retinopathic risk (Table 4).
- Subgroup and sensitivity analysis
- Supplementary Table 2 shows the HR (95% CI) for the subgroup analysis of the links between each SD increase in WC and BMI variability and various outcomes. For nephropathic outcome, we found sex to significantly modify the relation between each 1SD increase in the WC and BMI and the risk of incident nephropathy (both Pinteraction=0.03). However, the link between WC variability and diabetic nephropathy risk was similar for both men and women (Supplementary Table 2). No significant modifying effects were observed for the other factors.
- Sensitivity analyses were conducted to check the robustness of our results. Namely, results remained unchanged after excluding participants who had the respective microvascular events within the first year of follow-up and excluding participants with any serious adverse event (attributed to study medication and not related to hypoglycemia) that occurred in the first 18 months of follow-up for neuropathic and nephropathic outcomes (Supplementary Tables 3 and 4). Meanwhile, for the retinopathic outcome, all measures of variability to evaluate the relationship with both WC and BMI became null in the sensitivity analysis (Supplementary Table 5).
RESULTS
- In this post hoc analysis involving participants with T2DM who participated in the ACCORD trial, we found higher levels of WC and BMI variability to be associated with neuropathy, while only BMI variability was associated with nephropathy risk. On the contrary, neither higher levels of WC nor BMI variability were associated with retinopathy risk. This study provides epidemiologic evidence regarding the associations between variabilities in obesity measures with the risk of neuropathy and nephropathy and the lack thereof in relation to retinopathy risk in participants with T2DM.
- Several previous studies have examined the relationship between the consequence of variabilities in obesity measures on health outcomes in participants with or without diabetes but the results are inconsistent. Some studies have found variability in BMI to be associated with the development of diabetes [29], increased risk of new-onset atrial fibrillation and myocardial infarction [30], increased rate of hospitalization from heart failure [31], whiles WC variability has also been found to be associated with risk of stroke and all-cause mortality [28]. However, these studies did not assess the relationship between obesity variability and diabetic microvascular complications. One longitudinal study on T2DM patients did examine the relationship between body weight variability and microvascular complications and found a positive association between body weight variability and a composite outcome of neuropathy, nephropathy, and retinopathy [17]. However, this study did not delineate the relationship between the measure of obesity variability and each microvascular outcome separately. Another 5-year prospective study explored the relationship of longitudinal BMI variability with retinal changes using a sample of Chinese adults, and found a significant relationship between rising BMI trend and retinal microvascular changes, but did not find any significant relationship between BMI variability and retinal vascular caliber [13], (a potential biomarker for the development and progression of retinopathy) [32]. However, this study was not on a sample with diabetes.
- Using data from a large sample of participants with T2DM, we show that WC and BMI variability may be detrimental to participants with diabetes. Our study found an association between WC and BMI variability with neuropathy; and BMI variability with nephropathy risk which is in line with the findings of a recent study of a cohort of T2DM patients in which the researchers found bodyweight variability to be associated with diabetic microvascular complications albeit without delineating the associations between body weight variability and specific microvascular complications [17].
- While weight reduction has been associated with better health outcomes [12], weight variability has also been linked to some morbidities and mortality [33]. The mechanism underlying obesity variability and disease outcome is not completely understood. However, it has been suggested that a subsequent increase in weight after an initial decrease may be associated with a more rapid adipose tissue growth and hyperplasia due to metabolic shifts which favor lipid storage [15]. Since adipose tissue is a highly active metabolic endocrine organ [34], the rapid remodelling of adipose tissue linked to high obesity variability may provoke abnormal production of proinflammatory adipokines, which may potentially lead to adverse health outcomes including diabetes and its associated complications [15,17,28,29].
- Our study did not find a significant association of WC variability with nephropathy and retinopathy risk. Even though no previous studies specifically examined such a relationship, our result was in agreement with some studies exploring the relationship between WC fluctuation and some health outcomes. For example, in one longitudinal study in which researchers explored the relationship between long-term variation in WC and insulin resistance, they found a null association between WC fluctuations and insulin resistance [35], while another study also observed a null association between WC variability and myocardial infarction [28]. Furthermore, our study did not find any association between higher BMI variability levels and retinopathy risk, which was in agreement with a longitudinal study of adult Chinese subjects in which the researchers found no association between BMI variability and retinal vascular caliber [13]. However, it must be noted that these null associations in our study are contrary to the findings of the study on a cohort of T2DM patients in which the researchers found bodyweight variability to be associated with diabetic microvascular complications [17]. The contradictory findings might be because of the composite outcome of all microvascular complications used in that study. Further studies may be necessary to assess the association of obesity variability with diabetic microvascular complications separately.
- Interestingly, the results of our subgroup analysis showed sex to modify the relationship between WC or BMI variability with the nephropathic outcome. Our results were similar to another study which also found sex to modify the relation between body weight variability and myocardial infarction in a population base study [28]. This suggests that sex may play a role in the pathological relationship between obesity variability and some health outcomes. Further studies may be needed to elucidate the potential influence of sex on the relationship between obesity variability and health outcomes.
- The strength of our study includes the relatively large sample size and comprehensive clinical and biological characterization of participants. There was also a special examination of microvascular complications at baseline and subsequent visits, which permitted the accurate assessment of the effect of obesity variability on microvascular complication risk. Another strength was that the attrition of study participants was also low. This study also has several limitations. First, the observational nature of this study can only infer an association but not causation. Second, purposeful loss of weight may have a different effect on disease outcome; however, our study could not determine if weight variability was purposeful or not. Third, the generalization of these findings to other populations may be limited since all study participants were from northern America and there may be variability in body composition across different populations. Finally, the events used to define the composite outcome of each microvascular complication may differ from other studies, hence the results of this study should be applied cautiously in view of current definitions/diagnostic criteria.
- In conclusion, in this cohort of patients with T2DM, WC and BMI variability were associated with a significant increase in the risk of neuropathic events, whereas BMI variability was associated with increased risk of nephropathic events. Individuals with T2DM might need to be encouraged to maintain stable WC and BMI to prevent diabetic microvascular complications.
DISCUSSION
SUPPLEMENTARY MATERIALS
Supplementary Table 1.
Supplementary Table 2.
Supplementary Table 3.
Supplementary Table 4.
Supplementary Table 5.
Supplementary Fig. 1.
Supplementary Fig. 2.
Supplementary Fig. 3.
-
CONFLICTS OF INTEREST
The following companies provided study medications, equipment, or supplies: Abbott Laboratories, Amylin Pharmaceutical, AstraZeneca Pharmaceuticals LP, Bayer HealthCare LLC, Closer Healthcare Inc., GlaxoSmithKline Pharmaceuticals, King Pharmaceuticals Inc., Merck & Co. Inc., Novartis Pharmaceuticals Inc., Novo Nordisk Inc., Omron Healthcare Inc., Sanofi-Aventis U.S., and Takeda Pharmaceuticals Inc. However, no potential conflict of interest relevant to this article was reported.
-
AUTHOR CONTRIBUTIONS
Conception or design: D.N.H., F.R.L.
Acquisition, analysis, or interpretation of data: D.N.H., F.R.L.
Drafting the work or revising: R.Z., J.Z.Z., X.X.W.
Final approval of the manuscript: D.N.H., F.R.L., R.Z., J.Z.Z., X.X.W., X.B.W.
-
FUNDING
Our study was supported by the National Natural Science Foundation of China (82173607), the Guangdong Basic and Applied Basic Research Foundation (2021A1515011684), Open Project of the Guangdong Provincial Key Laboratory of Tropical Disease Research (2020B1212060042) and Guangzhou Science and Technology Project (202102080597). Funders had no role in the design of the study, the analysis and interpretation of data, and the writing of the paper.
NOTES
-
Acknowledgements
- The ACCORD study was supported by grants (N01-HC095178, N01-HC-95179, N01-HC-95180, N01-HC-95181, N01-HC-95182, N01-HC-95183, N01-HC-95184, IAA-Y1-HC-9035, and IAA-Y1-HC-1010) from the National Heart, Lung, and Blood Institute; by other components of the National Institutes of Health, including the National Institute of Diabetes and Digestive and Kidney Diseases, the National Institute on Aging, and the National Eye Institute; by the Centers for Disease Control and Prevention; and by General Clinical Research Centers.

| Characteristic |
Neuropathy |
Nephropathy |
Retinopathy |
|||||||
|---|---|---|---|---|---|---|---|---|---|---|
| No cases (n=3,173) | Cases (n=4,031) | P valuea | No cases (n=3,351) | Cases (n=5,369) | P valuea | No cases (n=3,616) | Cases (n=2,601) | P valuea | ||
| Age, yr | 61.6 (57.4–66.3) | 62.2 (57.7–67.6) | <0.001 | 62.2 (57.7–67.4) | 61.9 (57.7–66.9) | 0.196 | 60 (56.6–64.4) | 61.8 (57.6–66.2) | <0.001 | |
| Sex | <0.001 | 0.002 | 0.134 | |||||||
| Male | 1,859 (58.6) | 2,551 (63.3) | 2,007 (59.9) | 3,390 (63.1) | 2,300 (63.6) | 1,606 (61.7) | ||||
| Female | 1,314 (41.4) | 1,480 (36.7) | 1,344 (40.1) | 1,979 (36.9) | 1,316 (36.4) | 995 (38.3) | ||||
| Race | <0.001 | 0.035 | 0.084 | |||||||
| White | 1,644 (51.8) | 2,648 (65.7) | 2,074 (61.9) | 3,443 (64.1) | 2,223 (61.5) | 1,655 (63.6) | ||||
| Non-white | 1,529 (48.2) | 1,383 (34.3) | 1,277 (38.1) | 1,926 (35.9) | 1,393 (38.5) | 946 (36.4) | ||||
| WC, cm | 104.1 (94.7–114) | 106.7 (97.8–115.6) | <0.001 | 105.5 (96.5–115.6) | 106.7 (97.8–116.8) | <0.001 | 106.7 (96.5–116.8) | 105.4 (96.5–114.5) | 0.023 | |
| BMI, kg/m2 | 31.0 (27.5–35.0) | 31.8 (28.2–35.7) | <0.001 | 31.5 (28.1–35.8) | 32.0 (28.3–36.0) | 0.017 | 32.2 (28.4–36.2) | 31.5 (27.9–35.6) | <0.001 | |
| HbA1c, % | 8 (7.5–8.8) | 8.1 (7.6–8.9) | 0.072 | 8.0 (7.5–8.7) | 8.2 (7.6–8.9) | <0.001 | 8.1 (7.5–8.8) | 8.2 (7.6–9) | <0.001 | |
| Duration of diabetes, yr | 8 (4–14) | 9 (5–14) | 0.001 | 9 (5–15) | 9 (5–15) | 0.001 | 7 (4–12) | 9 (5–14) | <0.001 | |
| Glycemia | 0.006 | 0.383 | <0.001 | |||||||
| Standard | 1,511 (47.6) | 2,050 (50.9) | 1,653 (49.3) | 2,700 (50.3) | 1,728 (47.8) | 1,357 (52.2) | ||||
| Intensive | 1,662 (52.4) | 1,981 (49.1) | 1,698 (50.7) | 2,669 (49.7) | 1,888 (52.2) | 1,244 (47.8) | ||||
| Arm of trial | 0.010 | <0.001 | 0.044 | |||||||
| Standard BP | 721 (22.7) | 946 (23.5) | 1,015 (30.3) | 1,001 (18.6) | 788 (21.8) | 640 (24.6) | ||||
| Intensive BP | 808 (25.5) | 898 (22.3) | 742 (22.1) | 1,302 (24.3) | 861 (23.8) | 572 (22.0) | ||||
| Lipid placebo | 805 (25.4) | 1,111 (27.6) | 1,102 (32.9) | 1,218 (22.7) | 990 (27.4) | 683 (26.3) | ||||
| Lipid fibrate | 839 (26.4) | 1,076 (26.7) | 492 (14.7) | 1,848 (34.4) | 977 (27.0) | 706 (27.1) | ||||
| Insulin use | <0.001 | 0.261 | <0.001 | |||||||
| Yes | 863 (27.2) | 1,288 (32.0) | 1,111 (33.2) | 1,843 (34.3) | 931 (25.8) | 812 (31.2) | ||||
| No | 2,310 (72.8) | 2,743 (68.1) | 2,240 (66.9) | 3,526 (65.7) | 2,685 (74.3) | 1,789 (68.8) | ||||
| Statin use | 0.728 | 0.603 | 0.734 | |||||||
| Yes | 2,014 (63.8) | 2,546 (63.4) | 2,120 (63.5) | 3,424 (64.0) | 2,256 (62.6) | 1,611 (62.2) | ||||
| No | 1,143 (36.2) | 1,470 (36.6) | 2,120 (63.5) | 3,424 (64.0) | 1,345 (37.4) | 978 (37.8) | ||||
| Antihypertensive | 0.913 | 0.011 | 0.202 | |||||||
| Yes | 2,695 (84.9) | 3,420 (84.8) | 2,820 (84.2) | 4,625 (86.1) | 3,048 (84.3) | 2,161 (83.1) | ||||
| No | 478 (15.1) | 611 (15.2) | 531 (15.9) | 744 (13.9) | 568 (15.7) | 440 (16.9) | ||||
| Alcohol consumption | 0.004 | 0.333 | 0.254 | |||||||
| Yes | 719 (22.7) | 1,032 (25.6) | 839 (25.1) | 1,296 (24.1) | 941 (26.0) | 644 (24.8) | ||||
| No | 2,453 (77.3) | 2,997 (74.4) | 2,509 (74.9) | 4,072 (75.9) | 2,673 (74.0) | 1,957 (75.2) | ||||
| Cigarette smoking | 0.125 | 0.214 | 0.148 | |||||||
| Yes | 443 (14.0) | 513 (12.7) | 430 (12.8) | 739 (13.8) | 561 (15.5) | 369 (14.2) | ||||
| No | 2,730 (86.0) | 3,518 (87.3) | 2,921 (87.2) | 4,630 (86.2) | 3,055 (84.5) | 2,232 (85.8) | ||||
| CVD history | 0.192 | <0.001 | 0.152 | |||||||
| Yes | 1,029 (32.4) | 1,366 (33.9) | 1,050 (31.3) | 1,939 (36.1) | 1,154 (31.9) | 875 (33.6) | ||||
| No | 2,144 (67.6) | 2,665 (66.1) | 2,301 (68.7) | 3,430 (63.9) | 2,462 (68.1) | 1,726 (66.4) | ||||
| SBP, mm Hg | 136 (125–147) | 135 (125–147) | 0.099 | 133 (123–143) | 136 (125–147) | <0.001 | 134 (124–145) | 136 (126–147) | <0.001 | |
| DBP, mm Hg | 75 (69–82) | 74 (68–82) | <0.001 | 74 (68–81) | 75 (68–82) | 0.071 | 76 (69–83) | 75 (68–82) | 0.017 | |
| HDL, mg/dL | 41 (35–49) | 40 (34–48) | <0.001 | 41 (35–49) | 39 (34–47) | <0.001 | 39 (34–47) | 40 (34–48) | 0.028 | |
| LDL, mg/dL | 102 (82–128) | 101 (81–124) | 0.103 | 102 (82–126) | 100 (80–124) | 0.004 | 102 (81–125) | 103 (83–128) | 0.071 | |
| eGFR, mL/min/1.73 m² | - | - | - | 80.3 (68.6–92.1) | 92.1 (79.6–108.8) | <0.001 | - | - | - | |
| UACR, mg/g | - | - | - | 10 (6–22) | 15 (7–44) | <0.001 | - | - | - | |
| Serum creatinine, mg/dL | - | - | - | 0.9 (0.8–1.1) | 0.8 (0.7–1.0) | <0.001 | - | - | - | |
Values are presented as median (interquartile range) or number (%).
WC, waist circumference; BMI, body mass index; HbA1c, glycosylated hemoglobin; BP, blood pressure; CVD, cardiovascular disease; SBP, systolic blood pressure; DBP, diastolic blood pressure; HDL, high density lipoprotein; LDL, low density lipoprotein; eGFR, estimated glomerular filtration rate; UACR, urinary albumin creatinine ratio.
a P values for continuous variables are from the rank-sum test. All other P values are from the Pearson chi-square test.
Model 1: unadjusted model; Model 21: Adjusted for age, sex race, duration of diabetes, allocation to glycemia treatment arm, blood pressure (BP) vs. lipid treatment arm, systolic BP, diastolic BP, low density lipoprotein, high density lipoprotein, glycosylated hemoglobin, insulin use, alcohol consumption, and baseline BMI (or WC).
WC, waist circumference; BMI, body mass index; HR, hazard ratio; CI, confidence interval; cVIM, corrected variability independent of mean; ASV, average successive variability; CV, coefficient of variation; SD, standard deviation.
Model 1: unadjusted model; Model 22: Adjusted for age, sex, race, duration of diabetes, blood pressure (BP) vs. lipid treatment arm, systolic BP, diastolic BP, low density lipoprotein, high density lipoprotein, glycosylated hemoglobin, antihypertensive, cardiovascular disease history, estimated glomerular filtration rate, urinary albumin creatinine ratio, and baseline BMI (or WC).
WC, waist circumference; BMI, body mass index; HR, hazard ratio; CI, confidence interval; cVIM, corrected variability independent of mean; ASV, average successive variability; CV, coefficient of variation; SD, standard deviation.
Model 1: unadjusted model; Model 23: Adjusted for age, sex, race, duration of diabetes, allocation to glycemia treatment arm, blood pressure (BP) vs. lipid treatment arm, systolic BP, diastolic BP, low density lipoprotein, high density lipoprotein, glycosylated hemoglobin, insulin use, and baseline BMI (or WC).
WC, waist circumference; BMI, body mass index; HR, hazard ratio; CI, confidence interval; cVIM, corrected variability independent of mean; ASV, average successive variability; CV, coefficient of variation; SD, standard deviation.
- 1. Bommer C, Sagalova V, Heesemann E, Manne-Goehler J, Atun R, Barnighausen T, et al. Global economic burden of diabetes in adults: projections from 2015 to 2030. Diabetes Care 2018;41:963-70.ArticlePubMedPDF
- 2. World Health Organization: Diabetes. Available from: https://www.who.int/news-room/fact-sheets/detail/diabetes (updated 2021 Nov 10).
- 3. Hwang IC, Bae JH, Kim JM. Relationship between body fat and diabetic retinopathy in patients with type 2 diabetes: a nationwide survey in Korea. Eye (Lond) 2019;33:980-7.ArticlePubMedPMCPDF
- 4. American Diabetes Association. 11. Microvascular complications and foot care: standards of medical care in diabetes-2020. Diabetes Care 2020;43(Suppl 1):S135-51.
- 5. Wong TY, Cheung N, Tay WT, Wang JJ, Aung T, Saw SM, et al. Prevalence and risk factors for diabetic retinopathy: the Singapore Malay Eye Study. Ophthalmology 2008;115:1869-75.ArticlePubMed
- 6. Zhou R, Li F, Chen G, Fu Q, Gu S, Wu X. Associations between general and abdominal obesity and incident diabetic neuropathy in participants with type 2 diabetes mellitus. J Diabetes 2021;13:33-42.ArticlePubMedPDF
- 7. Dirani M, Xie J, Fenwick E, Benarous R, Rees G, Wong TY, et al. Are obesity and anthropometry risk factors for diabetic retinopathy?: the diabetes management project. Invest Ophthalmol Vis Sci 2011;52:4416-21.ArticlePubMed
- 8. Bavbek N, Isik B, Kargili A, Uz E, Uz B, Kanbay M, et al. Association of obesity with inflammation in occult chronic kidney disease. J Nephrol 2008;21:761-7.PubMed
- 9. Neter JE, Stam BE, Kok FJ, Grobbee DE, Geleijnse JM. Influence of weight reduction on blood pressure: a meta-analysis of randomized controlled trials. Hypertension 2003;42:878-84.ArticlePubMed
- 10. Magkos F, Fraterrigo G, Yoshino J, Luecking C, Kirbach K, Kelly SC, et al. Effects of moderate and subsequent progressive weight loss on metabolic function and adipose tissue biology in humans with obesity. Cell Metab 2016;23:591-601.ArticlePubMedPMC
- 11. Kittiskulnam P, Kanjanabuch T, Tangmanjitjaroen K, Chancharoenthana W, Praditpornsilpa K, Eiam-Ong S. The beneficial effects of weight reduction in overweight patients with chronic proteinuric immunoglobulin a nephropathy: a randomized controlled trial. J Ren Nutr 2014;24:200-7.ArticlePubMed
- 12. Ryan DH, Yockey SR. Weight loss and improvement in comorbidity: differences at 5%, 10%, 15%, and over. Curr Obes Rep 2017;6:187-94.ArticlePubMedPMCPDF
- 13. Gong W, Hu Y, Niu Y, Wang D, Wang Y, Li Y, et al. Effects of longitudinal body mass index variability on microvasculature over 5 years in adult Chinese. Obesity (Silver Spring) 2016;24:743-9.ArticlePubMedPDF
- 14. Saito I, Iso H, Kokubo Y, Inoue M, Tsugane S. Body mass index, weight change and risk of stroke and stroke subtypes: the Japan Public Health Center-based prospective (JPHC) study. Int J Obes (Lond) 2011;35:283-91.ArticlePubMedPDF
- 15. Bangalore S, Fayyad R, DeMicco DA, Colhoun HM, Waters DD. Body weight variability and cardiovascular outcomes in patients with type 2 diabetes mellitus. Circ Cardiovasc Qual Outcomes 2018;11:e004724.ArticlePubMed
- 16. Nam GE, Kim W, Han K, Lee CW, Kwon Y, Han B, et al. Body weight variability and the risk of cardiovascular outcomes and mortality in patients with type 2 diabetes: a nationwide cohort study. Diabetes Care 2020;43:2234-41.ArticlePubMedPDF
- 17. Yeboah P, Hsu FC, Bertoni AG, Yeboah J. Body mass index, change in weight, body weight variability and outcomes in type 2 diabetes mellitus (from the ACCORD Trial). Am J Cardiol 2019;123:576-81.ArticlePubMed
- 18. Booth ML, Hunter C, Gore CJ, Bauman A, Owen N. The relationship between body mass index and waist circumference: implications for estimates of the population prevalence of overweight. Int J Obes Relat Metab Disord 2000;24:1058-61.ArticlePubMedPDF
- 19. Chan DC, Watts GF, Barrett PH, Burke V. Waist circumference, waist-to-hip ratio and body mass index as predictors of adipose tissue compartments in men. QJM 2003;96:441-7.ArticlePubMed
- 20. Nazare JA, Smith J, Borel AL, Aschner P, Barter P, Van Gaal L, et al. Usefulness of measuring both body mass index and waist circumference for the estimation of visceral adiposity and related cardiometabolic risk profile (from the INSPIRE ME IAA study). Am J Cardiol 2015;115:307-15.ArticlePubMed
- 21. ACCORD: ACCORDION: the ACCORD follow-on study protocol (March 18, 2011–Version G). 2011 Available from: https://biolincc.nhlbi.nih.gov/media/studies/accord/ACCORDION_Protocol.pdf (cited 2022 Mar 16)..
- 22. ACCORD Study Group, Buse JB, Bigger JT, Byington RP, Cooper LS, Cushman WC, et al. Action to Control Cardiovascular Risk in Diabetes (ACCORD) trial: design and methods. Am J Cardiol 2007;99(12A):21i-33i.Article
- 23. Papademetriou V, Zaheer M, Doumas M, Lovato L, Applegate WB, Tsioufis C, et al. Cardiovascular outcomes in action to control cardiovascular risk in diabetes: impact of blood pressure level and presence of kidney disease. Am J Nephrol 2016;43:271-80.ArticlePubMedPDF
- 24. Elam MB, Ginsberg HN, Lovato LC, Corson M, Largay J, Leiter LA, et al. Association of fenofibrate therapy with long-term cardiovascular risk in statin-treated patients with type 2 diabetes. JAMA Cardiol 2017;2:370-80.ArticlePubMedPMC
- 25. ClinicalTrials.gov: Action to Control Cardiovascular Risk in Diabetes (ACCORD). Available from: https://www.clinicaltrials.gov/ct2/show/NCT00000620 (updated 2016 Nov 22).
- 26. Bangalore S, Messerli FH, Waters DD. Body-weight fluctuations and outcomes in coronary disease. N Engl J Med 2017;377:95-6.Article
- 27. Lee EY, Yang Y, Kim HS, Cho JH, Yoon KH, Chung WS, et al. Effect of visit-to-visit LDL-, HDL-, and non-HDL-cholesterol variability on mortality and cardiovascular outcomes after percutaneous coronary intervention. Atherosclerosis 2018;279:1-9.ArticlePubMed
- 28. Kim DH, Nam GE, Han K, Kim YH, Park KY, Hwang HS, et al. Variabilities in weight and waist circumference and risk of myocardial infarction, stroke, and mortality: a nationwide cohort study. Endocrinol Metab (Seoul) 2020;35:933-42.ArticlePubMedPMCPDF
- 29. Okada H, Hamaguchi M, Habu M, Kurogi K, Murata H, Ito M, et al. Association between variability in body mass index and development of type 2 diabetes: Panasonic cohort study. BMJ Open Diabetes Res Care 2021;9:e002123.ArticlePubMedPMC
- 30. Lim YM, Yang PS, Jang E, Yu HT, Kim TH, Uhm JS, et al. Body mass index variability and long-term risk of new-onset atrial fibrillation in the general population: a Korean Nationwide Cohort Study. Mayo Clin Proc 2019;94:225-35.ArticlePubMed
- 31. Stienen S, Ferreira JP, Girerd N, Duarte K, Lamiral Z, McMurray JJ, et al. Mean BMI, visit-to-visit BMI variability and BMI changes during follow-up in patients with acute myocardial infarction with systolic dysfunction and/or heart failure: insights from the High-Risk Myocardial Infarction Initiative. Clin Res Cardiol 2019;108:1215-25.ArticlePubMedPDF
- 32. Ashraf M, Shokrollahi S, Pisig AU, Sampani K, Abdelal O, Cavallerano JD, et al. Retinal vascular caliber association with nonperfusion and diabetic retinopathy severity depends on vascular caliber measurement location. Ophthalmol Retina 2021;5:571-9.ArticlePubMed
- 33. Ceriello A, Prattichizzo F. Variability of risk factors and diabetes complications. Cardiovasc Diabetol 2021;20:101.ArticlePubMedPMCPDF
- 34. Ahmadi N, Hajsadeghi F, Conneely M, Mingos M, Arora R, Budoff M, et al. Accurate detection of metabolically active “brown” and “white” adipose tissues with computed tomography. Acad Radiol 2013;20:1443-7.ArticlePubMed
- 35. Park K, Lee DH, Erickson DJ, Himes JH, Shikany JM, Jacobs DR Jr. Association of long-term change in waist circumference with insulin resistance. Obesity (Silver Spring) 2010;18:370-6.ArticlePubMedPMCPDF
REFERENCES
Figure & Data
References
Citations
- Association of body mass index and blood pressure variability with 10-year mortality and renal disease progression in type 2 diabetes
Stephen Fava, Sascha Reiff
Acta Diabetologica.2024;[Epub] CrossRef - Waist Circumference and Body Mass Index Variability and Incident Diabetic Microvascular Complications: A Post Hoc Analysis of ACCORD Trial (Diabetes Metab J 2022;46:767-80)
Yun Kyung Cho
Diabetes & Metabolism Journal.2023; 47(1): 147. CrossRef - Waist Circumference and Body Mass Index Variability and Incident Diabetic Microvascular Complications: A Post Hoc Analysis of ACCORD Trial (Diabetes Metab J 2022;46:767-80)
Daniel Nyarko Hukportie, Fu-Rong Li, Rui Zhou, Jia-Zhen Zheng, Xiao-Xiang Wu, Xian-Bo Wu
Diabetes & Metabolism Journal.2023; 47(1): 150. CrossRef - Weight variability and diabetes complications
Francesco Prattichizzo, Chiara Frigé, Rosalba La Grotta, Antonio Ceriello
Diabetes Research and Clinical Practice.2023; 199: 110646. CrossRef - Risk Factors for Diabetic Retinopathy in Latin America (Mexico) and the World: A Systematic Review and Meta-Analysis
Oscar Vivanco-Rojas, Sonia López-Letayf, Valentina Londoño-Angarita, Fátima Sofía Magaña-Guerrero, Beatriz Buentello-Volante, Yonathan Garfias
Journal of Clinical Medicine.2023; 12(20): 6583. CrossRef - Effects of body weight variability on risks of macro- and microvascular outcomes in individuals with type 2 diabetes: The Rio de Janeiro type 2 diabetes cohort
Claudia R.L. Cardoso, Nathalie C. Leite, Gil F. Salles
Diabetes Research and Clinical Practice.2023; 205: 110992. CrossRef - Correlation Between the Variability of Different Obesity Indices and Diabetic Kidney Disease: A Retrospective Cohort Study Based on Populations in Taiwan
Zhenzhen Sun, Kun Wang, Chuan Yun, Fang Bai, Xiaodan Yuan, Yaujiunn Lee, Qingqing Lou
Diabetes, Metabolic Syndrome and Obesity.2023; Volume 16: 2791. CrossRef - Unraveling shared risk factors for diabetic foot ulcer: a comprehensive Mendelian randomization analysis
Kangli Yin, Tianci Qiao, Yongkang Zhang, Jiarui Liu, Yuzhen Wang, Fei Qi, Junlin Deng, Cheng Zhao, Yongcheng Xu, Yemin Cao
BMJ Open Diabetes Research & Care.2023; 11(6): e003523. CrossRef
 PubReader
 ePub Link
 Cite
Cite- Figure
-
- Related articles
-
- Waist Circumference and Body Mass Index Variability and Incident Diabetic Microvascular Complications: A Post Hoc Analysis of ACCORD Trial (Diabetes Metab J 2022;46:767-80)
- Waist Circumference and Body Mass Index Variability and Incident Diabetic Microvascular Complications: A Post Hoc Analysis of ACCORD Trial (Diabetes Metab J 2022;46:767-80)


