
- Current
- Browse
- Collections
-
For contributors
- For Authors
- Instructions to authors
- Article processing charge
- e-submission
- For Reviewers
- Instructions for reviewers
- How to become a reviewer
- Best reviewers
- For Readers
- Readership
- Subscription
- Permission guidelines
- About
- Editorial policy
Articles
- Page Path
- HOME > Diabetes Metab J > Volume 46(6); 2022 > Article
-
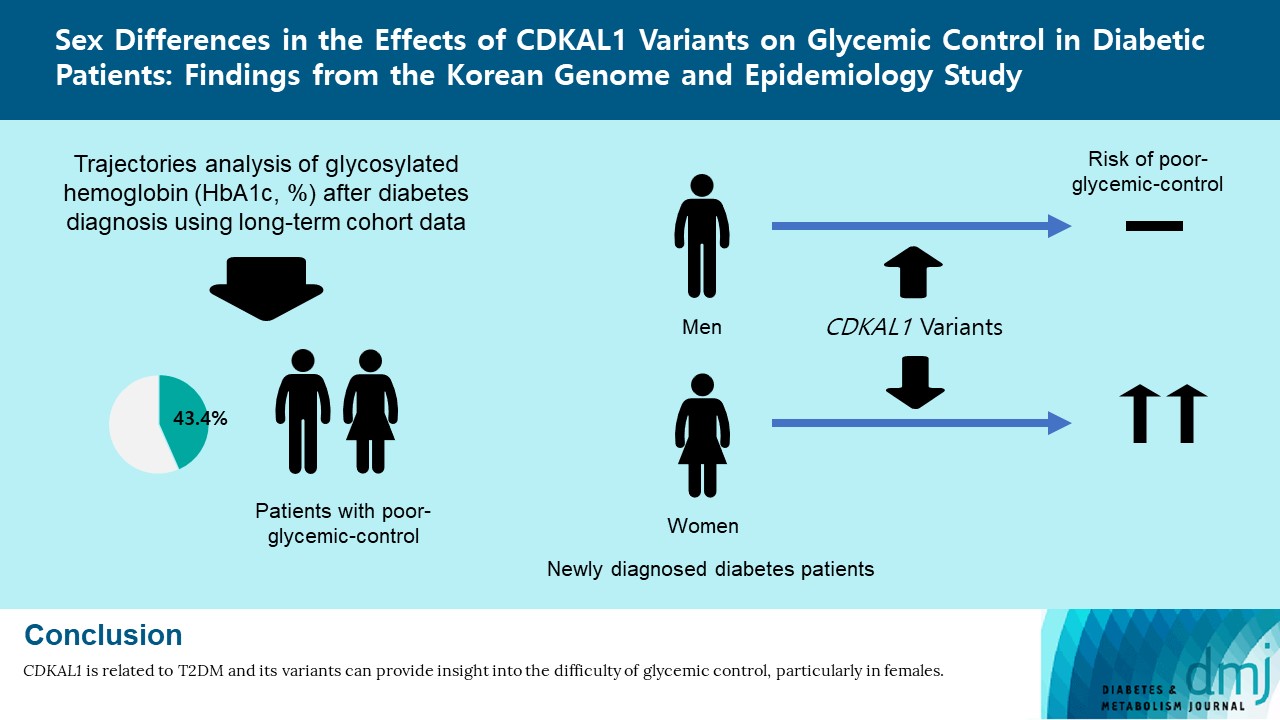
Original ArticleMetabolic Risk/Epidemiology Sex Differences in the Effects of CDKAL1 Variants on Glycemic Control in Diabetic Patients: Findings from the Korean Genome and Epidemiology Study
-
Hye Ah Lee1
 , Hyesook Park2,3, Young Sun Hong4
 -
Diabetes & Metabolism Journal 2022;46(6):879-889.
DOI: https://doi.org/10.4093/dmj.2021.0265
Published online: February 8, 2022
1Clinical Trial Center, Ewha Womans University Mokdong Hospital, Seoul, Korea
2Department of Preventive Medicine, Ewha Womans University College of Medicine, Seoul, Korea
3Graduate Program in System Health Science and Engineering, Ewha Womans University, Seoul, Korea
4Department of Internal Medicine, Ewha Womans University College of Medicine, Seoul, Korea
-
Corresponding author: Hye Ah Lee Clinical Trial Center, Ewha Womans University Mokdong Hospital, 1071 Anyangcheon-ro, Yangcheon-gu, Seoul 07985, Korea E-mail: khyeah@naver.com
Copyright © 2022 Korean Diabetes Association
This is an Open Access article distributed under the terms of the Creative Commons Attribution Non-Commercial License (http://creativecommons.org/licenses/by-nc/4.0/) which permits unrestricted non-commercial use, distribution, and reproduction in any medium, provided the original work is properly cited.
ABSTRACT
-
Background
- Using long-term data from the Korean Genome and Epidemiology Study, we defined poor glycemic control and investigated possible risk factors, including variants related to type 2 diabetes mellitus (T2DM). In addition, we evaluated interaction effects among risk factors for poor glycemic control.
-
Methods
- Among 436 subjects with newly diagnosed diabetes, poor glycemic control was defined based on glycosylated hemoglobin trajectory patterns by group-based trajectory modeling. For the variants related to T2DM, genetic risk scores (GRSs) were calculated and divided into quartiles. Risk factors for poor glycemic control were assessed using a logistic regression model.
-
Results
- Of the subjects, 43% were in the poor-glycemic-control group. Body mass index (BMI) and triglyceride (TG) were associated with poor glycemic control. The risk for poor glycemic control increased by 11.0% per 1 kg/m2 increase in BMI and by 3.0% per 10 mg/dL increase in TG. The risk for GRS with poor glycemic control was sex-dependent (Pinteraction=0.07), and a relationship by GRS quartiles was found in females but not in males. Moreover, the interaction effect was found to be significant on both additive and multiplicative scales. The interaction effect was evident in the variants of cyclin-dependent kinase 5 regulatory subunit-associated protein 1-like (CDKAL1).
-
Conclusion
- Females with risk alleles of variants in CDKAL1 associated with T2DM had a higher risk for poor glycemic control than males.
- Between 1990 and 2017, the global incidence and prevalence of diabetes increased significantly, by 102.9% (from 11.3 million to 22.9 million) and 129.7% (from 211.2 million to 476.0 million), respectively [1]. The estimated number of people with diabetes in South Korea increased from 3.2 million in 2010 to 4.9 million in 2018 [2]. A high body mass index (BMI) and poor environmental or behavioral factors reportedly contribute to the burden of diabetes [1]. Therefore, the prevention and management of diabetes are major public-health issues.
- In diabetic patients, glycemic control is the major goal of treatment, with the aim of preventing complications such as diabetic retinopathy, diabetic nephropathy, and cardiovascular disease (CVD). According to a fact sheet on diabetes in South Korea, only 28.3% of patients achieve the target level of glycemic control (<6.5% glycosylated hemoglobin [HbA1c]) [2]. Studies in Brazil [3], China [4], and Canada [5] have also reported high rates of poor glycemic control. Duration of diabetes, family history, BMI, and unhealthy behaviors are reportedly associated with poor glycemic control [4,6-9]. In addition, there are sex disparities in diabetes management [10]. Studies also reported that adiponectin gene (ADIPQO) [11] and type 2 deiodinase (Dio2) [12] variants are related to glycemic control, and carboxypeptidase A6 (CPA6) and pre-mRNA processing factor 31 (PRPF31) variants are associated with the response to metformin, the first-line treatment for type 2 diabetes mellitus (T2DM) [13]. Although metabolic, behavioral, and genetic factors are related to glycemic control, additional studies are needed considering the ethnic-specific effects of variants and socio-environmental differences. In addition, interactions with genetic factors need to be evaluated to elucidate disease progression. A recent Korean meta-analysis identified 23 variants related to T2DM using the genome-wide association study (GWAS) catalog data [14].
- Therefore, using long-term cohort data, we investigated risk factors, including 23 genetic variants related to T2DM, for poor glycemic control in newly diagnosed diabetic patients. In addition, we assessed interaction effects of genetic determinants on poor glycemic control.
INTRODUCTION
- Data sources and study subjects
- This study used data from the community-based cohort of the Korean Genome and Epidemiology Study (KoGES). Detailed information on this cohort has been published [15]. Briefly, to investigate risk factors for chronic diseases among Koreans, a community-based cohort study was started in 2001 to 2002 and involved residents (aged 40 to 69 years) from two communities (Ansung and Ansan) who agreed to participate. A total of 10,030 participants completed the baseline survey (Ansung, a rural region [n=5,018] and Ansan, an industrial region [n=5,012]). Follow-up data were collected every 2 years and the study is ongoing. The follow-up surveys include questionnaires, anthropometric/biomarker measurements, blood sampling (collected after overnight fasting), and urine tests. This study included data up to the eighth follow-up (conducted in 2017 to 2018; follow-up rate=61.4%).
- The data were reconstructed according to the research objective. We included subjects who responded that they had been diagnosed with diabetes by a physician (n=1,601). Of them, only newly diagnosed patients with diabetes were included during the follow-up period, excluding patients with a history of diabetes in the baseline survey (n=896). In addition, subjects with a history of CVD or cancer prior to diagnosis of diabetes were excluded (n=803). To define the trajectory pattern of HbA1c, we included subjects who reported a diagnosis of diabetes in the first to fifth follow-up surveys (n=542). Finally, we analyzed the data of 436 subjects (228 males and 208 females) after excluding those with insufficient information. The protocol was approved by the Institutional Review Board of Ewha Womans University Hospital (EUMC 2021-03-008). Review board requirement for written informed consent was waived because this study used an anonymous dataset.
- Trajectory of HbA1c
- Except for the first follow-up (2003 to 2004), HbA1c data were collected in all follow-up surveys. To evaluate the pattern of changes in HbA1c after diagnosis, the survey time point at which the subject responded that they had been diagnosed by a physician was defined as the index time, and survey data at subsequent time points were used for trajectory pattern analysis. The average number of HbA1c measurements was 4.6±1.6.
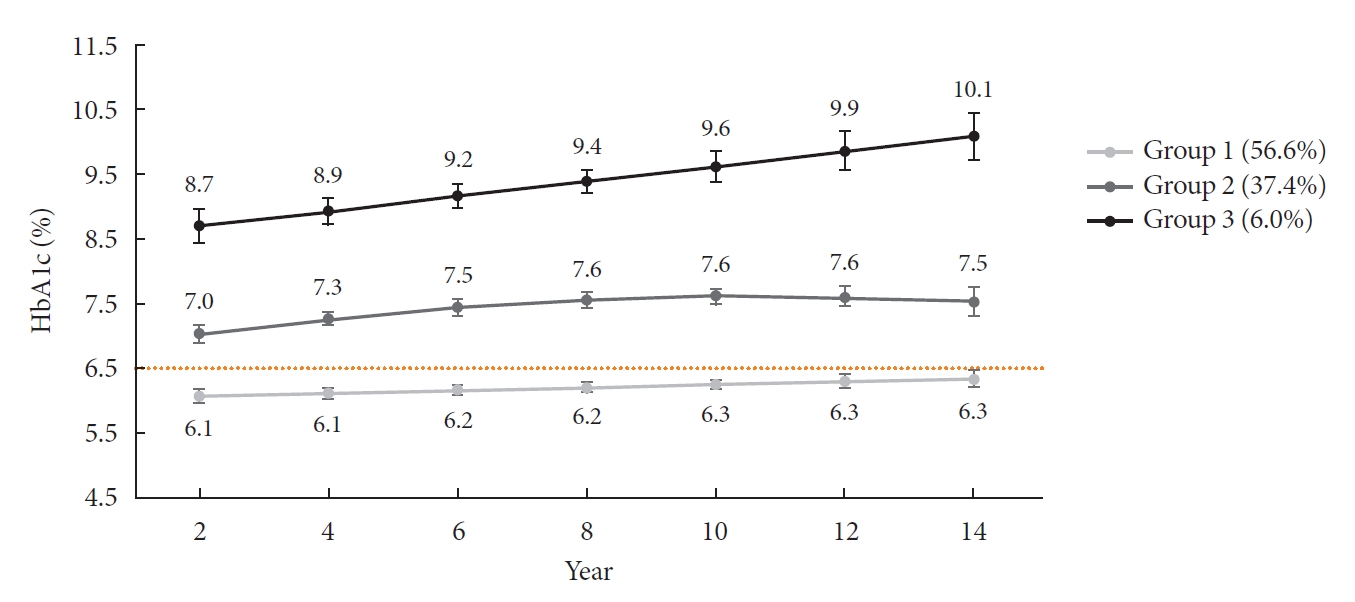
- Based on their pattern of change in Hb1Ac over time, participants were classified into groups using the Proc Traj procedure in SAS software for group-based trajectory modeling [16]. Group-based trajectory modeling is designed to identify clusters of individuals who experience similar changes in an indicator of interest over time. It can specify the number of trajectory groups and different order polynomials for each group. Among the various potential models, reasonable group size (>5%) and Bayesian information criterion (BIC) values are typically used to determine the best-fit model [17]. We calculated the logged Bayes factor (2*ΔBIC) to determine the optimal model [18]. In our data, the BIC values for two (order by each group: linear and linear) and three patterns (order by each group: linear, quadratic, and linear) were −2,959.57 and −2,831.78, respectively. The four-pattern model did not satisfy the group size requirements. Therefore, based on the logged Bayes factor, a three-pattern model was selected instead of a two-pattern model. For the selected model, each individual was assigned to a specific trajectory group based on the highest posterior probability. Sex and age affected the probability of belonging to a particular group, so we included sex and age in the model. The target glycemic control level in diabetic patients is HbA1c <6.5% [2]; the poor-glycemic-control group was defined based on this value.
- Risk factors assessment
- We evaluated potential risk factors for poor glycemic control including demographic factors, age at the time of diabetes diagnosis, metabolic factors, behavioral factors, and genetic factors. BMI (kg/m2), blood pressure (mm Hg), triglyceride (TG, mg/dL), and high-density lipoprotein cholesterol (HDL-C, mg/dL) were analyzed as metabolic factors, and current smoking and alcohol intake (no alcohol, <15, 15–24.9, and ≥25 g/day) [19] as behavioral factors. Metabolic and behavioral factors were evaluated using data at the time the subject responded that they had been diagnosed with diabetes by a physician (i.e., index time). At each follow-up, antidiabetic drug use was investigated, but detailed information on dose, duration, and type was not collected.
- Cho et al. [14] performed a meta-analysis of susceptibility to T2DM using Exom chip KoGES data and the GWAS catalog database; 23 variants were significant. Of the 23 single nucleotide polymorphisms (SNPs), rs10440833, rs4712523, rs7754840, rs4712524, rs10946398, and rs9295474 in cyclin-dependent kinase 5 regulatory subunit-associated protein 1-like (CDKAL1) showed strong linkage (r2≥0.8) in linkage disequilibrium analysis. Therefore, we considered only rs7754840 of CDKAL1 in the genetic risk scores (GRSs) calculation. Using the meta-analysis of Cho et al. [14], weighted GRSs were calculated for 18 variants. Depending on the number of minor alleles, 0, 1, and 2 were assigned and SNPs were weighted with the effect sizes derived from the meta-analysis. These were multiplied by (18/sum of the effect size) [20].
- Statistical analysis
- Results are presented as means with standard deviation or medians with interquartile range for numerical variables, and frequencies with percentage for categorical variables. Differences according to glycemic control group were assessed by t-test, Mann–Whitney U test, and chi-square test.
- As potential risk factors for poor glycemic control, basic characteristics were evaluated by logistic regression model; the results are presented as odds ratios with 95% confidence intervals (95% CIs). Significant risk factors were identified by a stepwise selection method considering basic characteristics except for overlapping variables. Multivariate analysis was performed by adding sex, age, and weighted GRSs to the selected variables. Interaction effects were also evaluated for the variables included in multivariate analysis. Quantitative interactions for poor glycemic control were assessed on additive and multiplicative scales [21]. Additive scales were assessed using the relative excess risk due to interaction (RERI). We evaluated the interactions with 23 SNPs for poor glycemic control as an additional measure.
- A mixed-model analysis was performed to estimate differences in HbA1c according to genotype by sex. A random-intercept model was constructed to include group (i.e., genotype), measurement time point, and the interaction between group and measurement time point as fixed effects, as well as the covariates from the multivariate model. The covariance structure for the model was determined according to low BIC values. The results are presented as least-squares means with 95% CIs. In addition, as the sensitivity analysis, an analysis of those taking antidiabetic drugs at index time was performed.
- All statistical analyses were conducted using SAS software version 9.4 (SAS Institute, Cary, NC, USA). Statistical significance was determined as a value of P<0.05 in a two-tailed test.
METHODS
- The HbA1c trajectory was classified into three patterns, and 43% of the subjects (n=189; group 2 and group 3) showed a higher than target HbA1c value (HbA1c ≥6.5%); they made up the poor-glycemic-control group. Of them, 6.0% (n=26, group 3) showed a persistent deterioration in mean HbA1c during the observation period (Fig. 1).
- The basic characteristics of the subjects are listed in Table 1. The average age at the time of diabetes diagnosis was 56.1 years, and 47.7% of the subjects were female. Of the subjects recently diagnosed with diabetes by a physician, about 60.0% had a BMI ≥25.0 kg/m2. Of the subjects, 52.4% and 63.3% had a high TG level and low HDL-C level, respectively, but the percentage of diagnosis by a physician was only 14.9%. Furthermore, about 20% of the subjects were current smokers. When compared according to glycemic control group, there were differences in BMI and TG, with higher average value in the poor-glycemic-control group. Antidiabetic drug intake was generally higher in the poor-glycemic-control group during the follow-up period (Supplementary Fig. 1).
- BMI and TG were significantly associated with poor glycemic control. The risk for poor glycemic control increased by 11.0% per 1 kg/m2 increase in BMI and by 3.0% per 10 mg/dL increase in TG. Those in the highest quartile of GRS had a 1.3-fold (95% CI, 0.7 to 2.3) greater risk for poor glycemic control than those in the lowest quartile, but it was not significant (Table 2). In addition, among the interactions of the risk factors selected in the multivariate model, that between sex and GRS was a borderline significant (P=0.07).
- Results for quartiles of weighted GRS and sex interaction for poor glycemic control are shown in Table 3. For poor glycemic control, a relationship by GRS quartiles was found in females but not in males. The quartiles of GRS in females was found to be a synergistic effect for poor glycemic control, irrespective of the interaction scale.
- Of the 23 SNPs, rs10440833, rs4712523, rs7754840, rs4712524, rs10946398, and rs9295474 in CDKAL1 showed an insignificant interaction with sex in terms of the Bonferroni-correction for multiple comparisons (Supplementary Table 1). However, when the associations were stratified on the basis of sex, distinct associations were observed only in females (Supplementary Table 2). The additive interactions of these SNPs were clear in female homozygous carriers of the minor allele (Table 4). Evaluation according to rs7754840 and rs10440833 genotypes showed that the mean HbA1c values tended to be higher in the presence of risk alleles, and the average values differed significantly according to genotype (Fig. 2). When evaluated in subjects taking antidiabetic drugs at the time of index assessment, the risk for poor glycemic control in females differed according to GRS level. In females, the quartiles of GRS was linked to an increased risk for poor glycemic control (data not shown).
RESULTS
- Using long-term observational data, we evaluated poor glycemic control as defined by the HbA1c trajectory. Our study showed genetic predisposition to T2DM to be related to glycemic control in diabetic patients and to differ by sex. In addition, its interaction effect was evident in the variants of CDKAL1.
- CDKAL1 is reportedly linked to predisposition to T2DM through GWASs in various ethnicities [14]. The C allele of the CDKAL1 rs7754840 G/C polymorphism was significantly associated with an increased risk for T2DM based on a meta-analysis of 32 independent studies [22]. A recent GWAS based on six independent cohorts also found that CDKAL1 variants were associated with beta-cell glucose sensitivity [23]. CDKAL1 has enzymatic activity, and CDKAL1 may be related to pancreatic beta-cell function and insulin resistance [22].
- Our study showed that CDKAL1 variants were associated with poor glycemic control, and the association was stronger in females than in males. Indeed, sex differences were found in the association between rs7756992 and rs9465871 in CDKAL1 and T2DM, and the association was stronger in females than in males [24]. A study on the Yup’ik people from Southwest Alaska [25] showed that the association between rs7754840 in CDKAL1 and HbA1c was significant in females but not in males. In a meta-analysis, sex contributed to the heterogeneity of the association between rs7754840 in CDKAL1 and T2DM [26]. However, a study in Taiwan found no sex difference in the association between rs10946398 of CDKAL1 and T2DM [27]. Although genetic variation was not taken into account, the Multi-factorial Intervention in type 2 Diabetes in Italy (MIND. IT) study found that diabetic females had worse glucose control and CVD risk factor control than diabetic males [10]. In this regard, X-chromosome-based gene-gene interactions, sex hormones, and sex-specific lifestyle factors may be associated with disease risk [26,28]. It has been suggested that differences in BMI by sex may contribute to the progression of T2DM [27]. In this study, the mean BMI of males and females did not significantly different (Supplementary Table 3), and BMI had an independent effect on poor glycemic control. However, studies evaluating the interactions of genetic determinants with sex for poor glycemic control are lacking, which hampers comparisons.
- Among six CDKAL1 variants, rs7754840 and four others (rs4712523, rs4712524, rs9295474, and rs10946398) were in complete linkage (r2=1.0) and rs10440833 was in strong linkage (r2=0.8). This strong linkage was also detected in Han Chinese and British populations in the GWAS catalog. Therefore, females with a risk allele in any of the six variants may have difficulty controlling their glucose levels. These findings need to be confirmed by further research.
- During the observation period, levels of HbA1c were high in the poor-glycemic-control group, despite the high rate of antidiabetic drug use (Supplementary Fig. 1). The therapeutic response can vary depending on genotype. The therapeutic response has been evaluated according to variants in transcription factor 7-like 2 (TCF7L2) [29], CDKAL1 [30], CPA6, and PRPF31 [13]. One study evaluated sulphonylurea treatment in subjects who failed to achieve glycemic control on metformin monotherapy, and carriers of the G-allele for CDKAL1 rs7756992 showed significant reductions in fasting blood glucose [31]. Although we did not evaluate drug use, we defined poor-glycemic-control groups using repeated measurements and identified related genes. Poor glycemic control can have a lasting effect on diabetic complications and prognoses [32]. Regarding diabetes mellitus complications, one study reported that rs10946398 of CDKAL1 was associated with an increased risk for diabetic retinopathy [33]. Genetic information can assist in selection of the appropriate treatment to improve glycemic control.
- Our study found that a high TG level and BMI were independently associated with poor glycemic control. BMI is a major risk factor for T2DM and a high BMI is associated with poor glycemic control [4]. Considering BMI as a time-varying factor, a high BMI had a persistent effect on a poor HbA1c level (data not shown). Because BMI affects incident CVD, it is necessary to emphasize weight control for glycemic control and prevention of complications in diabetic patients. Hypertriglyceridemia can develop due to poor glycemic control [34]. Although we evaluated TG levels prior to definition of the poor-glycemic-control group, the group had high HbA1c levels at the time of index assessment, which were likely related to TG levels. A high TG level is a risk factor for incident T2DM [35], and can worsen insulin sensitivity, so management of TG has been suggested for glycemic control [36]. In addition, a meta-analysis showed that higher TG levels increased the risk for coronary heart disease in T2DM [37]. In this study, 52.4% and 63.3% of the subjects had a high TG level and low HDL-C level, respectively, but only 14.9% were aware of dyslipidemia. According to Korean diabetes fact sheets, the rate of target achievement in comprehensive management (HbA1c <6.5%, blood pressure <140/85 mm Hg, and low-density lipoprotein cholesterol <100 mg/dL) was 11.5% [2]. Comorbidities in patients with diabetes can affect the risk for CVD, so comprehensive management, together with glycemic control, is required.
- Our study has several strengths and limitations. Our findings were derived from two communities, and so may be generalizable to the general population of South Korea. Inclusion of only newly diagnosed diabetes patients resulted in a small sample size but prevented bias due to the duration of diabetes. Factors related to diabetes management such as self-monitoring of blood glucose, foot care, dietary control, and drug compliance were not considered due to a lack of data. We also did not consider the effects of physical activity and diet on glycemic control because no such data were collected in the follow-up survey. In the GRS calculation, weight information (i.e., coefficients) was estimated from KoGES data including the subjects in this study. There may be an overfitting problem whereby the estimate of the predictive power of the GRS could be inflated [38]. Therefore, these results should be interpreted with caution. Nevertheless, we designed the study with temporal relationships in mind, and relevance was evaluated using repeated measures. We also defined the poor-glycemic-control group based on long-term data, possibly reducing the probability of misclassification bias for poor glycemic control. In addition, our study observed that poor glycemic control can persist. Additive interaction was evaluated in terms of biological interaction, and quantitative relevance was presented. A recent meta-analysis of GWAS data from East Asians reported 301 distinct association signals from 183 loci associated with T2DM [39]. Therefore, it is necessary to expand this study and evaluate these associations in future studies.
- CDKAL1 is related to T2DM and its variants can provide insight into the difficulty of glycemic control, particularly in females. For clinical application, further studies should monitor HbA1c levels and drug responses according to CDKAL1 variant.
DISCUSSION
SUPPLEMENTARY MATERIALS
Supplementary Table 1.
Supplementary Table 2.
Supplementary Table 3.
Supplementary Fig. 1.
-
CONFLICTS OF INTEREST
No potential conflict of interest relevant to this article was reported.
-
AUTHOR CONTRIBUTIONS
Conception or design: H.A.L.
Acquisition, analysis, or interpretation of data: H.A.L., H.P., Y.S.H.
Drafting the work or revising: H.A.L., H.P., Y.S.H.
Final approval of the manuscript: H.A.L., H.P., Y.S.H.
-
FUNDING
This work was supported by the National Research Foundation of Korea (NRF) grant funded by the Korea government (MSIT) (No. 2021R1A2C1003176). It had no role in the design, analysis or writing of this article.
NOTES
-
Acknowledgements
- This study was conducted with bioresources from National Biobank of Korea, the Korea Disease Control and Prevention Agency, Republic of Korea (KBN-2021-024).

Groups 2 and 3 were defined as poor glycemic control as the outcome of interest.
OR, odds ratio; CI, confidence interval; BMI, body mass index; TG, triglyceride; HDL-C, high-density lipoprotein cholesterol; SBP, systolic blood pressure; DBP, diastolic blood pressure; HTN, hypertension; GRS, genetic risk score.
|
Quartiles of weighted GRS |
Within strata of sex |
||||||
|---|---|---|---|---|---|---|---|
| Q1 | Q2 | Q3 | Q4 | Q2 vs. Q1 | Q3 vs. Q1 | Q4 vs. Q1 | |
| Male | |||||||
| No. with/without outcome | 25/28 | 20/34 | 15/31 | 22/36 | |||
| OR (95% CI) | Reference | 0.64 (0.29–1.44) | 0.57 (0.24–1.36) | 0.72 (0.32–1.62) | 0.64 (0.29–1.44) | 0.57 (0.24–1.36) | 0.72 (0.32–1.62) |
| Female | |||||||
| No. with/without outcome | 13/33 | 24/22 | 26/26 | 20/21 | |||
| OR (95% CI) | 0.52 (0.22–1.25) | 1.66 (0.72–3.84) | 1.37 (0.61–3.09) | 1.28 (0.54–3.01) | 3.18 (1.31–7.70) | 2.62 (1.11–6.22) | 2.44 (0.98–6.07) |
| Female vs. male, OR (95% CI) | 0.52 (0.22–1.25) | 2.59 (1.11–6.06) | 2.40 (1.00–5.76) | 1.78 (0.75–4.25) | |||
| Measure of interaction on additive scale, RERIa (95% CI) | 1.50 (0.33–2.67) | 1.28 (0.33–2.23) | 1.04 (0.06–2.01) | ||||
| Measure of interaction on multiplicative scale, ratio of ORs (95% CI) | 4.95 (1.49–16.48) | 4.58 (1.35–15.57) | 3.41 (1.01–11.51) | ||||
Groups 2 and 3 were defined as poor glycemic control as the outcome of interest. “No. with outcome” represents the number of subjects in the poor glycemic control group, while the remaining subjects are represented as “No. without outcome.” OR and 95% CI were estimated after adjusting for age at diagnosis of diabetes, body mass index, and triglycerides measured at follow-up at the time of reporting a diagnosis of diabetes.
GRS, genetic risk score; OR, odds ratio; CI, confidence interval; RERI, relative excess risk due to interaction.
a If the 95% CIs of RERI do not include 0, then there is an interaction.
| SNP | Gene | Minor allele | MAF | Sex/RERI |
OR (95% CI) |
||
|---|---|---|---|---|---|---|---|
| Major-allele homozygotes | Heterozygotes | Minor-allele homozygotes | |||||
| rs4712523 | CDKAL1 | G | 0.491 | Male | Reference | 0.98 (0.48 to 2.02) | 1.35 (0.59 to 3.09) |
| Female | 0.68 (0.27 to 1.73) | 1.54 (0.73 to 3.28) | 3.31 (1.45 to 7.54) | ||||
| RERIa | 0.88 (–0.07 to 1.83) | 2.28 (0.04 to 4.51) | |||||
| rs4712524 | CDKAL1 | G | 0.481 | Male | Reference | 1.36 (0.67 to 2.77) | 1.44 (0.63 to 3.29) |
| Female | 0.77 (0.31 to 1.93) | 1.89 (0.90 to 3.99) | 3.94 (1.75 to 8.89) | ||||
| RERIa | 0.76 (–0.43 to 1.94) | 2.73 (0.06 to 5.40) | |||||
| rs7754840 | CDKAL1 | C | 0.481 | Male | Reference | 1.36 (0.67 to 2.77) | 1.44 (0.63 to 3.29) |
| Female | 0.77 (0.31 to 1.93) | 1.89 (0.90 to 3.99) | 3.94 (1.75 to 8.89) | ||||
| RERIa | 0.76 (–0.43 to 1.94) | 2.73 (0.06 to 5.40) | |||||
| rs9295474 | CDKAL1 | G | 0.493 | Male | Reference | 0.97 (0.47 to 1.99) | 1.19 (0.52 to 2.73) |
| Female | 0.65 (0.26 to 1.66) | 1.48 (0.70 to 3.15) | 3.18 (1.39 to 7.24) | ||||
| RERIa | 0.99 (0.03 to 1.95) | 2.33 (0.18 to 4.48) | |||||
| rs10440833 | CDKAL1 | A | 0.467 | Male | Reference | 1.33 (0.67 to 2.65) | 1.27 (0.57 to 2.87) |
| Female | 0.76 (0.32 to 1.82) | 2.05 (1.00 to 4.18) | 3.56 (1.57 to 8.04) | ||||
| RERIa | 0.96 (–0.24 to 2.16) | 2.52 (0.03 to 4.98) | |||||
| rs10946398 | CDKAL1 | C | 0.481 | Male | Reference | 1.36 (0.67 to 2.77) | 1.44 (0.63 to 3.29) |
| Female | 0.77 (0.31 to 1.93) | 1.89 (0.90 to 3.99) | 3.94 (1.75 to 8.89) | ||||
| RERIa | 0.76 (–0.43 to 1.94) | 2.73 (0.06 to 5.40) | |||||
Groups 2 and 3 were defined as poor glycemic control as the outcome of interest. OR and 95% CI were estimated after adjusting for age at diagnosis of diabetes, body mass index, and triglycerides measured at follow-up at the time of reporting a diagnosis of diabetes.
SNP, single nucleotide polymorphism; MAF, minor allele frequency; RERI, relative excess risk due to interaction; OR, odds ratio; CI, confidence interval.
a If the 95% CIs of RERI do not include 0, then there is an interaction.
- 1. Lin X, Xu Y, Pan X, Xu J, Ding Y, Sun X, et al. Global, regional, and national burden and trend of diabetes in 195 countries and territories: an analysis from 1990 to 2025. Sci Rep 2020;10:14790.ArticlePubMedPMCPDF
- 2. Jung CH, Son JW, Kang S, Kim WJ, Kim HS, Kim HS, et al. Diabetes fact sheets in Korea, 2020: an appraisal of current status. Diabetes Metab J 2021;45:1-10.ArticlePubMedPMCPDF
- 3. Viana LV, Leitao CB, Kramer CK, Zucatti AT, Jezini DL, Felicio J, et al. Poor glycaemic control in Brazilian patients with type 2 diabetes attending the public healthcare system: a cross-sectional study. BMJ Open 2013;3:e003336.ArticlePubMedPMC
- 4. Lu J, Weng J, Gu W, Guo X, Yang W, Zou D, et al. Non-pharmaceutical factors for poor glycemic control in 13,970 Chinese women with drug-treated type 2 diabetes: a cross-sectional survey in 77 tertiary hospitals in four Chinese cities. Patient Prefer Adherence 2014;8:1161-7.PubMedPMC
- 5. Aronson R, Orzech N, Ye C, Goldenberg R, Brown V. Specialist-led diabetes registries and predictors of poor glycemic control in type 2 diabetes: insights into the functionally refractory patient from the LMC Diabetes Registry database. J Diabetes 2016;8:76-85.ArticlePubMedPDF
- 6. Haghighatpanah M, Nejad A, Haghighatpanah M, Thunga G, Mallayasamy S. Factors that correlate with poor glycemic control in type 2 diabetes mellitus patients with complications. Osong Public Health Res Perspect 2018;9:167-74.ArticlePubMedPMCPDF
- 7. Kayar Y, Ilhan A, Kayar NB, Unver N, Coban G, Ekinci I, et al. Relationship between the poor glycemic control and risk factors, life style and complications. Biome Res 2017;28:1581-6.
- 8. Lima RF, Fontbonne A, Carvalho EM, Montarroyos UR, Barreto MN, Cesse EA. Factors associated with glycemic control in people with diabetes at the Family Health Strategy in Pernambuco. Rev Esc Enferm USP 2016;50:937-45.ArticlePubMed
- 9. Cai X, Hu D, Pan C, Li G, Lu J, Ji Q, et al. The risk factors of glycemic control, blood pressure control, lipid control in Chinese patients with newly diagnosed type 2 diabetes: a nationwide prospective cohort study. Sci Rep 2019;9:7709.ArticlePubMedPMCPDF
- 10. Franzini L, Ardigo D, Cavalot F, Miccoli R, Rivellese AA, Trovati M, et al. Women show worse control of type 2 diabetes and cardiovascular disease risk factors than men: results from the MIND.IT Study Group of the Italian Society of Diabetology. Nutr Metab Cardiovasc Dis 2013;23:235-41.ArticlePubMed
- 11. Al-Azzam SI, Khabour OF, Alzoubi KH, Mukattash TL, Ghanma M, Saleh H. The role of adiponectin gene variants in glycemic control in patients with type 2 diabetes. Endocr Res 2014;39:13-7.ArticlePubMed
- 12. Zhang X, Sun J, Han W, Jiang Y, Peng S, Shan Z, et al. The type 2 deiodinase Thr92Ala polymorphism is associated with worse glycemic control in patients with type 2 diabetes mellitus: a systematic review and meta-analysis. J Diabetes Res 2016;2016:5928726.ArticlePubMedPMCPDF
- 13. Rotroff DM, Yee SW, Zhou K, Marvel SW, Shah HS, Jack JR, et al. Genetic variants in CPA6 and PRPF31 are associated with variation in response to metformin in individuals with type 2 diabetes. Diabetes 2018;67:1428-40.ArticlePubMedPMCPDF
- 14. Cho SB, Jang JH, Chung MG, Kim SC. Exome chip analysis of 14,026 Koreans reveals known and newly discovered genetic loci associated with type 2 diabetes mellitus. Diabetes Metab J 2021;45:231-40.ArticlePubMedPMCPDF
- 15. Kim Y, Han BG; KoGES group. Cohort profile: the Korean Genome and Epidemiology Study (KoGES) consortium. Int J Epidemiol 2017;46:e20.ArticlePubMedPMC
- 16. Jones BL, Nagin DS, Roeder K. A SAS procedure based on mixture models for estimating developmental trajectories. Sociol Methods Res 2001;29:374-93.ArticlePDF
- 17. Baumgartner SE, Leydesdorff L. Group-based trajectory modeling (GBTM) of citations in scholarly literature: dynamic qualities of “transient” and “sticky knowledge claims”. J Am Soc Inf Sci Technol 2014;65:797-811.Article
- 18. Andruff H, Carraro N, Thompson A, Gaudreau P, Louvet B. Latent class growth modelling: a tutorial. Tutor Quant Methods Psychol 2009;5:11-24.Article
- 19. Costanzo S, Di Castelnuovo A, Donati MB, Iacoviello L, de Gaetano G. Alcohol consumption and mortality in patients with cardiovascular disease: a meta-analysis. J Am Coll Cardiol 2010;55:1339-47.PubMed
- 20. Wang T, Huang T, Heianza Y, Sun D, Zheng Y, Ma W, et al. Genetic susceptibility, change in physical activity, and long-term weight gain. Diabetes 2017;66:2704-12.ArticlePubMedPMCPDF
- 21. Knol MJ, VanderWeele TJ. Recommendations for presenting analyses of effect modification and interaction. Int J Epidemiol 2012;41:514-20.ArticlePubMedPMC
- 22. Tuerxunyiming M, Mohemaiti P, Wufuer H, Tuheti A. Association of rs7754840 G/C polymorphisms in CDKAL1 with type 2 diabetes: a meta-analysis of 70141 subjects. Int J Clin Exp Med 2015;8:17392-405.PubMedPMC
- 23. Deshmukh HA, Madsen AL, Vinuela A, Have CT, Grarup N, Tura A, et al. Genome-wide association analysis of pancreatic beta-cell glucose sensitivity. J Clin Endocrinol Metab 2021;106:80-90.ArticlePubMedPMCPDF
- 24. Ryoo H, Woo J, Kim Y, Lee C. Heterogeneity of genetic associations of CDKAL1 and HHEX with susceptibility of type 2 diabetes mellitus by gender. Eur J Hum Genet 2011;19:672-5.ArticlePubMedPMCPDF
- 25. Klimentidis YC, Lemas DJ, Wiener HH, O’Brien DM, Havel PJ, Stanhope KL, et al. CDKAL1 and HHEX are associated with type 2 diabetes-related traits among Yup’ik people. J Diabetes 2014;6:251-9.PubMed
- 26. Peng F, Hu D, Gu C, Li X, Li Y, Jia N, et al. The relationship between five widely-evaluated variants in CDKN2A/B and CDKAL1 genes and the risk of type 2 diabetes: a meta-analysis. Gene 2013;531:435-43.ArticlePubMed
- 27. Nfor ON, Wu MF, Lee CT, Wang L, Liu WH, Tantoh DM, et al. Body mass index modulates the association between CDKAL1 rs10946398 variant and type 2 diabetes among Taiwanese women. Sci Rep 2018;8:13235.ArticlePubMedPMCPDF
- 28. Margolis KL, Bonds DE, Rodabough RJ, Tinker L, Phillips LS, Allen C, et al. Effect of oestrogen plus progestin on the incidence of diabetes in postmenopausal women: results from the Women’s Health Initiative Hormone Trial. Diabetologia 2004;47:1175-87.ArticlePubMedPDF
- 29. Schroner Z, Javorsky M, Tkacova R, Klimcakova L, Dobrikova M, Habalova V, et al. Effect of sulphonylurea treatment on glycaemic control is related to TCF7L2 genotype in patients with type 2 diabetes. Diabetes Obes Metab 2011;13:89-91.Article
- 30. Soltani G, Hatefi Z, Salehi AR, Khosravi S, Ghiasi MR, Teke K, et al. Pharmacogenomics of sulfonylureas response in relation to rs7754840 polymorphisms in cyclin-dependent kinase 5 regulatory subunit-associated protein 1-like (CDKAL1) gene in Iranian type 2 diabetes patients. Adv Biomed Res 2018;7:96.ArticlePubMedPMC
- 31. Schroner Z, Javorsky M, Haluskova J, Klimcakova L, Babjakova E, Fabianova M, et al. Variation in CDKAL1 gene is associated with therapeutic response to sulphonylureas. Physiol Res 2012;61:177-83.ArticlePubMed
- 32. ADVANCE Collaborative Group, Patel A, MacMahon S, Chalmers J, Neal B, Billot L, et al. Intensive blood glucose control and vascular outcomes in patients with type 2 diabetes. N Engl J Med 2008;358:2560-72.ArticlePubMed
- 33. Liu NJ, Xiong Q, Wu HH, Li YL, Yang Z, Tao XM, et al. The association analysis polymorphism of CDKAL1 and diabetic retinopathy in Chinese Han population. Int J Ophthalmol 2016;9:707-12.PubMedPMC
- 34. Jialal I, Amess W, Kaur M. Management of hypertriglyceridemia in the diabetic patient. Curr Diab Rep 2010;10:316-20.ArticlePubMedPMC
- 35. Zhao J, Zhang Y, Wei F, Song J, Cao Z, Chen C, et al. Triglyceride is an independent predictor of type 2 diabetes among middle-aged and older adults: a prospective study with 8-year follow-ups in two cohorts. J Transl Med 2019;17:403.ArticlePubMedPMCPDF
- 36. Zheng D, Dou J, Liu G, Pan Y, Yan Y, Liu F, et al. Association between triglyceride level and glycemic control among insulintreated patients with type 2 diabetes. J Clin Endocrinol Metab 2019;104:1211-20.ArticlePubMed
- 37. Ye X, Kong W, Zafar MI, Chen LL. Serum triglycerides as a risk factor for cardiovascular diseases in type 2 diabetes mellitus: a systematic review and meta-analysis of prospective studies. Cardiovasc Diabetol 2019;18:48.ArticlePubMedPMCPDF
- 38. Choi SW, Mak TS, O’Reilly PF. Tutorial: a guide to performing polygenic risk score analyses. Nat Protoc 2020;15:2759-72.ArticlePubMedPMCPDF
- 39. Spracklen CN, Horikoshi M, Kim YJ, Lin K, Bragg F, Moon S, et al. Identification of type 2 diabetes loci in 433,540 East Asian individuals. Nature 2020;582:240-5.PubMedPMC
REFERENCES
Figure & Data
References
Citations
- Hepatic Cdkal1 deletion regulates HDL catabolism and promotes reverse cholesterol transport
Dan Bi An, Soo-jin Ann, Seungmin Seok, Yura Kang, Sang-Hak Lee
Atherosclerosis.2023; 375: 21. CrossRef
 PubReader
 ePub Link
 Cite
Cite


