- Current
- Browse
- Collections
-
For contributors
- For Authors
- Instructions to authors
- Article processing charge
- e-submission
- For Reviewers
- Instructions for reviewers
- How to become a reviewer
- Best reviewers
- For Readers
- Readership
- Subscription
- Permission guidelines
- About
- Editorial policy
Articles
- Page Path
- HOME > Diabetes Metab J > Volume 46(1); 2022 > Article
-
Original ArticleComplications Influence of Glucose Fluctuation on Peripheral Nerve Damage in Streptozotocin-Induced Diabetic Rats
-
Yu Ji Kim
 , Na Young Lee, Kyung Ae Lee, Tae Sun Park, Heung Yong Jin
 -
Diabetes & Metabolism Journal 2022;46(1):117-128.
DOI: https://doi.org/10.4093/dmj.2020.0275
Published online: September 9, 2021
Division of Endocrinology and Metabolism, Department of Internal Medicine, Research Institute of Clinical Medicine of Jeonbuk National University Medical School-Biomedical Research Institute of Jeonbuk National University Hospital, Jeonju, Korea
-
Corresponding author: Heung Yong Jin Division of Endocrinology and Metabolism, Department of Internal Medicine, Jeonbuk National University Medical School, 20 Geonji-ro, Deokjin-gu, Jeonju 54907, Korea E-mail: mdjinhy@jbnu.ac.kr
Copyright © 2022 Korean Diabetes Association
This is an Open Access article distributed under the terms of the Creative Commons Attribution Non-Commercial License (http://creativecommons.org/licenses/by-nc/4.0/) which permits unrestricted non-commercial use, distribution, and reproduction in any medium, provided the original work is properly cited.
ABSTRACT
-
Background
- It is unclear whether glycemic variability (GV) is a risk factor for diabetic peripheral neuropathy (DPN), and whether control of GV is beneficial for DPN. The purpose of this study was to investigate the effect of GV on peripheral nerve damage by inducing glucose fluctuation in streptozotocin-induced diabetic rats.
-
Methods
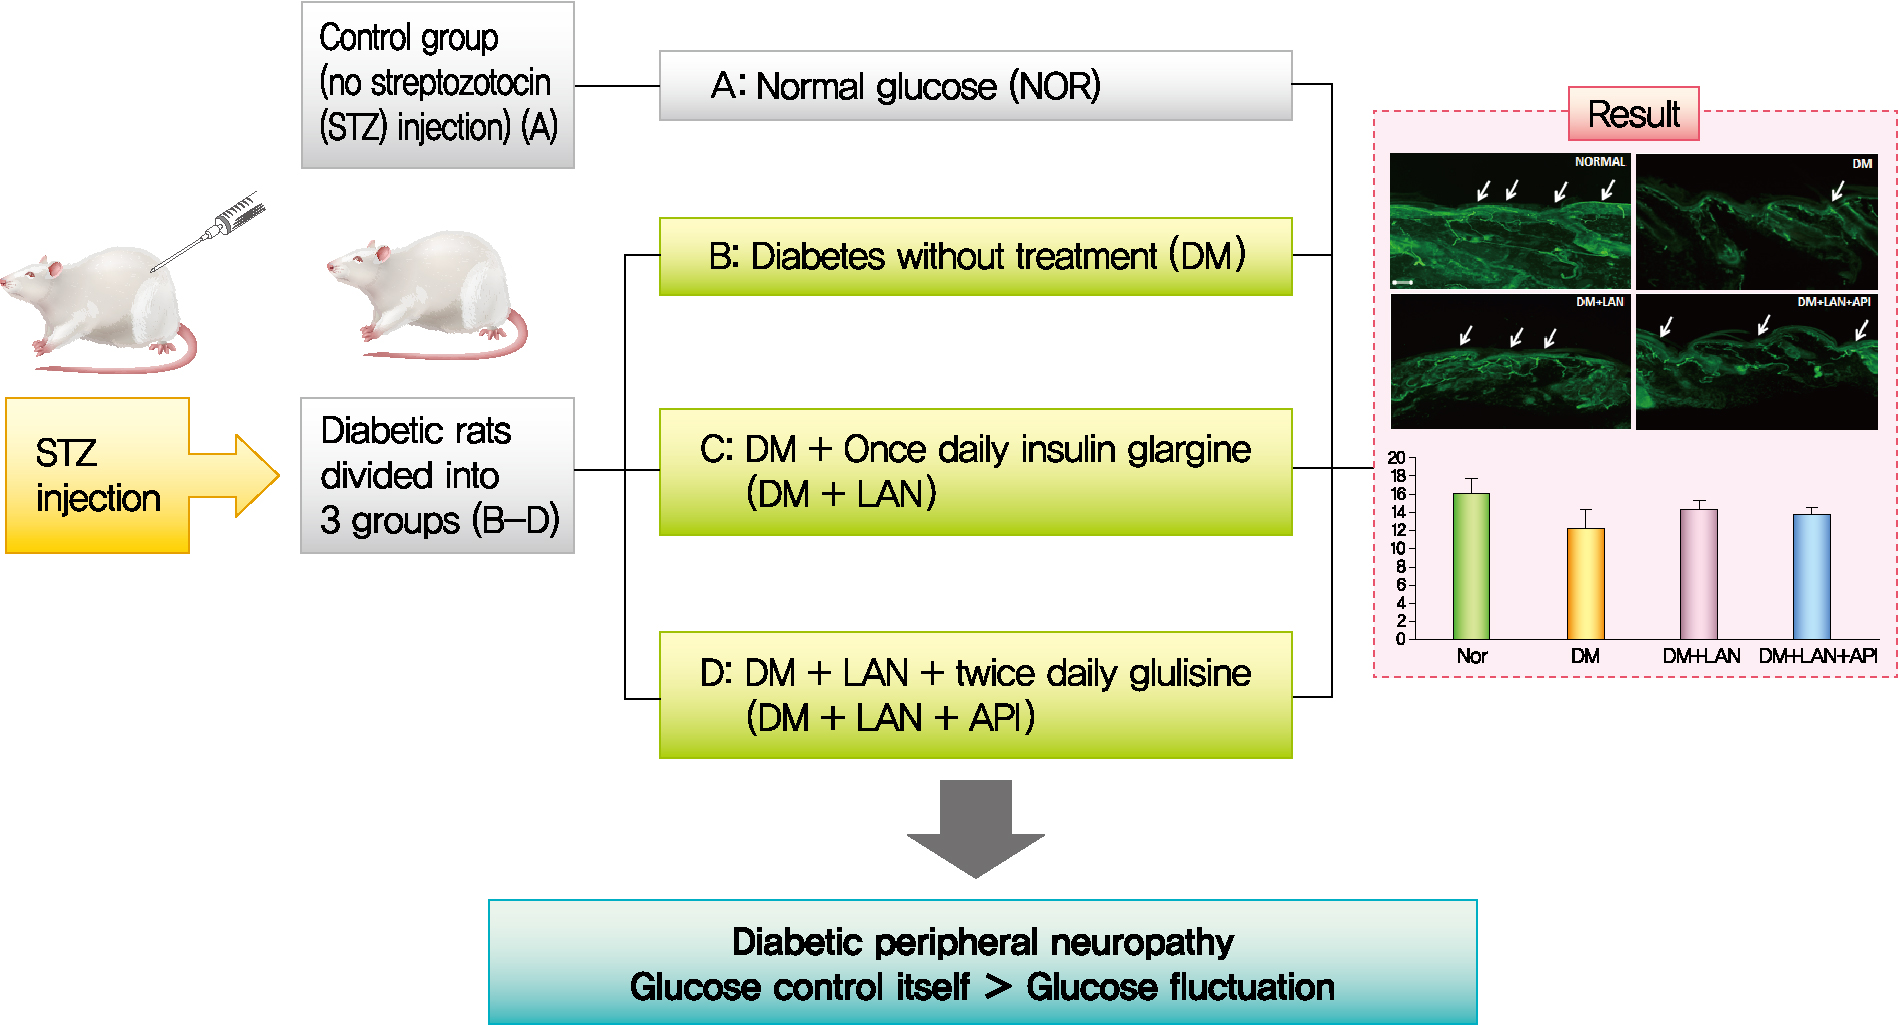
- Rats were divided into four groups: normal (normal glucose group [NOR]), diabetes without treatment (sustained severe hyperglycemia group; diabetes mellitus [DM]), diabetes+once daily insulin glargine (stable hyperglycemia group; DM+LAN), and diabetes+once daily insulin glargine with twice daily insulin glulisine (unstable glucose fluctuation group; DM+Lantus [LAN]+Apidra [API]). We measured anti-oxidant enzyme levels and behavioral responses against tactile, thermal, and pressure stimuli in the plasma of rats. We also performed a quantitative comparison of cutaneous and sciatic nerves according to glucose fluctuation.
-
Results
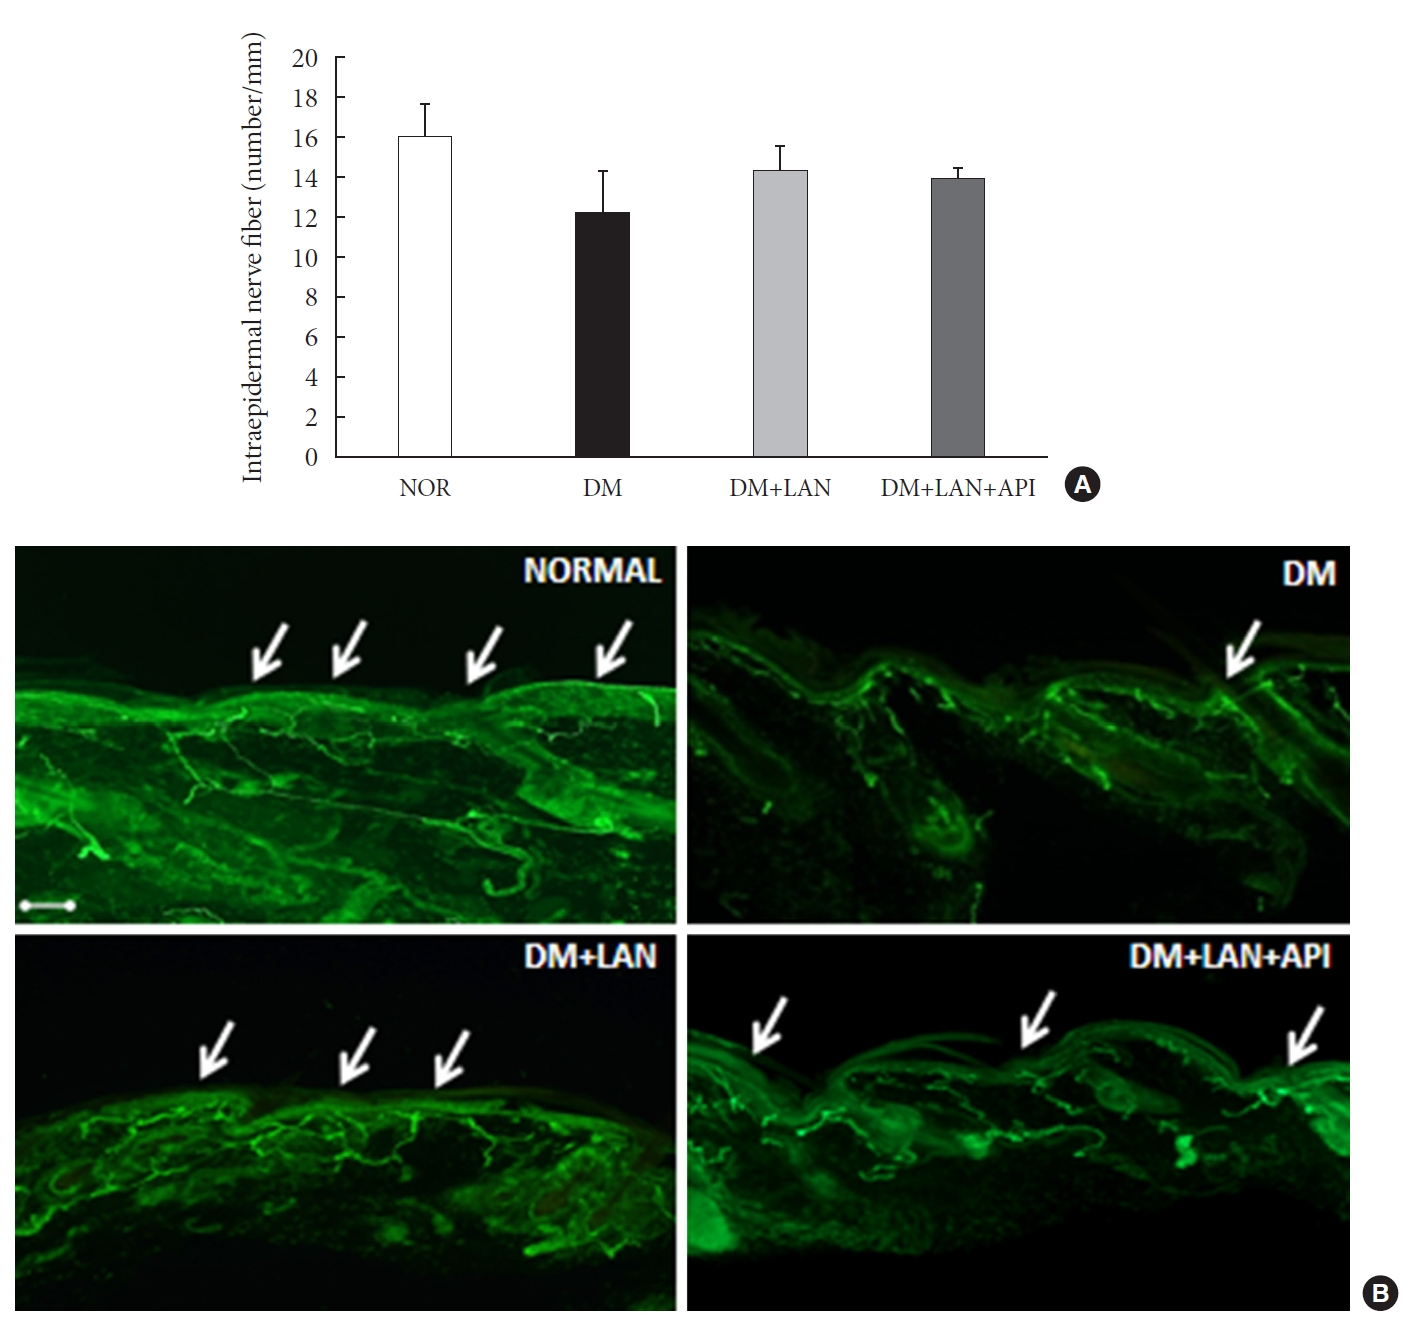
- At week 24, intraepidermal nerve fiber density was less reduced in the insulin-administered groups compared to the DM group (P<0.05); however, a significant difference was not observed between the DM+LAN and DM+LAN+API groups irrespective of glucose fluctuation (P>0.05; 16.2±1.6, 12.4±2.0, 14.3±0.9, and 13.9±0.6 for NOR, DM, DM+LAN, and DM+LAN+API, respectively). The DM group exhibited significantly decreased glutathione levels compared to the insulin-administered groups (2.64±0.10 μmol/mL, DM+LAN; 1.93±0.0 μmol/mL, DM+LAN+API vs. 1.25±0.04 μmol/mL, DM; P<0.05).
-
Conclusion
- Our study suggests that glucose control itself is more important than glucose fluctuation in the prevention of peripheral nerve damage, and intra-day glucose fluctuation has a limited effect on the progression of peripheral neuropathy in rats with diabetes.
- Diabetic peripheral neuropathy (DPN) is a common microvascular complication of diabetes, which leads to disability and decreases quality of life due to pain, sensory loss, gait disturbance, foot ulceration, and amputation [1]. The prevalence of diabetic neuropathy is reported to be 7% within 1 year of diagnosis to 50% for those who have had diabetes for more than 25 years [2].
- The pathogenesis of DPN is complicated and is associated with a number of modifiable and non-modifiable risk factors, including the degree of hyperglycemia, duration of diabetes, dyslipidemia, high blood pressure, cigarette smoking, alcohol consumption, and height of the patient [3]. Among these factors, chronic hyperglycemia and the duration of diabetes have been considered to be major risk factors for the development of DPN [4]. Hyperglycemia can cause direct damage to the nerve parenchyma as well as indirect hyperglycemia-induced neuronal ischemia by decreasing neuronal blood flow [4]. However, the exact pathophysiological mechanisms of DPN are not fully understood.
- Glycemic variability (GV) is defined as fluctuations in blood glucose levels [5]. The broad definition of GV considers the intraday glycemic excursions, including episodes of hyperglycemia and hypoglycemia, as well as blood glucose fluctuations that occur at the same time on different days [6]. In recent years, GV has been proposed to play an additional role in the development of diabetic neuropathy, independent of chronic hyperglycemia, by contributing to oxidative stress that leads to neural damage [7]. Most studies examining the effect of GV on diabetic neuropathy have focused on autonomic neuropathy [8,9]. Conversely, the association of GV with peripheral nerve dysfunction has not been explored systematically. Therefore, the aim of the present study was to demonstrate the effects of GV on peripheral nerve dysfunction, evaluated as the sensory and morphological parameters of peripheral nerve assessment and levels of oxidative stress markers, on inducing glucose fluctuations in streptozotocin (STZ)-induced diabetic rats with different insulin administration methods.
INTRODUCTION
- Animals
- Male Sprague-Dawley rats (6 weeks old, weighing approximately 160 to 180 g) were purchased from Orient Bio (Seongnam, Korea). Prior to the experiments, rats were allowed to adapt to their new environment for 1 week. During the study period, the rats were kept under standard conditions (24°C±2°C, 53%±2% humidity, and a 12-hour light/dark cycle) with free access to standardized diet and water. All experiments and protocols were in conformance with the regulations of the Institutional Rat Care and Use Committee, Jeonbuk National University Hospital (CUH-IACUC-141104-8).
- Materials
- To induce diabetes, a single intraperitoneal injection of 60 mg/kg STZ (Sigma Chemical, St. Louis, MO, USA) in citrate buffer (0.09 mol/L, pH 4.5) was administered to the rats. The control group received an equal volume of vehicle-sodium citrate buffer (pH 4.5). Blood samples were collected from the tail vein after overnight fasting and before insulin administration, around 8:00 AM, and blood glucose was measured using Accu-Chek Performa (Roche Diabetes Care, Mannheim, Germany). Rats whose blood glucose levels were above 350 mg/dL 1 week after STZ administration were considered diabetic.
- Experimental design
- Thirty-six rats were randomly assigned to four groups: rats with normal glucose levels that received sodium citrate buffer vehicle (normal glucose group [NOR], n=10); diabetic rats that did not receive treatment (diabetes mellitus [DM], n=8); diabetic rats who were administered subcutaneous injections of 15 to 20 IU/kg insulin glargine (Lantus®, Sanofi-Aventis, Paris, France), once daily at 4:00 PM (DM+LAN, n=9); and diabetic rats who were administered insulin glargine, as described before, and approximately 5 to 10 IU/kg insulin glulisine (Apidra®, Sanofi-Aventis) twice daily every 12 hours, at 8:00 AM and 8:00 PM (DM+LAN+API, n=9). The NOR and DM groups received an equal volume of saline solution at 8:00 AM, 4:00 PM, and 8:00 PM. The DM+LAN group also received saline injections at 8:00 AM and 8:00 PM.
- Administration of insulin started 1 month after STZ injections, and this time point was defined as week 0. Body weight was measured every 2 weeks. Evaluation of behavior, plasma anti-oxidant enzymes, and morphometric parameters of cutaneous and sciatic nerves was performed at week 24.
- Monitoring of glucose fluctuation
- The serum glucose levels were measured to assess the daily glucose and fluctuation pattern eight times on 1 day in week 24. Glycosylated hemoglobin (HbA1c) levels were measured with a commercially available kit (NycoCard, Oslo, Norway) every 3 months, using blood samples collected from the tail vein.
- GV was assessed by measuring the standard deviation (SD) and the coefficient of variance (CV; SD divided by mean×100%). The mean and SD of blood glucose levels were calculated according to the 8-point blood glucose measurements made on 1 day in week 24. For long-term GV, HbA1c variability was evaluated using the SD-HbA1c and CV of serial measurements of HbA1c every 3 months, including the HbA1c value obtained on the first day.
- Measurements of oxidative stress markers (superoxide dismutase, catalase, and glutathione) in blood
- At week 24, all rats were anesthetized via isoflurane inhalation. Isoflurane was delivered by a 0.4 to 0.6 liters per minute (LPM) O2 flow meter (SURGIVET®, Smiths Medical, Plymouth, MN, USA). Blood samples were drawn into tubes of 5 cc after euthanasia by cardiac puncture, and plasma was collected after centrifugation at 1,000 g for 10 minutes with 1 mM ethylenediaminetetraacetic acid (EDTA) at 4°C. Anti-oxidant enzymatic activity was measured using a commercial enzyme assay kit (Cayman Chemical Company, Ann Arbor, MI, USA), following the manufacturer’s protocol.
- Behavioral assessment using tactile, thermal, and pressure stimuli
- Tactile allodynia was measured at week 24 by applying flexible von Frey filaments (Stoelting, Wood Dale, IL, USA) of 4, 6, 8, 10, and 15 g, perpendicularly to the plantar surface of each hind paw in a series of ascending forces. Each filament was tested five times per paw, and the mechanical threshold was defined as the minimal force that caused at least two withdrawals in three consecutive trials [10].
- To assess thermal hyperalgesia threshold, the time of latency was defined as the time period between the zero point, when the animal was placed on a hot plate surface (Ugo Basile, Trappe, PA, USA) at 52°C±0.5°C, and the time when the animal licked its paw or jumped off to avoid thermal pain. The tail-flick test using an infrared radiometer (Jeungdo B&P, Seoul, Korea) was also performed to study heat sensitivity. The time of tail avoidance after contact with radiant heat was measured. A point 5 cm from the rat’s tail end was used to test the heat threshold.
- A Randall-Selitto analgesic meter (Ugo Basile, Comerio, Italy) was used to examine the mechanical threshold response according to increased pressure in the rat’s hind limb. The nociceptive threshold was defined as the force (g), upon which the rat pulled back its paw or made a sound.
- Morphometric assessment and quantitative comparison of peripheral nerves
- For immunohistochemical analysis of intraepidermal nerve fiber density (IENFD), 3×3 mm2 tissues were taken from the dorsum of the hind foot with skin biopsy at week 24 after euthanizing the rats. Sciatic nerves from all experimental rats were immediately dissected. Segments of the sciatic nerve were obtained, immersed in a fixative (in a solution of 2.5% paraformaldehyde and glutaraldehyde), and incubated overnight at 4°C. Subsequently, these specimens were embedded in paraffin and processed to resin blocks, before cutting sections of 1 µm and staining with toluidine blue. The procedures used for immunohistochemical analysis were the same as those described in previous studies [11].
- Skin tissue specimens were fixed with periodate-lysine-paraformaldehyde (2% paraformaldehyde, 0.075 M lysine, 0.05 M phosphate buffer pH 7.4, and 0.01 M sodium periodate) solution for 24 hours. After thoroughly rinsing in phosphatebuffered saline (PBS) containing 20% glycerol and 0.1 M phosphate buffer for 48 hours at 4°C, tissue specimens were covered in a cryoprotectant and Tissue-Tek (OCT compound, Miles, Elkhart, IN, USA). Sections of 40 μm thickness were cut perpendicular to the dermis with a sliding microtome (Leica CM 1510®, Leica Microsystems AG, Wetzlar, Germany) and washed twice in PBS for 10 minutes at room temperature. Samples were then sequentially processed with 0.25% potassium permanganate for 15 minutes, PBS for 2 minutes for washing, and 4.5% oxalic acid for 2 minutes. Samples were then transferred into microcentrifuge tubes containing Dako Protein Block Serum-Free® (Dako, Carpinteria, CA, USA) supplemented with 1% normal goat serum as a blocking buffer. After 30 minutes of blocking at room temperature, specimens were washed with PBS twice for 10 minutes and then incubated overnight with primary antibody at a 1:1,000 dilution, rabbit anti-protein-gene-product 9.5 (PGP 9.5) (Bio-Rad, Poole, UK) at 4°C. The antibodies were diluted in antibody diluent (Dako) supplemented with 1% goat serum. After complete washing, secondary antibody (goat anti-rabbit immunoglobulin G-fluorescein isothiocyanate [IgG-FITC] at a 1:200 dilution, Vector, Peterborough, UK) was loaded for 1 hour at room temperature in a dark room. Sections were then washed with PBS twice for 10 minutes, placed on slides, and mounted with fluorescent mounting media (Dako).
- Photomicrographs of the intraepidermal nerve fiber (IENF) were taken using a digital camera (Axiocam HRC®, Carl Zeiss, Goettingen, Germany) with magnifications of ×100 and ×400. PGP 9.5-immunoreactive nerve fibers in the epidermis of each section were counted [12,13]. Each nerve fiber with branching points inside the epidermis was counted as one fiber in the cutaneous nerves. IENFD, which is the number of IENFs per length (fibers/mm), was considered as the amount of innervation.
- For quantification of axon and myelin diameters, six pieces of sciatic nerve tissue were obtained and six sections from each sample were prepared. We took over 30 pictures from each sample and selected 15 pictures with good quality. Using ZEN simplified image analysis program, consisting of an Aiocam 506 camera, myelinated fibers or axonal area represented by the outer or inner border of the myelin sheath was measured in the sciatic nerve, and the mean diameter and area of myelinated fibers were subsequently determined. The average values were calculated and compared between the experimental groups. To avoid any possible bias, experiments were performed by two individual investigators without knowledge of the experimental groups.
- Statistical analysis
- The data were analyzed using one-way analysis of variance (ANOVA) with Duncan’s post hoc test to compare the experimental groups and expressed as mean±standard error of mean. Statistical significance was accepted at a P value <0.05, with a 95% confidence interval. Statistical analysis was performed using the SPSS version 18.0 software (SPSS Inc., Chicago, IL, USA).
METHODS
- Body weight of experimental animals
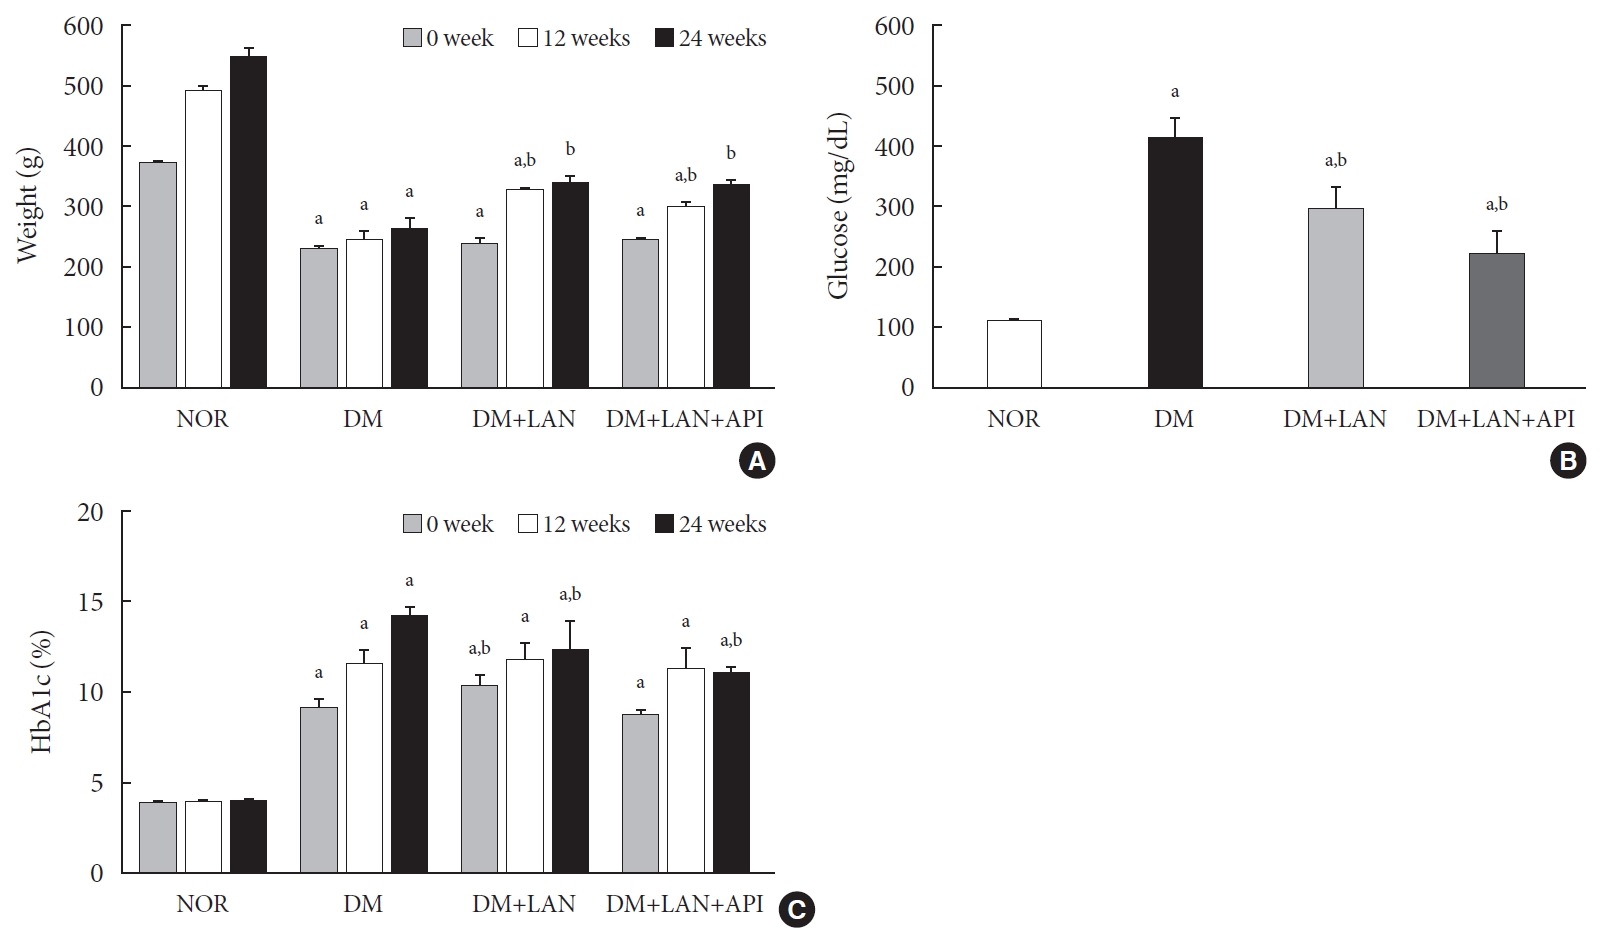
- The weight gain was not significant in the STZ-induced diabetic groups, whereas body weights in the normal group increased gradually from 373.0±7.1 g at week 0 to 551.3±13.1 g at week 24. The body weights of the normal group were significantly greater than those of the STZ-induced diabetic group at all experimental time points, irrespective of insulin administration (P<0.05). At weeks 12 and 24, the body weights of insulin-administered diabetic groups were significantly higher than of the DM group (P<0.05). However, body weight did not differ significantly between the DM+LAN and DM+LAN+API groups (Fig. 1A).
- Blood glucose levels and HbA1c of animals during experimental period
- After STZ injections, average blood glucose levels increased above 400 mg/dL in diabetic rats, while blood glucose levels in control rats did not significantly change throughout the study period. Mean blood glucose levels of the DM group on 1 day of week 24, were significantly greater than those of the normal and insulin-administered groups (P<0.05). There was no significant difference between the insulin-administered groups (Fig. 1B).
- HbA1c levels were measured three times at weeks 0, 12, and 24. Significant differences of mean HbA1c levels between the normal and STZ-induced diabetic groups were observed (P<0.05). HbA1c levels at week 24 were significantly lower in the insulin-administered groups than in the DM group (12.4%±0.5% DM+LAN; 11.1%±0.1%, DM+LAN+API vs. 14.3%±0.2%, DM; P<0.05). However, there was no significant difference between the insulin-administered groups (Fig. 1C).
- Comparison of glucose fluctuation among experimental groups
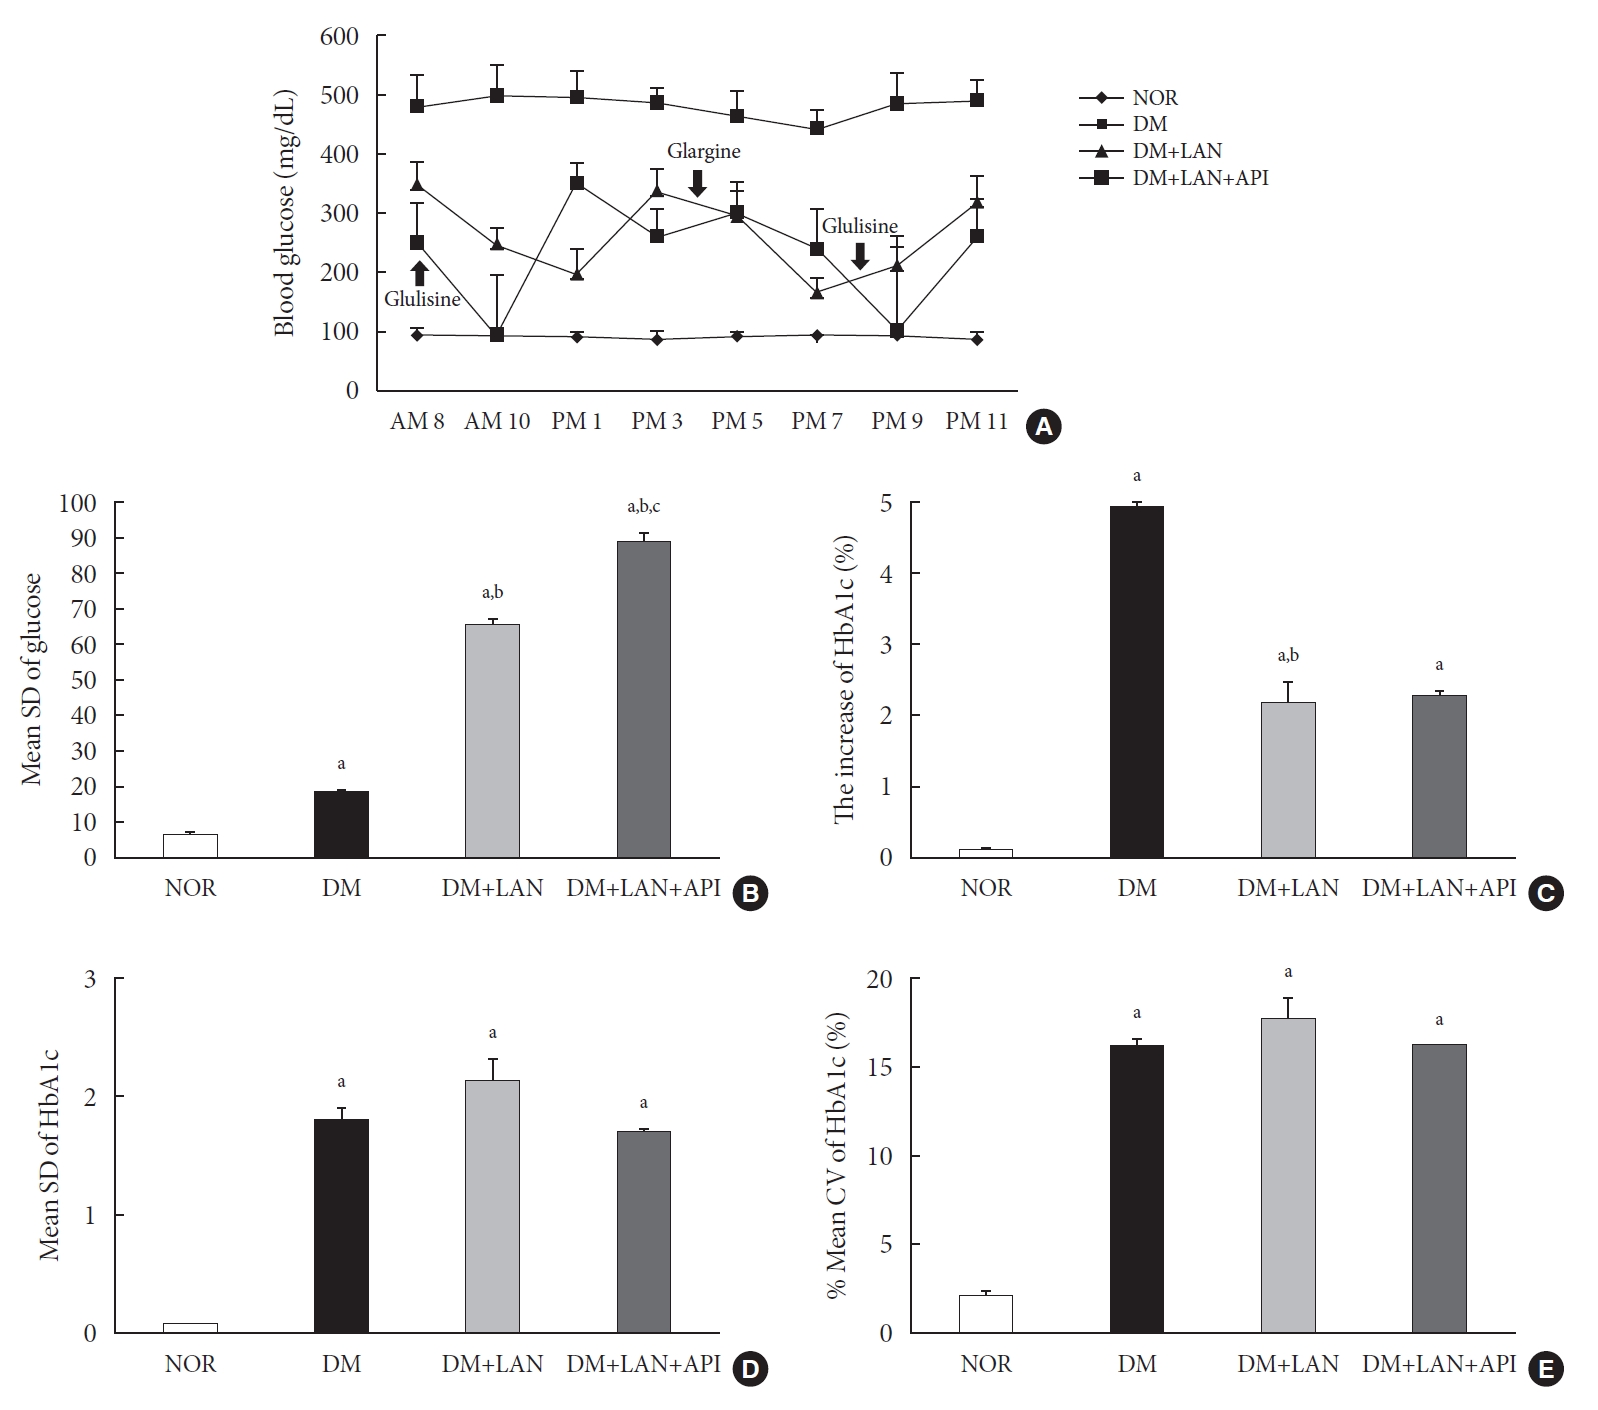
- On the first day of 24 weeks, 8-point glucose monitoring showed an abrupt drop in the glucose levels after glulisine injection in the DM+LAN+API group as compared to those in the other DM groups (Fig. 2A). Intraday GV, as estimated by the mean SD of blood glucose measured on 1 day, was significantly higher in the DM+LAN+API group than in other groups (P<0.05) (Fig. 2B). All parameters of HbA1c variability were significantly higher in the STZ-induced diabetic groups than in the normal group (P<0.05) (Fig. 2C-E). There was a significant difference in the absolute change in HbA1c between the DM group and insulin-administered groups (P<0.05), with no significant difference between the DM+LAN and DM+LAN+API groups. The degree of SD and CV% in HbA1c level of the DM+LAN group was not different significantly than in the DM and DM+LAN+API groups (Fig. 2D and E), although intraday glucose levels fluctuated the most in the DM+LAN+API group.
- The level of oxidative stress markers in blood of experimental animals
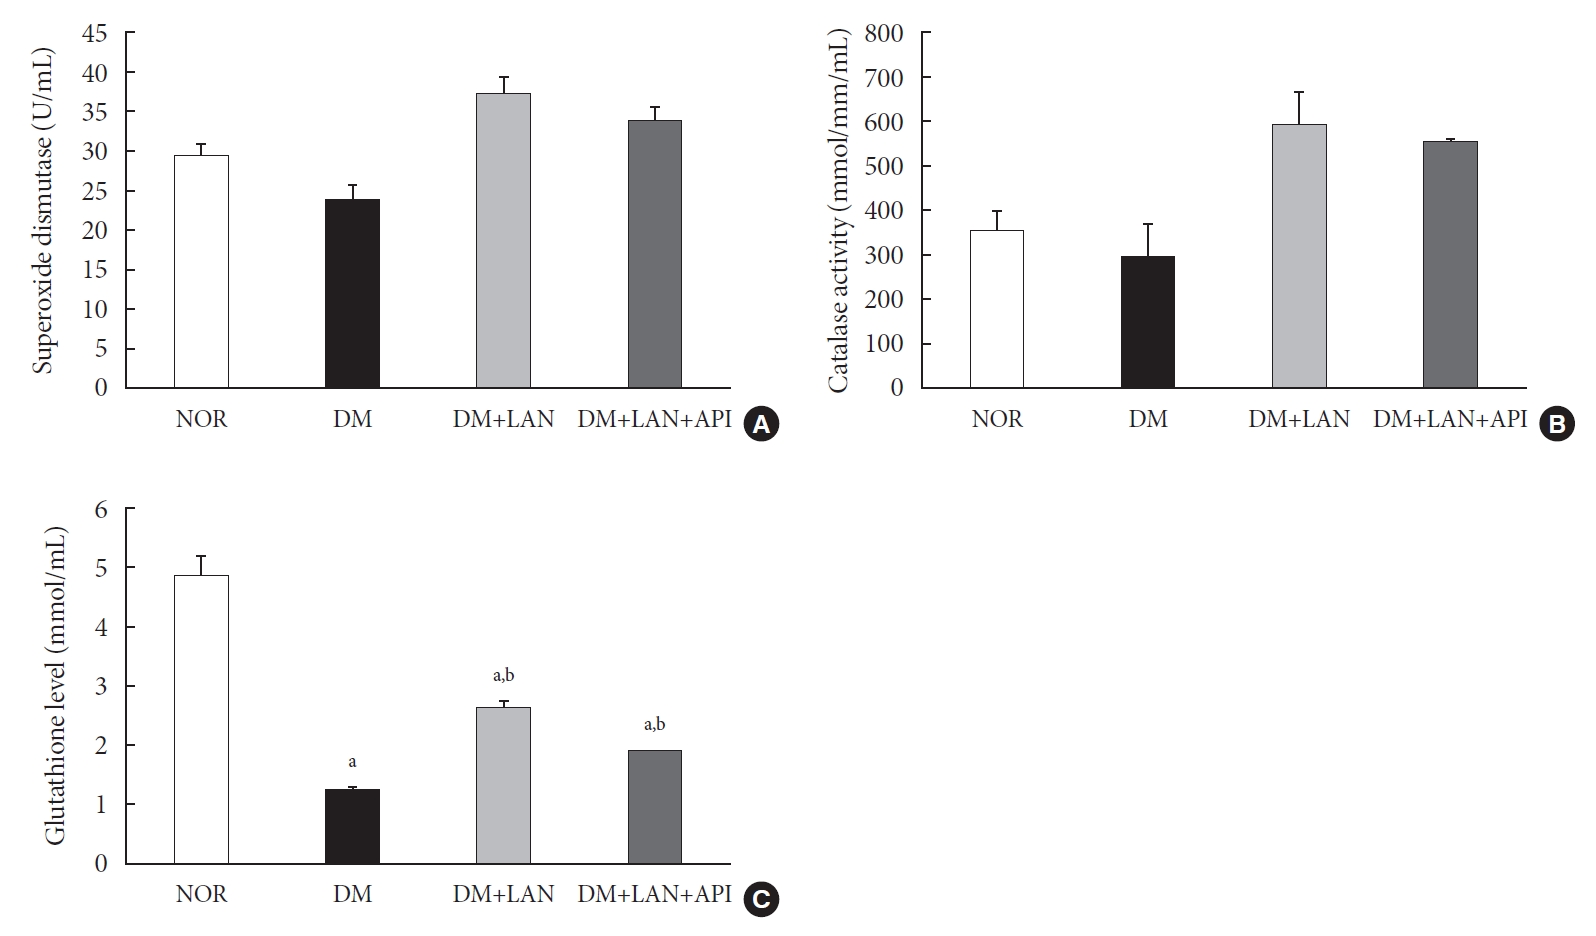
- At week 24, the absolute values of superoxide dismutase (SOD) and catalase activities in the DM group were lower than those in the normal and insulin-administered groups. However, these differences were not statistically significant. Glutathione levels were significantly lower in the STZ-induced diabetic groups than in the normal group (P<0.05). In addition, compared to the insulin-administered groups, the DM group exhibited significantly decreased glutathione levels (2.64±0.10 µmol/mL, DM+LAN; 1.93±0.0 µmol/mL, DM+LAN+API vs. 1.25±0.04 µmol/mL, DM; P<0.05). However, no significant difference was observed between the DM+LAN and DM+LAN+API groups (Fig. 3).
- The comparison of behavioral responses with tactile, thermal, and pressure stimuli
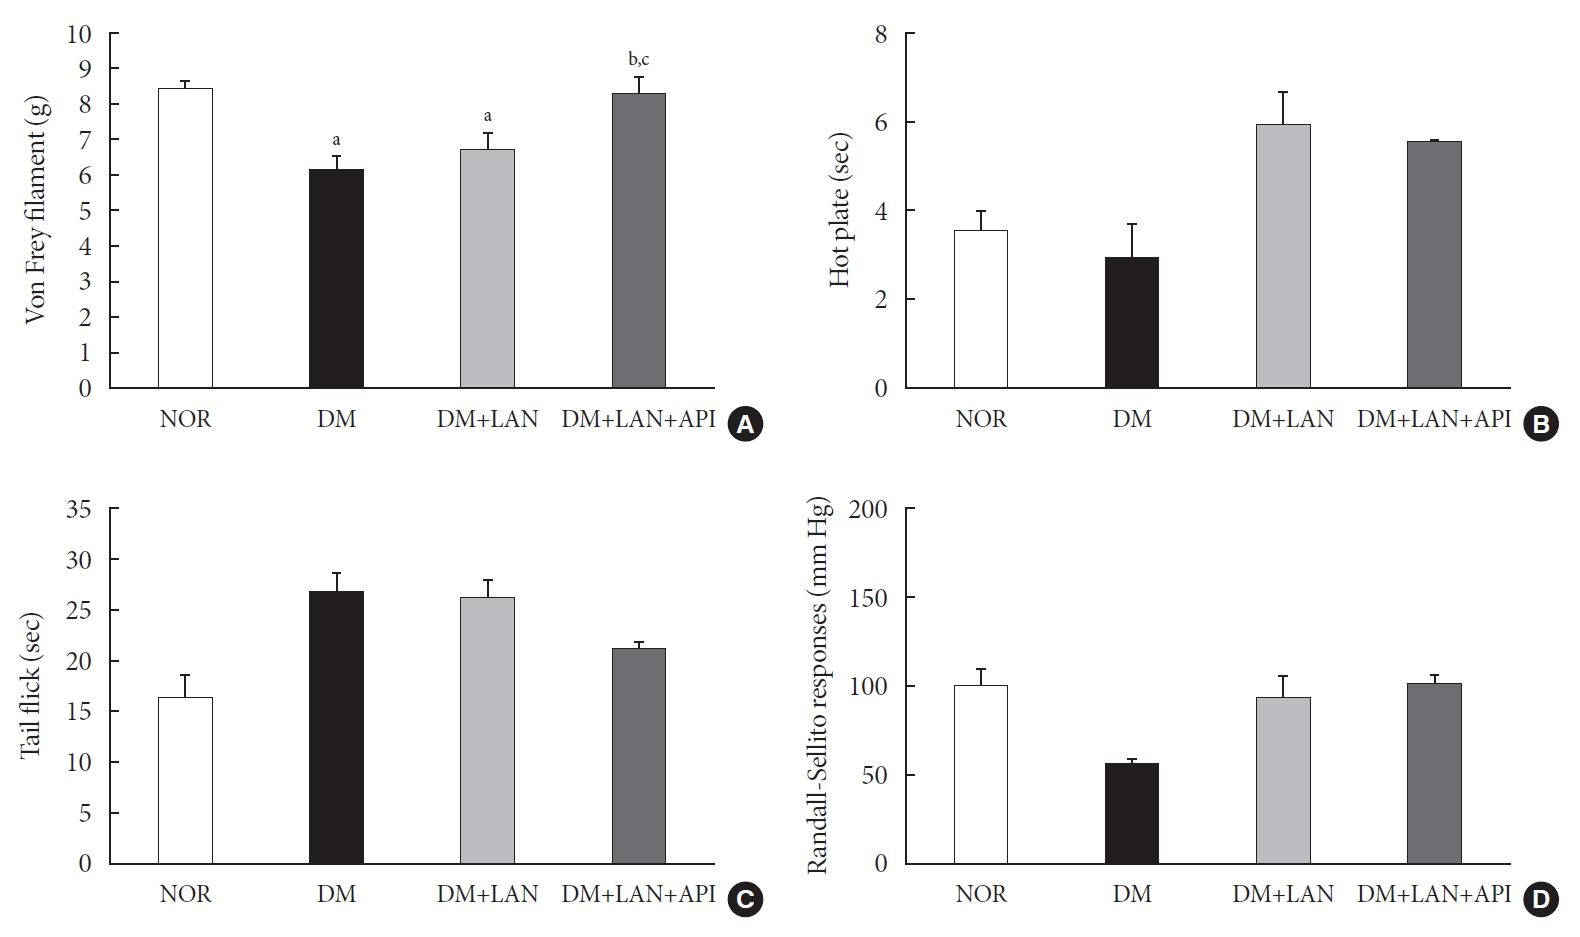
- At week 24, the paw withdrawal threshold was reduced by 28% in the DM group and by 21% in the DM+LAN group, compared to the normal group. The reduced thresholds in both the DM and DM+LAN groups were significantly lower than those in the normal and DM+LAN+API groups (P<0.05). These thresholds were similar between the normal and DM+LAN+API groups (Fig. 4A).
- The time for paw withdrawal on the hot plate was reduced by 15% in the DM group, 21% in the DM+LAN group, and 17% in the DM+LAN+API group, compared with the normal group (Fig. 4B). The tail flick response latency on the hot plate tended to increase in the STZ-induced diabetic groups compared with the normal group, irrespective of insulin administration. The mean response latency was lower in the DM+LAN+API group than in the DM and DM+LAN groups (21.4±0.5 seconds, DM+LAN+API vs. 26.8±1.9 seconds, DM and 26.3±1.5 seconds, DM+LAN) (Fig. 4C). The response threshold to pressure stimuli in the Randall-Sellito test was reduced by 44% in the DM group compared to the normal group. The threshold in the DM group was lower than that in the DM+LAN and DM+LAN+API groups (Fig. 4D).
- However, there were no significant differences in the responses to thermal and pressure stimuli between the DM+LAN and DM+LAN+API groups.
- Morphometric and quantitative comparison of the cutaneous and sciatic nerves
- Quantitative comparison of the cutaneous peripheral nerves revealed that the mean IENFD was lower in the DM group than in the normal group and the insulin-administered groups at week 24 (16.2±1.6 mm, normal; 12.4±2.0, DM; 14.3±0.9, DM+LAN; 13.9±0.6, DM+LAN+API). However, the differences in the IENFD among the normal and STZ-induced diabetic groups were not statistically significant (Fig. 5A). Fig. 5B shows the morphological finding of PGP 9.5-positive small nerve fibers extending into the epidermis in each group, in which relatively shortened and reduced nerve fibers were observed in the STZ-induced diabetic groups compared to the normal group. The diameters of the myelin sheath and the axonal fibers of sciatic nerves in the STZ-induced diabetic groups had reduced as compared to those in the normal group, irrespective of insulin administration (P<0.05) (Fig. 6A and B). However, the diameters were not significantly different in the DM+LAN and DM+LAN+API groups. The morphological findings of the sciatic nerves according to the different insulin administration methods are shown in Fig. 6C.
RESULTS
- In the present study, we induced glucose fluctuation to investigate how GV contributes to the progression of peripheral nerve damage in diabetes. We observed that the GV in the DM+LAN+API group was different from that in the DM and DM+LAN groups. Mean glucose values and HbA1c levels were significantly lower in the insulin-administered groups than in the DM group at week 24. However, these levels were not significantly different in the DM+LAN and DM+LAN+API groups during the experimental period. Although the DM+LAN+API group was exposed to severe intraday glucose fluctuation more frequently than the DM+LAN group, GV indices for HbA1c were not significantly different between the two groups. Therefore, this study suggests that the glucose control state itself is more important than GV, such as glucose fluctuation in peripheral nerve protection in diabetes.
- The basic pathogenic mechanism of DPN is complicated and may involve several factors. Long-term hyperglycemia leads to polyol pathway hyperactivity, advanced glycation end-product/receptor for advanced glycation end-product reactions, and increased reactive oxygen species that activate multiple deleterious pathways within nerves [3]. Recent laboratory and animal studies have shown that acute fluctuation or a wide range of glucose levels may worsen hyperglycemia-induced oxidative stress [14,15]. Similarly, two human studies among patients with type 2 diabetes mellitus (T2DM) revealed that oscillating glucose levels resulted in further deterioration of endothelial dysfunction and higher levels of oxidative stress markers compared with sustained hyperglycemia in T2DM [16,17].
- Clinical studies have reported that GV may play a role in the development of diabetic microvascular and macrovascular complications [18-21]. A recent study using a continuous glucose monitoring system showed a significant fluctuation in blood glucose values in children with type 1 diabetes mellitus (T1DM), as well as in those with excellent HbA1c values. This suggests that in addition to HbA1c, glucose variability may have predictive value for the development of diabetic complications [22,23]. However, human studies have not consistently shown that GV is harmful. Bragd et al. [18] confirmed the lack of a relationship between short-term GV measured as SD and microvascular complications in patients with T1DM. However, they found that GV was significantly related to the presence of peripheral neuropathy, and was a borderline predictor of its incidence [18]. Even in light of the above considerations, the concept of GV is a complex phenomenon and it is suggested that GV may partially contribute to the development of diabetic complications.
- Studies have suggested different methods to assess GV [24-26] and there is no clear consensus in clinical research on the gold standard for measuring GV. Among the most commonly used methods is SD, an index of the dispersion of data around mean blood glucose [24]. The SD of HbA1c can be used to assess long term GV. Several previous studies have shown that HbA1c variability is associated with microvascular complications in diabetes. It is known that annual fasting plasma glucose and HbA1c variability are strongly associated with diabetic nephropathy in T2DM [25]. In another study, it was shown that variability in HbA1c added to the mean value in predicting retinopathy and nephropathy in T1DM [26]. Based on these studies, we assessed mean glucose values with SD and 8-point glucose monitoring as the intraday GV index and SD and %CV of HbA1c as the long-term GV index in this study.
- The impact of GV on DPN and its exact pathogenesis have not been fully elucidated. GV has been suggested as an additional risk factor for the worsening of DPN [27,28]. However, most studies assessing the impact of GV on DPN have focused on autonomic neuropathy, especially cardiac autonomic neuropathy (CAN), rather than somatic neuropathy [9,29]. A recent study reported that GV was independently associated with the presence of CAN in patients with T2DM, and HbA1c variability was also independently associated with the severity of CAN [9]. In our study, the results of a diverse set of sensory tests were inconsistent. Only the von Frey filament test showed a significantly decreasing threshold in the DM+LAN group compared with the threshold in the DM+LAN+API group. Interestingly, there was no significant difference in IENFD between the insulin-administered groups, although a significant reduction in allodynia was observed in the DM+LAN group compared to the DM+LAN+API group. In general, functional changes related to sensory processing precede structural changes in small fiber diabetic neuropathy [30]. Therefore, our findings support the observation that the ability of pathologic findings to explain functional changes in all peripheral nerves and sensory manifestations is limited. The findings related to anti-oxidant enzymes in blood were also inconsistent. The levels of the anti-oxidant glutathione in the blood were reduced in the STZ-induced diabetic groups compared to the normal group. There was a significant reduction of the anti-oxidant glutathione in the DM group compared with the insulin-administered groups, but there was no significant difference according to the induction of glucose fluctuation. SOD and catalase activities were not significantly different among the experimental groups. In fact, the observed difference in the levels of glutathione in the blood may not directly reflect the levels in peripheral nerve tissue. For this reason, assessment of oxidative stress and antioxidant levels in peripheral nerve tissue is necessary to establish pathological differences.
- In this study, most of the tests used to quantify the amount of peripheral nerve fiber damage did not show significantly different results between insulin administered groups. This could be due to the fact that the induced GV in our study was not enough to cause peripheral nerve fiber damage. Another possible explanation could be that the experimental period was insufficient for inducing GV-associated nerve damage. Furthermore, GV may have relatively smaller effects on peripheral nerves than chronic hyperglycemia. The duration and absolute value of GV involved in the initiation and progression of DPN remains an open question. Finally, it is possible that insulin itself may have affected the peripheral nerves. There is controversy regarding the relationship between insulin therapy and the presence of DPN. Katulanda et al. [31] demonstrated that insulin treatment is a strongly associated risk factor of DPN. A possible explanation for this association could be that insulin use indicates beta cell failure and may reflect a later stage of diabetes or greater severity [31]. However, randomized clinical trials have shown that intensive insulin therapy can prevent or delay the development of DPN compared with conventional insulin therapy [32]. Further studies will be necessary to clarify whether insulin administration is beneficial for peripheral nerves.
- This study has a few limitations. First, we did not assess intra-day GV more accurately by repeating the 8-point glucose measurement during the 24 weeks. Although glucose fluctuation was induced in our study, more accurate glucose fluctuations may be required to show that GV alone can influence peripheral neuropathy in diabetes. Second, insulin can also affect the natural course of peripheral nerve damage in diabetes. Therefore, GV induction by different methods, without insulin treatment, may be helpful to exclude the effect of insulin on DPN. Third, serial comparisons of the IENFD and behavioral tests at 0, 12, and 24 weeks with oxidative stress assays might be more helpful to support our suggestion. Fourth, the variable state of hyperglycemia according to insulin treatment may affect the variability of behavioral measurement, although insulin was not administered on the day of the sensory tests. Further investigation on the presence of retinopathy or nephropathy will be helpful to clarify the impact of glucose fluctuation on the microvascular complications in diabetes. Despite these limitations, this study is the first to compare the functional and morphological changes of peripheral nerves occurring due to glucose fluctuations in diabetes.
- In conclusion, the results of our experiment suggest that glucose fluctuation induced by insulin administration is relatively less harmful by itself, and the glucose control state is more important than GV in the progression of peripheral nerve damage in diabetes.
DISCUSSION
-
CONFLICTS OF INTEREST
No potential conflict of interest relevant to this article was reported.
-
AUTHOR CONTRIBUTIONS
Conception or design: T.S.P., H.Y.J.
Acquisition, analysis, or interpretation of data: Y.J.K., N.Y.L., K.A.L., H.Y.J.
Drafting the work or revising: Y.J.K., H.Y.J.
Final approval of the manuscript: Y.J.K., H.Y.J
-
FUNDING
None
NOTES
-
Acknowledgements
- The authors would like to thank the Research Institute of Clinical Medicine of Jeonbuk National University–Biomedical Research Institute of Jeonbuk National University Hospital for supporting this study in part through access to experimental facilities.


- 1. Young MJ, Boulton AJ, MacLeod AF, Williams DR, Sonksen PH. A multicentre study of the prevalence of diabetic peripheral neuropathy in the United Kingdom hospital clinic population. Diabetologia 1993;36:150-4.ArticlePubMedPDF
- 2. Pirart J. Diabetes mellitus and its degenerative complications: a prospective study of 4,400 patients observed between 1947 and 1973 (3rd and last part). Diabete Metab 1977;3:245-56.PubMed
- 3. Yagihashi S, Mizukami H, Sugimoto K. Mechanism of diabetic neuropathy: where are we now and where to go? J Diabetes Investig 2011;2:18-32.ArticlePubMed
- 4. Sabanayagam C, Liew G, Tai ES, Shankar A, Lim SC, Subramaniam T, et al. Relationship between glycated haemoglobin and microvascular complications: is there a natural cut-off point for the diagnosis of diabetes? Diabetologia 2009;52:1279-89.ArticlePubMedPDF
- 5. Suh S, Kim JH. Glycemic variability: how do we measure it and why is it important? Diabetes Metab J 2015;39:273-82.ArticlePubMedPMC
- 6. Satya Krishna SV, Kota SK, Modi KD. Glycemic variability: clinical implications. Indian J Endocrinol Metab 2013;17:611-9.ArticlePubMedPMC
- 7. Sartore G, Chilelli NC, Burlina S, Di Stefano P, Piarulli F, Fedele D, et al. The importance of HbA1c and glucose variability in patients with type 1 and type 2 diabetes: outcome of continuous glucose monitoring (CGM). Acta Diabetol 2012;49 Suppl 1:S153-60.ArticlePubMedPDF
- 8. Kalopita S, Liatis S, Thomakos P, Vlahodimitris I, Stathi C, Katsilambros N, et al. Relationship between autonomic nervous system function and continuous interstitial glucose measurement in patients with type 2 diabetes. J Diabetes Res 2014;2014:835392.ArticlePubMedPMCPDF
- 9. Jun JE, Jin SM, Baek J, Oh S, Hur KY, Lee MS, et al. The association between glycemic variability and diabetic cardiovascular autonomic neuropathy in patients with type 2 diabetes. Cardiovasc Diabetol 2015;14:70.ArticlePubMedPMCPDF
- 10. Yalcin I, Charlet A, Freund-Mercier MJ, Barrot M, Poisbeau P. Differentiating thermal allodynia and hyperalgesia using dynamic hot and cold plate in rodents. J Pain 2009;10:767-73.ArticlePubMed
- 11. Jin HY, Kang SM, Liu WJ, Song CH, Lee KA, Baek HS, et al. Comparison of peripheral nerve damages according to glucose control timing in experimental diabetes. Exp Clin Endocrinol Diabetes 2012;120:451-9.ArticlePubMed
- 12. Lauria G, Hsieh ST, Johansson O, Kennedy WR, Leger JM, Mellgren SI, et al. Report of a joint task force of the European Federation of Neurological Societies and the Peripheral Nerve Society. Eur J Neurol 2010;17:903-12.PubMed
- 13. Lauria G, Cornblath DR, Johansson O, McArthur JC, Mellgren SI, Nolano M, et al. EFNS guidelines on the use of skin biopsy in the diagnosis of peripheral neuropathy. Eur J Neurol 2005;12:747-58.ArticlePubMed
- 14. Quagliaro L, Piconi L, Assaloni R, Martinelli L, Motz E, Ceriello A. Intermittent high glucose enhances apoptosis related to oxidative stress in human umbilical vein endothelial cells: the role of protein kinase C and NAD(P)H-oxidase activation. Diabetes 2003;52:2795-804.PubMed
- 15. Kim MJ, Jung HS, Hwang-Bo Y, Cho SW, Jang HC, Kim SY, et al. Evaluation of 1,5-anhydroglucitol as a marker for glycemic variability in patients with type 2 diabetes mellitus. Acta Diabetol 2013;50:505-10.ArticlePubMedPDF
- 16. Monnier L, Mas E, Ginet C, Michel F, Villon L, Cristol JP, et al. Activation of oxidative stress by acute glucose fluctuations compared with sustained chronic hyperglycemia in patients with type 2 diabetes. JAMA 2006;295:1681-7.ArticlePubMed
- 17. Ceriello A, Esposito K, Piconi L, Ihnat MA, Thorpe JE, Testa R, et al. Oscillating glucose is more deleterious to endothelial function and oxidative stress than mean glucose in normal and type 2 diabetic patients. Diabetes 2008;57:1349-54.ArticlePubMedPDF
- 18. Bragd J, Adamson U, Backlund LB, Lins PE, Moberg E, Oskarsson P. Can glycaemic variability, as calculated from blood glucose self-monitoring, predict the development of complications in type 1 diabetes over a decade? Diabetes Metab 2008;34(6 Pt 1):612-6.ArticlePubMed
- 19. Gimeno-Orna JA, Castro-Alonso FJ, Boned-Juliani B, Lou-Arnal LM. Fasting plasma glucose variability as a risk factor of retinopathy in type 2 diabetic patients. J Diabetes Complications 2003;17:78-81.ArticlePubMed
- 20. Su G, Mi SH, Tao H, Li Z, Yang HX, Zheng H, et al. Impact of admission glycemic variability, glucose, and glycosylated hemoglobin on major adverse cardiac events after acute myocardial infarction. Diabetes Care 2013;36:1026-32.ArticlePubMedPMCPDF
- 21. Wang X, Zhao X, Dorje T, Yan H, Qian J, Ge J. Glycemic variability predicts cardiovascular complications in acute myocardial infarction patients with type 2 diabetes mellitus. Int J Cardiol 2014;172:498-500.ArticlePubMed
- 22. Salardi S, Zucchini S, Santoni R, Ragni L, Gualandi S, Cicognani A, et al. The glucose area under the profiles obtained with continuous glucose monitoring system relationships with HbA(lc) in pediatric type 1 diabetic patients. Diabetes Care 2002;25:1840-4.ArticlePubMedPDF
- 23. Oyibo SO, Prasad YD, Jackson NJ, Jude EB, Boulton AJ. The relationship between blood glucose excursions and painful diabetic peripheral neuropathy: a pilot study. Diabet Med 2002;19:870-3.ArticlePubMed
- 24. Frontoni S, Di Bartolo P, Avogaro A, Bosi E, Paolisso G, Ceriello A. Glucose variability: an emerging target for the treatment of diabetes mellitus. Diabetes Res Clin Pract 2013;102:86-95.ArticlePubMed
- 25. Lin CC, Chen CC, Chen FN, Li CI, Liu CS, Lin WY, et al. Risks of diabetic nephropathy with variation in hemoglobin A1c and fasting plasma glucose. Am J Med 2013;126:1017.Article
- 26. Kilpatrick ES, Rigby AS, Atkin SL. A1C variability and the risk of microvascular complications in type 1 diabetes: data from the Diabetes Control and Complications Trial. Diabetes Care 2008;31:2198-202.PubMedPMC
- 27. Jin HY, Lee KA, Park TS. The impact of glycemic variability on diabetic peripheral neuropathy. Endocrine 2016;53:643-8.ArticlePubMedPDF
- 28. Xu F, Zhao LH, Su JB, Chen T, Wang XQ, Chen JF, et al. The relationship between glycemic variability and diabetic peripheral neuropathy in type 2 diabetes with well-controlled HbA1c. Diabetol Metab Syndr 2014;6:139.ArticlePubMedPMCPDF
- 29. Fleischer J. Diabetic autonomic imbalance and glycemic variability. J Diabetes Sci Technol 2012;6:1207-15.ArticlePubMedPMCPDF
- 30. Beiswenger KK, Calcutt NA, Mizisin AP. Epidermal nerve fiber quantification in the assessment of diabetic neuropathy. Acta Histochem 2008;110:351-62.ArticlePubMedPMC
- 31. Katulanda P, Ranasinghe P, Jayawardena R, Constantine GR, Sheriff MH, Matthews DR. The prevalence, patterns and predictors of diabetic peripheral neuropathy in a developing country. Diabetol Metab Syndr 2012;4:21.ArticlePubMedPMCPDF
- 32. The Diabetes Control and Complications Trial Research Group. The effect of intensive diabetes therapy on measures of autonomic nervous system function in the Diabetes Control and Complications Trial (DCCT). Diabetologia 1998;41:416-23.ArticlePubMedPMCPDF
REFERENCES
Figure & Data
References
Citations
- Glucose Fluctuation Inhibits Nrf2 Signaling Pathway in Hippocampal Tissues and Exacerbates Cognitive Impairment in Streptozotocin-Induced Diabetic Rats
Haiyan Chi, Yujing Sun, Peng Lin, Junyu Zhou, Jinbiao Zhang, Yachao Yang, Yun Qiao, Deshan Liu, Eusebio Chiefari
Journal of Diabetes Research.2024; 2024: 1. CrossRef - Artesunate Inhibits Apoptosis and Promotes Survival in Schwann Cells via the PI3K/AKT/mTOR Axis in Diabetic Peripheral Neuropathy
Xin Zhang, Zhifang Liang, Ying Zhou, Fang Wang, Shan Wei, Bing Tan, Yujie Guo
Biological and Pharmaceutical Bulletin.2023; 46(6): 764. CrossRef - The Potential of Glucose Treatment to Reduce Reactive Oxygen Species Production and Apoptosis of Inflamed Neural Cells In Vitro
Juin-Hong Cherng, Shu-Jen Chang, Hsin-Da Tsai, Chung-Fang Chun, Gang-Yi Fan, Kenneth Dean Reeves, King Hei Stanley Lam, Yung-Tsan Wu
Biomedicines.2023; 11(7): 1837. CrossRef - Relationship between acute glucose variability and cognitive decline in type 2 diabetes: A systematic review and meta-analysis
Haiyan Chi, Min Song, Jinbiao Zhang, Junyu Zhou, Deshan Liu, Victor Manuel Mendoza-Nuñez
PLOS ONE.2023; 18(9): e0289782. CrossRef
 PubReader
 ePub Link
 Cite
Cite