Trends and Risk Factors of Metabolic Syndrome among Korean Adolescents, 2007 to 2018
Article information

Abstract
Background
There is a lack of recent research on the changes in risk factors for metabolic syndrome (MetS) in the Asian pediatric population. We aimed to determine the 12-year trends in the prevalence of MetS and relevant lifestyle factors such as smoking, exercise, and calorie intake among Korean adolescents.
Methods
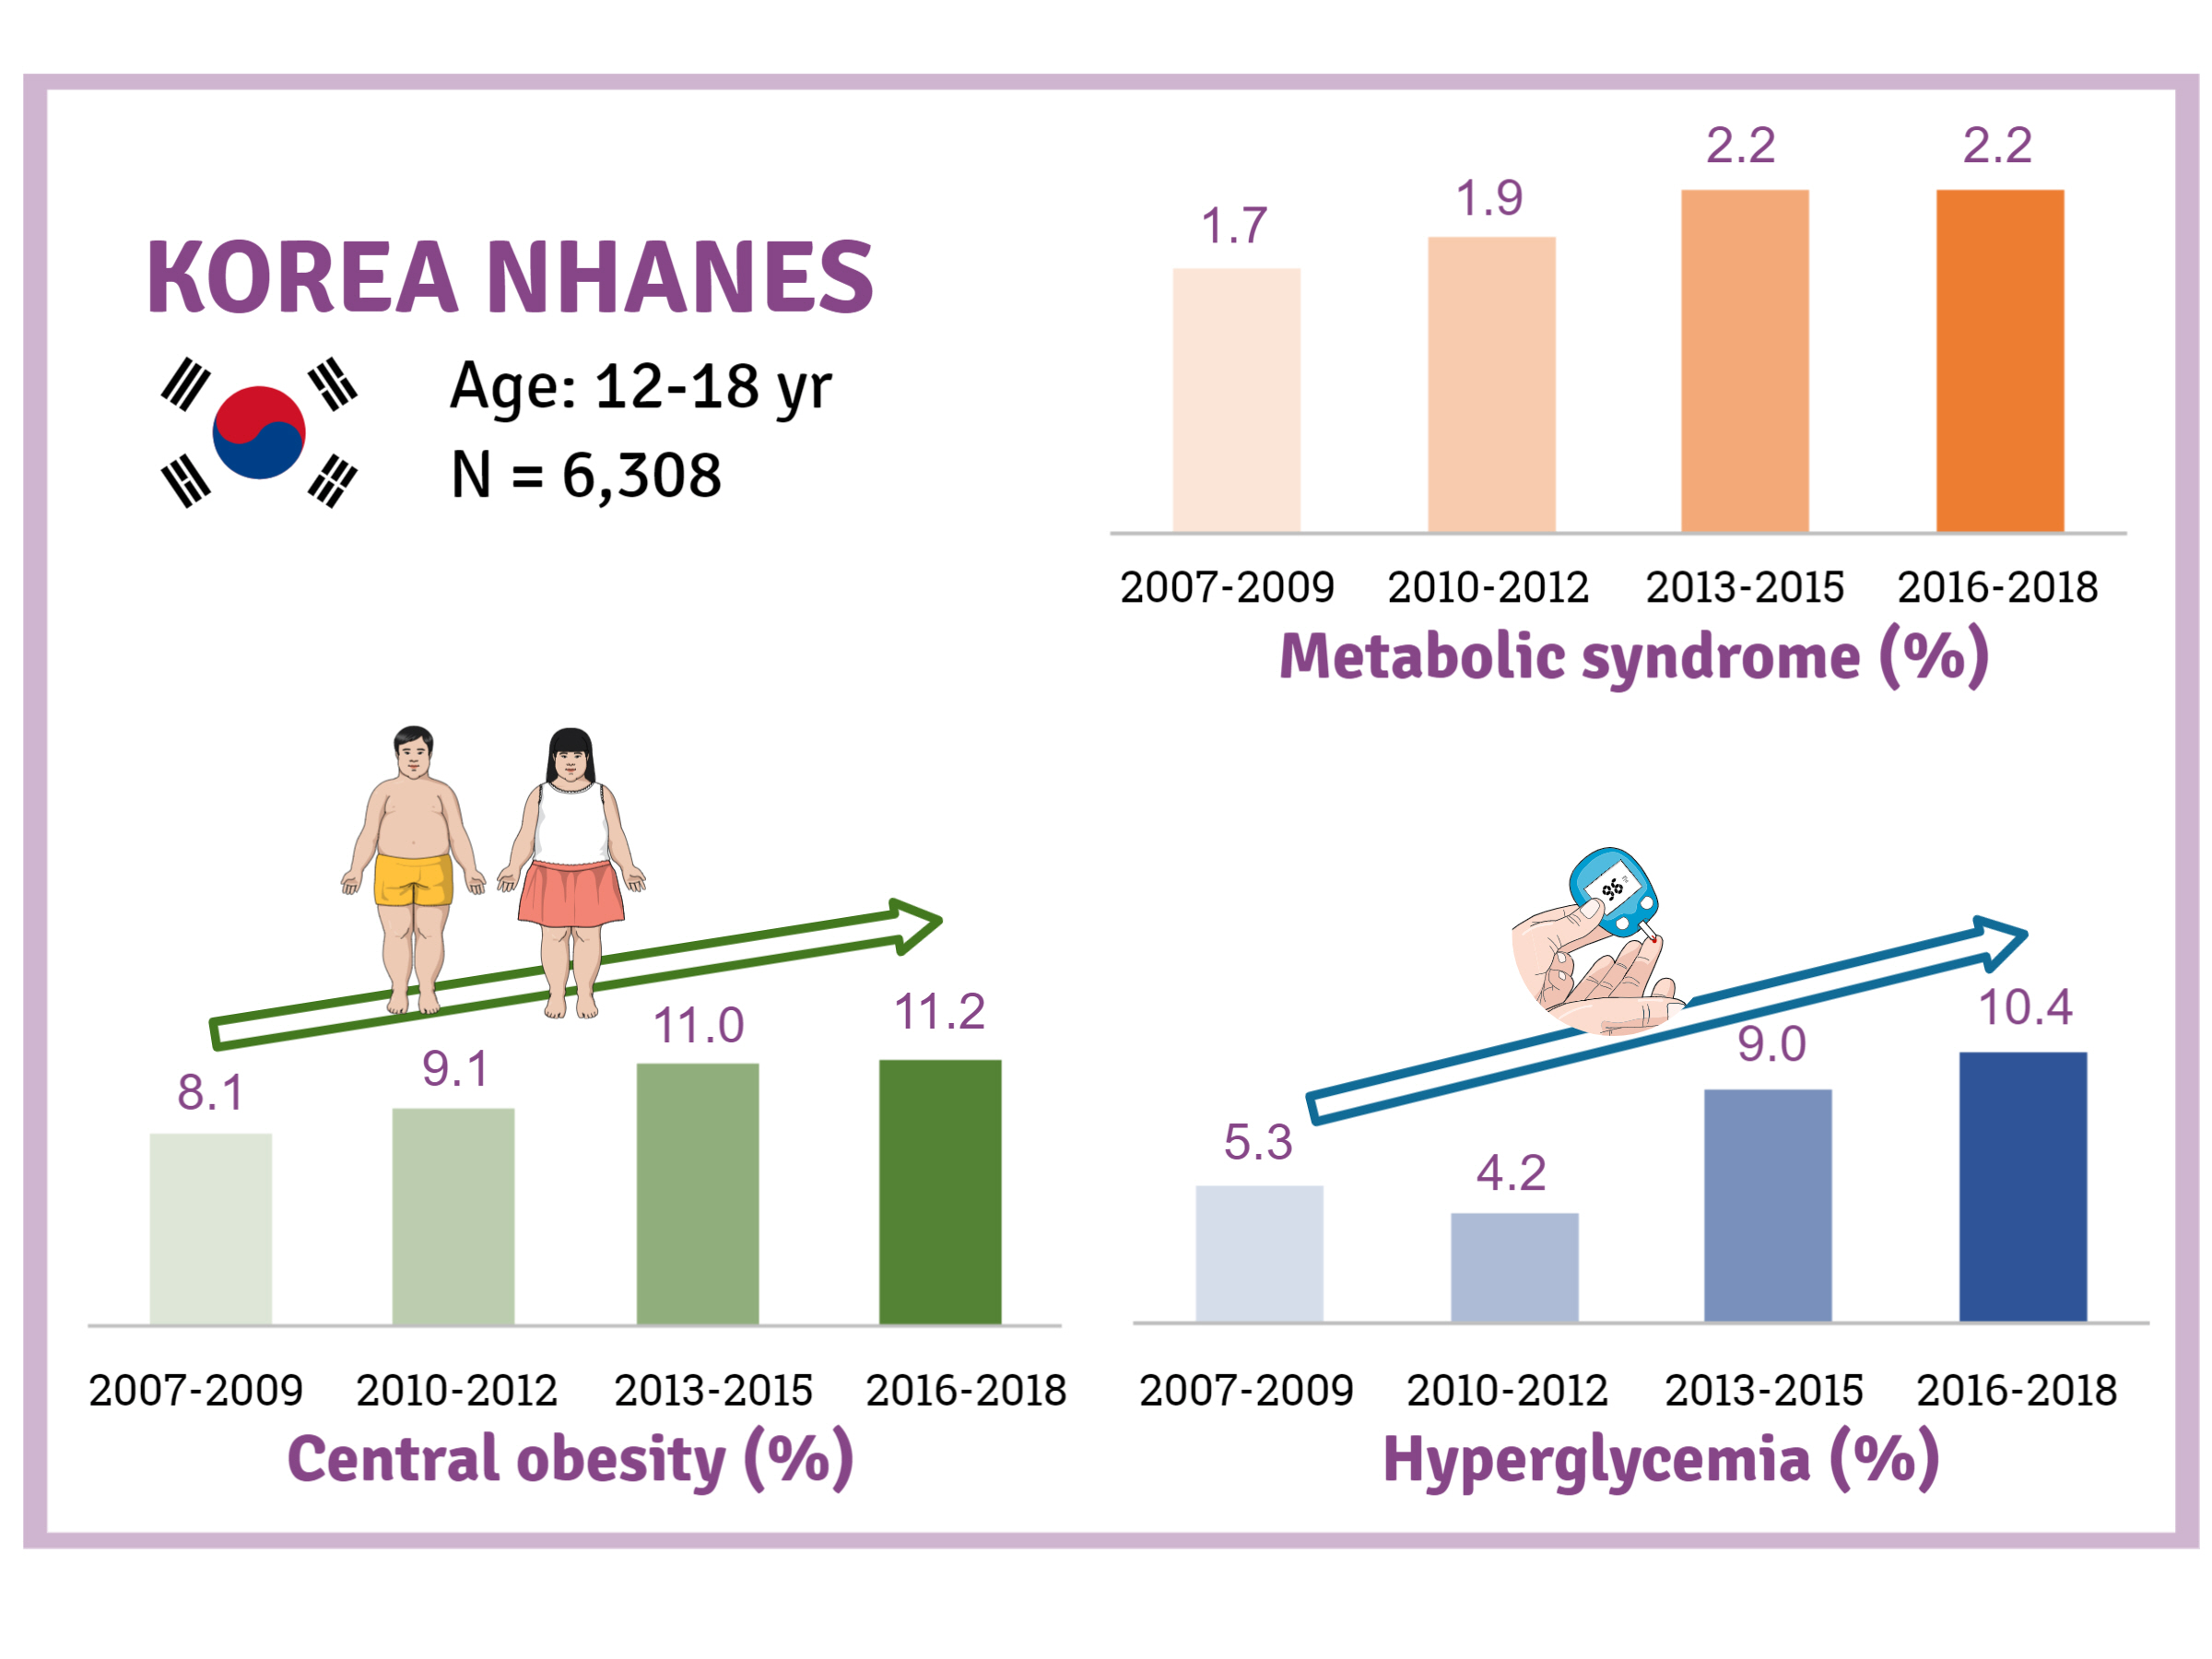
We investigated trends in MetS and lifestyle factors among 6,308 adolescents aged 12 to 18 years from the Korea National Health and Nutrition Examination Survey, 2007 to 2018.
Results
The prevalence of MetS was stable from 2007 to 2018 (1.7% to 2.2%). There were significant increases in the prevalence of central obesity (from 8.1% to 11.2%, P=0.012) and hyperglycemia (from 5.3% to 10.4%, P<0.001) and decreases in hypo-high-density lipoprotein (HDL)-cholesterolemia (from 22.4% to 14.8%, P<0.001). Total calorie intake and calorie intake from fat significantly increased (P<0.001), whereas calorie intP<reased (P<0.001) during the study period. The proportions of tobacco smokers and regular walkers significantly decreased from 2007 to 2018. After controlling for all covariates, total calorie intake was positively correlated with waist circumference (P<0.05). HDL-cholesterol was negatively associated with carbohydrate consumption (P<0.01) and positively associated with fat consumption (P<0.001). Regular walking and regular strength training were associated with lower waist circumference (P<0.05). Smoking was associated with lower fasting glucose levels (P<0.01).
Conclusion
Although the prevalence rate of MetS is stable among Korean adolescents, the prevalence of central obesity and hyperglycemia has increased greatly in the recent decade. Public education on proper dietary intake and lifestyle modification is required.
INTRODUCTION
Metabolic syndrome (MetS) is characterized by clustering of risk factors such as central obesity, hyperglycemia, dyslipidemia, and hypertension [1]. The onset of MetS in adolescence often leads to MetS in adulthood, resulting in cardiovascular disease and type 2 diabetes mellitus in later life [2,3]. Therefore, it is important to understand the modifiable predictors for MetS in adolescents to reduce the morbidity in adulthood.
During the last four decades, mean body mass index (BMI) values among children and adolescents worldwide have increased [4]. Therefore, research on the trends of MetS and its related lifestyle factors is critical. Although several studies have reported the prevalence of MetS among contemporary Korean adolescents, only few studies have reported the trends of MetS in adolescents in recent years. The few existing studies reported varying trends for MetS trends in Korea and other countries [5-8]. Furthermore, no recent studies have reported trends of MetS and its components in the adolescent population. Thus, from a public health aspect, investigating changes in the trends of MetS and its associated lifestyle factors among the pediatric population is critical to control cardiovascular risk factors in the future.
We examined trends in the prevalence of MetS and its components among adolescents aged 12 to 18 years in Korea, using data from the Korean National Health and Nutrition Examination Surveys (KNHANES) 2007 to 2018, and we analyzed the correlation between each risk factor.
METHODS
Study population
The data were obtained from the KNHANES, conducted between 2007 and 2018 by the Korea Centers for Disease Control and Prevention. A total of 8,087 individuals aged 12 to 18 years participated in the survey. The study population included participants whose anthropometric/blood pressure (BP) measurements and blood laboratory test reports were available. Those who had no more than 9 hours of fasting before blood sampling, those who took medications for hypertension and dyslipidemia, and those who had a medical history of hepatic, renal, or endocrine disease were excluded. In addition, adolescents were excluded if they reported physician-diagnosed diabetes; had fasting serum glucose levels ≥126 mg/dL, or had glycosylated hemoglobin (HbA1c) ≥6.5%. Based on the above criteria, a total of 6,308 teenagers (3,334 boys and 2,974 girls) aged 12 to 18 years were found eligible and were included in this study.
The 2007–2009, 2010–2012, and 2013–2015 KNHANES protocol was approved by an Institutional Review Board (IRB) of the Korea Centers for Disease Control and Prevention (IRB No. 2007-02CON-04-P/2008-04EXP-01-C/2009-01CON-03-2C, 2010-02CON-21-C/2011-02CON-06-C/2012-01EXP-01-2C, and 2013-07CON-03-4C/2013-12EXP-03-5C). The 2016 to 2018 KNHANES protocol was exempted from IRB approval based on the Korean bioethics law concept. Written informed consent was obtained from all the participants and their parents. The IRB of Inje University Sanggye Paik Hospital (IRB approval number: SGPAIK 2020-04-005) approved this research protocol.
Data collection and study variables
The height and weight of each participant were measured using a stadiometer and a digital weighing scale of 0.1 cm and 0.1 kg, respectively. BMI was calculated by dividing body weight (kg) by the square root of height (m). BMI status was determined by sex- and age-specific percentiles of BMI: normal (BMI <85th percentile), overweight (BMI ≥85th percentile and <95th percentile), obesity (BMI ≥95th percentile), and extreme obesity (BMI ≥99th percentile). Waist circumference was measured in the standing position, at the end of expiration, at the middle point of the lower margin of the 12th rib and upper margin of the iliac crest. Central obesity was defined as having a waist circumference ≥90th percentile values for adolescents aged 12 to 15 years [9], ≥90 cm for boys aged 16 to 18 years, and ≥85 cm in girls aged 16 to 18 years [10]. BP was measured three times in the sitting position, and the mean values were used in the investigation. Hypertension was defined as systolic BP ≥130 mm Hg or diastolic BP ≥85 mm Hg [9].
The household income group was defined by equalized household income quartile values (total household income divided by the square root of the income of the household members). Duration and number of walking days a week were assessed using a questionnaire. Participants were divided into two categories depending on the walking duration per week: those who walked for 150 minutes a week or more and those who walked for less than 150 minutes per week. If the participant performed muscle training for more than 2 days a week, they were classified as regular strength trainers. Smoking status was classified into three groups: nonsmoker (subjects who never smoked in the past 30 days), occasional smokers (subjects who smoked less than 14 cigarettes in the 30 days prior to the survey), and frequent smokers (subjects who smoked more than 14 cigarettes in the 30 days prior to the survey). Daily calorie intake was estimated using the 24-hour dietary recall interviews by qualified dietary staff. Participants were asked to recall the food items they ingested during the past 24 hours, and the quantities of each item. Energy intakes were estimated using Korean Nutrition Society’s nutrient intake assessment software (Can-Pro 2.0). The percentage of calories contributed by a specific energy source was calculated using the following equations: percentage of calories from carbohydrates=(4×grams of carbohydrate×100)/total calories; percentage of calories from protein=(4×grams of protein×100)/total calories; percentage of calories from fats=(9×grams of fat×100)/total calories.
After overnight fasting (more than 9 hours), blood samples were collected from the participants. An enzymatic colorimeter process, ADIVIA1650 (Siemens, Washington, DC, USA), was used to test serum glucose, triglyceride, and high-density lipoprotein (HDL)-cholesterol levels from 2007 to February 15, 2008, and Hitachi Automatic Analyzer 7600 (Hitachi, Tokyo, Japan) was used from February 20, 2008 to 2018. Hyperglycemia and hypertriglyceridemia were defined as fasting glucose ≥100 mg/dL and triglycerides ≥150 mg/dL, respectively [9]. Hypo-HDL-cholesterolemia was determined in adolescents aged 10 to 15 years and boys aged 16 to 18 years as HDL-cholesterol <40 mg/dL, or in girls aged 16 to 18 years as HDL-cholesterol <50 mg/dL [9].
Definition of metabolic syndrome
In this study, we defined MetS using the International Diabetes Federation (IDF) consensus definition for children and adolescents [9]. According to this definition, MetS is diagnosed if central obesity presents with two or more of the following four criteria: (1) hypertriglyceridemia; (2) hypo-HDL-cholesterolemia; (3) hypertension; and (4) hyperglycemia.
Statistical analysis
Data analyses were conducted using SPSS version 25.0 (IBM Inc., Chicago, IL, USA) for Windows. We performed configuration of the database and complex multistage, probability sampling design analysis. We log-transformed the concentrations of triglycerides to obtain a normal distribution. The complex samples crosstabs procedure was used for categorical or ordinal variables, and the complex samples descriptive procedure was used for continuous variables. General linear models of the complex samples were used to analyze the association between lifestyle variables and MetS components. For all statistical tests, differences were considered statistically significant if P value was <0.05.
RESULTS
General characteristics of subjects
The general characteristics of the study sample are described in Table 1 and Fig. 1. The mean age of the participants during 2007 to 2009 was significantly lower than that during 2006 to 2018 (15.0 years vs. 15.3 years, P=0.003). Smoking rates were highest from 2010 to 2012, at 10.2%, whereas they were lowest during 2016 to 2018, at 4.9%, and the rates showed a significant decreasing trend over the study period (P<0.001). The proportion of regular walkers was 61.1% during 2007 to 2009, which gradually declined to 45.7% during 2016 to 2018 (P<0.001). Regarding energy intakes, significantly higher total calorie intake was noted during 2010 to 2018 than during 2007 to 2009 (2,152.6 kcal/day vs. 1,991.8 kcal/day, P<0.001). While the percentage of energy intake from carbohydrates showed a marked decrease from 64.0% to 59.7% (P<0.001), the percentage of energy intake from fats (from 21.8% to 25.3%, P<0.004) and proteins (from 14.1% to 14.7%, P=0.001) showed a small but significant increase during the study period.

General characteristics of the participants (n=6,308)
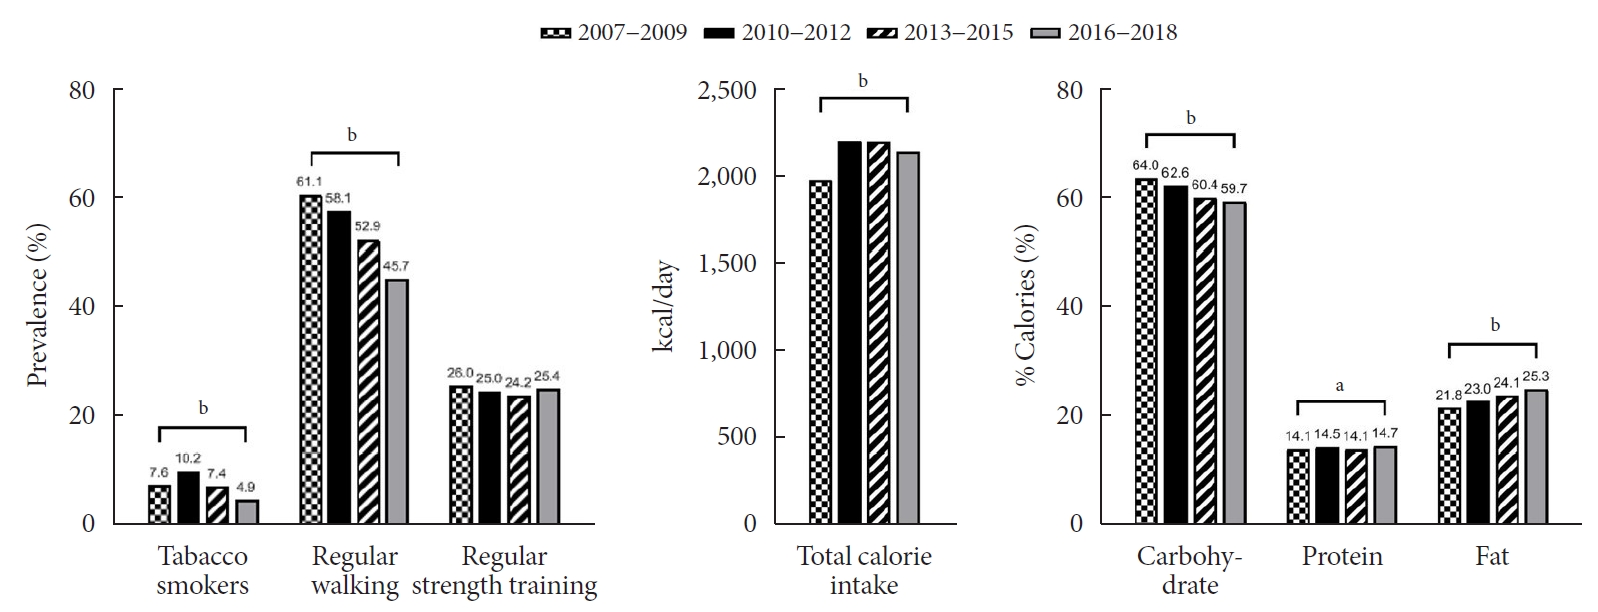
Trends in lifestyle factors among Korean adolescents over 12 years (2007 to 2018). aP<0.01, bP<0.001.
Trends in MetS and its components
Trends in obesity, MetS, and its components are presented in Table 2 and Fig. 2. Although there was a small increase in the prevalence of obesity (from 6.0% to 7.3%) and MetS (from 1.7% to 2.2%), there was no statistical significance (P>0.05). Regarding the individual components of MetS, the prevalence of both central obesity (from 8.1% to 11.2%, P=0.012) and hyperglycemia (from 5.3% to 10.4%, P<0.001) demonstrated a marked increase over the study period. On the other hand, the prevalence of hypo-HDL-cholesterol significantly decreased from 22.4% to 14.8% (P<0.001). The prevalence of hypertriglyceridemia somewhat decreased from 9.6% to 7.9%, without statistical significance.

Trends in metabolic syndrome components over 12 years
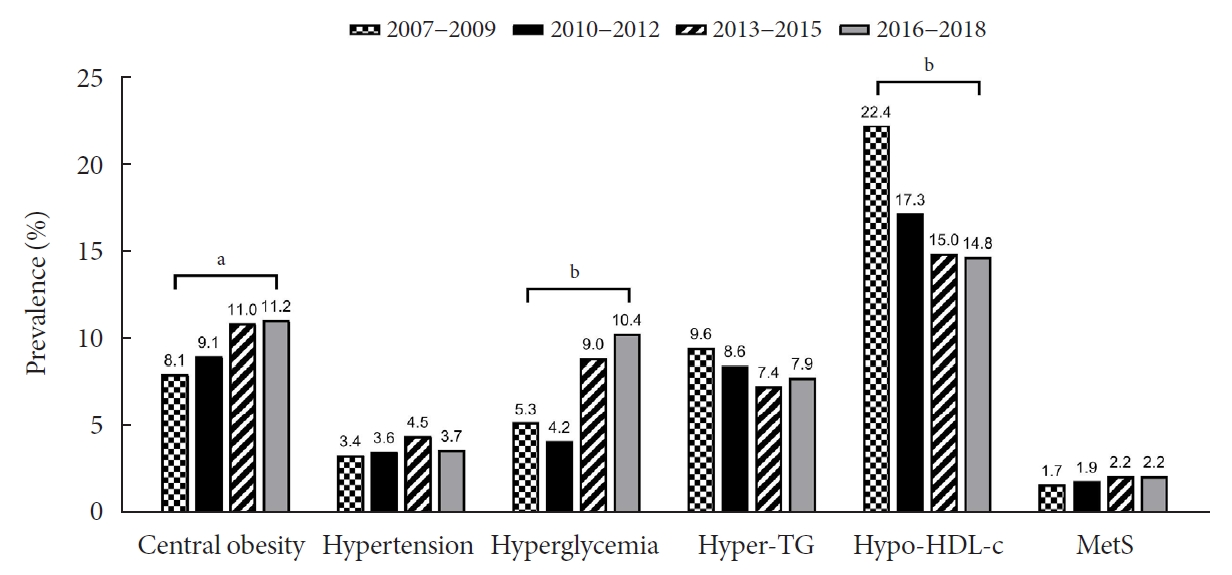
Trends in the prevalence of metabolic syndrome (MetS) and its components among Korean adolescents over 12 years (2007 to 2018). Hyper-TG, hypertriglyceridemia; Hypo-HDL-c, hypo-HDL-cholesterolemia. aP<0.05, bP<0.001.
Association between metabolic parameters and lifestyle factors
Table 3 shows the mean differences in metabolic parameters according to lifestyle factors. Both frequent (88.3 mg/dL) and occasional smokers (88.8 mg/dL) showed significantly lower serum fasting glucose levels than non-smokers (89.9 mg/dL, P<0.01). However, other metabolic parameters, including waist circumference and lipid profiles, were not influenced by smoking status. Regular walkers showed substantially lower waist circumference (70.9 cm) than non-regular walkers (71.2 cm, P<0.05). Both regular and regular strength trainers had significantly lower serum triglyceride levels than those who did not exercise on a regular basis (P<0.05). Other metabolic parameters were not significantly different according to smoking status and exercise practice.
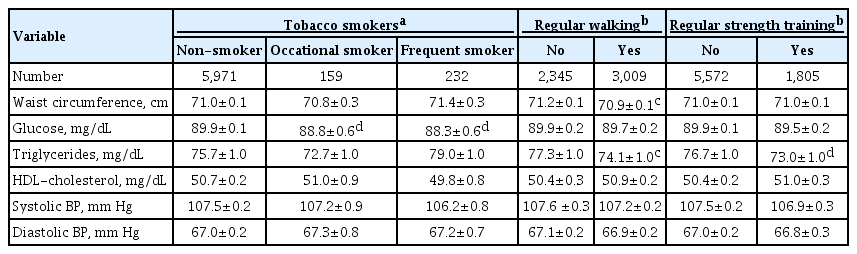
Mean difference in metabolic parameters according to lifestyle factors
The results of the correlation between metabolic parameters and daily calorie intake are shown in Table 4. Waist circumference was positively associated with total calorie intake (P<0.05). Other parameters, including glucose, triglycerides, HDL-cholesterol, and BP, were not significantly associated with total calorie intake. Regarding the relationship between the source of calorie intake and metabolic parameters, the percentage of calorie intake from carbohydrates was negatively correlated with HDL-cholesterol levels (P<0.01), positively correlated with systolic BP (P<0.05), and not with fasting glucose levels. The percentage of calorie intake from fats showed a strong positive correlation with HDL-cholesterol levels (P<0.001), but was not related to other metabolic parameters, including waist circumference. The percentage of calorie intake from protein was not significantly associated with metabolic parameters.
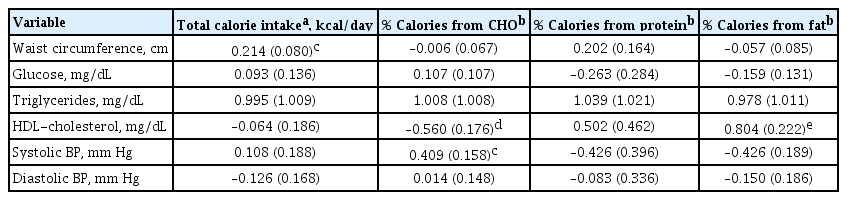
Association of metabolic parameters with daily calorie intake
DISCUSSION
The present study found no significant difference in the overall prevalence of MetS among Korean teenagers between 2007 and 2018. Although the prevalence of MetS was stable during the study period, an increasing trend in central obesity and hyperglycemia and a decreasing trend in hypo-HDL-cholesterolemia were noted. We also verified the relationship between lifestyle factors and MetS parameters. Tobacco smoking was associated with lower fasting glucose levels. Regular walking was associated with lower waist circumference and lower triglycerides levels in this population. Total calorie intake was positively related to waist circumference, and the percentage of calorie intake from carbohydrates and fats was significantly correlated with HDL-cholesterol levels in opposite directions. To the best of our knowledge, this is the first epidemiological research study to show that cigarette smoking is linked to fasting plasma glucose in teenagers.
In this study, MetS prevalence defined according to by IDF Criteria was 1.7% to 2.2% among Korean adolescents, which is similar to 2.3% in China [11], and less than 3.9% to 5.5% in the United States [12,13] and 4% in Iran [14]. Epidemiological studies have shown that in recent decades, the trends in the prevalence of MetS in the United States are stable or decreasing [5,6], whereas it is increasing in Iran [15]. A few studies have demonstrated an increasing trend of MetS among Korean adolescents in the early 2000s [5]; however, since then, there has been a lack of research on trends in MetS. This study confirms that there is little difference in MetS prevalence among Korean adolescents during the past 12 years.
We found that the obesity prevalence remained constant among Korean adolescents, similar to the data reported in high-income countries [4,16]. However, central obesity seemed to be on the rise. A similar growing trend in central obesity among teenagers has been reported in many countries including China [17,18], Brazil [19], Australia [20], and Poland [21]. In contrast, no significant change has been reported in the United States [22]. The proportion of regular walkers decreased with an increase in central obesity during the study period, and regular walkers had lower waist circumference. This finding is consistent with growing evidence that physical inactivity is a key risk factor in pediatric obesity [23,24]. We also found that waist circumference was positively correlated with total calorie intake, showing an increasing trend over the last 12 years. These findings suggest that excessive energy intake and sedentary lifestyle are responsible for the current increase in central obesity among Korean adolescents. As adolescence is a crucial time for positive lifestyle development, adolescent education on adequate calorie intake for sex and age, and physical activity is required to prevent and control central obesity.
The negative association between physical activity, including regular walking and regular strength training, and triglyceride level was confirmed in this study. Previous studies have shown a similar correlation between physical activity and triglycerides [25,26]. However, some studies have shown no significant relationship [27,28]; therefore, further research in this area is necessary. Although the underlying mechanism is unclear, it can be postulated that physical activity promotes triglyceride consumption by skeletal muscle, thereby decreasing the lipid concentration [29,30]. An exercise-induced increase in lipoprotein lipase activity, which helps triglyceride hydrolysis, also explains the decline in triglycerides due to physical activity [31].
In this study, hypo-HDL-cholesterolemia showed a decreasing trend, accompanied by an increase in fat intake and a decrease in carbohydrate intake. Previous meta-analyses have suggested that the intake of most types of fatty acids in replacement of carbohydrates increased HDL-cholesterol, while increased intake of trans-fatty acids was associated with the reduction of HDL-cholesterol [32,33]. In addition, several interventional studies have reported that low carbohydrate intake increases HDL-cholesterol by reducing the plasma apolipoprotein B (apoB)/apoA-1 ratio and insulin resistance [34,35]. Despite strong evidence for the impact of dietary fat/carbohydrate intake on lipid profiles in adults, only a few studies have been reported on the issue [6]. HDL-cholesterol improvement in our study population, despite increased total calorie intake and decreased physical activity, is partly explained by reduced carbohydrate/increased fat intake. Our finding supports an association between fat/carbohydrate intakes and HDL-cholesterol in the pediatric population.
In this study, we found that the prevalence of hyperglycemia among Korean teenagers is on the rise. There has been a lack of accessible prevalence estimates for hyperglycemia among adolescents. Recently, two epidemiologic studies demonstrated an increasing trend in the prevalence of prediabetes by HbA1c and serum glucose assessment and raised the need for urgent interventions among United States adolescents [36,37]. The rising prediabetes trend in United States adolescents was primarily associated with an increase in obesity [36]. We believe that the increasing trend of central obesity could mainly explain the rise in hyperglycemia in Korean teenagers. The increase in teenagers’ hyperglycemia can also be explained by the decrease in physical activity and the increase in fat intakes. Physical activity increases the number and function of glucose transporter type 4 (GLUT4) in muscle and increases blood flow to the muscle, which improves insulin sensitivity [38]. Previous studies of adults have shown that high-fat diets reduce insulin sensitivity without increasing internal fat [39]. Other previous studies of adults found that a short-term highfat diet and physical inactivity reduce insulin sensitivity, and physical activity was found to have a protective effect on the decrease of insulin sensitivity by a high-fat diet [40]. Therefore, we think that the decline in physical activity added to the increase in dietary fat might have contributed to the rise in hyperglycemia by worsening insulins resistance among Korean adolescents.
In addition, we found a significant association between tobacco smoking and higher fasting glucose levels in this study population. The relationship between blood glucose and smoking is controversial. Some studies that reported a positive relationship between smoking and serum glucose suggested that smoking might cause insulin resistance [41,42] or pancreatic β-cell impairment [43,44]. Other studies have suggested that smoking reduces serum glucose because nicotine blocks the release of inflammatory cytokines, which inhibits inflammation associated with insulin resistance and reduces hyperglycemia [45]. Additionally, smoking-induced catecholamines increase the metabolism of soluble nutrients including glucose [45]. Regardless of the controversial association between smoking and glucose, smoking remains a major risk factor for cardiovascular disease and diabetes-related complications [46,47]. Therefore, adolescent awareness on the importance of avoiding smoking should be emphasized, regardless of their blood glucose levels.
This study has several limitations. First, as this is not a longitudinal study, a causal relationship cannot be established. Second, because data on the lifestyle factors were collected using self-reported questionnaires, biases may affect the results. Finally, the pubertal status of the participants, which may affect insulin resistance and lipid profile, was not validated in this study. Nonetheless, this is the first epidemiological study that investigated both the trends of MetS in Korean teenagers over the last 12 years and the related lifestyle factors using a nationally representative sample. We also discussed the potential mechanisms by which lifestyle factors, including smoking and sources of energy consumption, can influence the metabolic components.
In conclusion, while the prevalence of MetS has been constant over the past decade, the prevalence of central obesity and hyperglycemia has increased among Korean adolescents. Korean teenagers need public education regarding proper lifestyle modification and adequate calorie consumption.
Notes
CONFLICTS OF INTEREST
No potential conflict of interest relevant to this article was reported.
AUTHOR CONTRIBUTIONS
Conception or design: J.C., S.H.K., M.J.P.
Acquisition, analysis, or interpretation of data: J.C., S.H.K.
Drafting of the work or revision: J.C., M.Y.S., S.H.K., M.J.P.
Final approval of the manuscript: J.C., M.Y.S., S.H.K., M.J.P.
FUNDING
None
Acknowledgements
We thank the Korea Centers for Disease Control and Prevention for providing the data.