
- Current
- Browse
- Collections
-
For contributors
- For Authors
- Instructions to authors
- Article processing charge
- e-submission
- For Reviewers
- Instructions for reviewers
- How to become a reviewer
- Best reviewers
- For Readers
- Readership
- Subscription
- Permission guidelines
- About
- Editorial policy
Articles
- Page Path
- HOME > Diabetes Metab J > Volume 45(5); 2021 > Article
-
Original ArticleComplications Screening Tools Based on Nomogram for Diabetic Kidney Diseases in Chinese Type 2 Diabetes Mellitus Patients
-
Ganyi Wang1,*
 , Biyao Wang2*, Gaoxing Qiao3, Hao Lou4, Fei Xu5, Zhan Chen6, Shiwei Chen1
 -
Diabetes & Metabolism Journal 2021;45(5):708-718.
DOI: https://doi.org/10.4093/dmj.2020.0117
Published online: April 13, 2021
1ADR Monitoring Department, Henan Medical Products Administration & Center for ADR Monitoring of Henan, Zhengzhou, China
2Zhengzhou University Affiliated Cancer Hospital, Zhengzhou, China
3Department of Pharmacy, The First Affiliated Hospital of Zhengzhou University, Zhengzhou, China
4Department of Infection Control, The First Affiliated Hospital of Zhengzhou University, Zhengzhou, China
5Department of Epidemiology and Biostatistics, College of Public Health, Zhengzhou University, Zhengzhou, China
6Department of Nephrology, The First Affiliated Hospital of Zhengzhou University, Zhengzhou, China
-
Corresponding authors: Ganyi Wang, , Henan Medical Products Administration & Center for ADR Monitoring of Henan, 127 Huayuan Rd., Zhengzhou 450008, China E-mail: gywang9999@163.com
- Shiwei Chen, https://orcid.org/0000-0003-1756-231X, Henan Medical Products Administration & Center for ADR Monitoring of Henan, 127 Huayuan Rd., Zhengzhou 450008, China E-mail: csw3000@163.com
- *Ganyi Wang and Biyao Wang contributed equally to this study as first authors.
Copyright © 2021 Korean Diabetes Association
This is an Open Access article distributed under the terms of the Creative Commons Attribution Non-Commercial License (http://creativecommons.org/licenses/by-nc/4.0/) which permits unrestricted non-commercial use, distribution, and reproduction in any medium, provided the original work is properly cited.
ABSTRACT
-
Background
- The influencing factors of diabetic kidney disease (DKD) in Chinese patients with type 2 diabetes mellitus (T2DM) were explored to develop and validate a DKD diagnostic tool based on nomogram approach for patients with T2DM.
-
Methods
- A total of 2,163 in-hospital patients with diabetes diagnosed from March 2015 to March 2017 were enrolled. Specified logistic regression models were used to screen the factors and establish four different diagnostic tools based on nomogram according to the final included variables. Discrimination and calibration were used to assess the performance of screening tools.
-
Results
- Among the 2,163 participants with diabetes (1,227 men and 949 women), 313 patients (194 men and 120 women) were diagnosed with DKD. Four different screening equations (full model, laboratory-based model 1 [LBM1], laboratory-based model 2 [LBM2], and simplified model) showed good discriminations and calibrations. The C-indexes were 0.8450 (95% confidence interval [CI], 0.8202 to 0.8690) for full model, 0.8149 (95% CI, 0.7892 to 0.8405) for LBM1, 0.8171 (95% CI, 0.7912 to 0.8430) for LBM2, and 0.8083 (95% CI, 0.7824 to 0.8342) for simplified model. According to Hosmer-Lemeshow goodness-of-fit test, good agreement between the predicted and observed DKD events in patients with diabetes was observed for full model (χ2=3.2756, P=0.9159), LBM1 (χ2=7.749, P=0.4584), LBM2 (χ2=10.023, P=0.2634), and simplified model (χ2=12.294, P=0.1387).
-
Conclusion
- LBM1, LBM2, and simplified model exhibited excellent predictive performance and availability and could be recommended for screening DKD cases among Chinese patients with diabetes.
- Diabetic kidney disease (DKD) is one of the most major microvascular and long-standing complications of diabetes mellitus and remains a leading global public health burden causing more than 40% of end-stage renal disease and requiring dialysis or renal transplantation [1,2]. Preventing the risk and disease burden of DKD is positively associated with diabetes duration. However, diabetes has become an important public health problem with increasing number of cases at more than 420 million worldwide since 2014 according to the World Health Organization [3]. In addition, the global morbidity of diabetes has been increasing over the past four decades, especially in developing countries, such as China [4-6], the most populous country in the world. Approximately 50% of patients with diabetes living in rural areas have low awareness, treatment, and control rates due to the large gap of medical and health facilities between the distinct dual structure of urban and rural areas [4]. Given the relatively limited medical and health facilities in Chinese rural areas, treating and controlling diabetes in an early stage are difficult, thus leading to a high potential risk of DKD. Early DKD diagnosis is still a health problem in China, and screening and identifying high risk individuals and cases are urgently needed to improve the primary prevention of DKD. A simple and easy-to-use screening equation that can be applied throughout China is necessary for the efficient early diagnosis and primary prevention strategies of DKD to decrease the prevalence and burden of this disease.
- Early diagnosis and prevention of DKD are important due to the hidden early onset of this disease. To date, convenient and intuitive assessment tools to screen and diagnose DKD risk in patients with diabetes are lacking.
- Novel approaches for disease screening, diagnosis, prognosis, and prediction have been consistently explored. As a pictorial representation of a complex mathematical formula and usable visual equation, nomogram has been widely utilized in prognosis and screening [7], especially in assessing the risk of chronic metabolic diseases. With its ability to generate an individual probability of a clinical event by integrating diverse prognostic and determinant variables, this tool meets the requirements for biologically and clinically integrated models and paves the way for personalized medicine [8]. A DKD screening nomogram equation in Chinese patients with diabetes mellitus is an ideal and cost-effective approach for rational decision-making regarding primary preventive strategy and clinic practice to diagnose and treat cases. This study aims to establish a simple and usable DKD screening nomogram tool and to assess the performance of a new equation for DKD diagnosis in Chinese patients with diabetes mellitus.
INTRODUCTION
- Study design and participants
- This cross-sectional study was conducted in Henan Province, China. All patients were recruited from the inpatient clinic of the First Affiliated Hospital of Zhengzhou University. Demographic and clinical data were collected using electronic health record including a standardized questionnaire and medical examinations. Given that type 2 diabetes mellitus (T2DM) is the main type of diabetes mellitus in China, the selected participants were patients with T2DM without major disability, severe infectious diseases, cancer, severe psychiatric disturbance, non-DKD, pregnancy, or glucocorticoid treatment. A total of 2,197 in-hospital patients with diabetes diagnosed from March 2015 to March 2017 were enrolled. After 24 patients aged <18 years and 12 individuals with missing data were excluded, 2,163 patients were finally included.
- This study was approved by the Medical Ethics Committee of the First Affiliated Hospital of Zhengzhou University (NO. 2019-KY-015). All participants signed an informed consent form.
- Data collection and laboratory measurements
- Demographic characteristics, family and individual disease history, and lifestyle were obtained by using a questionnaire. Anthropometric data such as height, weight, systolic blood pressure (SBP) and diastolic blood pressure (DBP) were also included. Blood pressure was measured three times by a mercury sphygmomanometer in the sitting position according to the American Heart Association’s standardized protocol [9], and the mean of three measurements was used for analysis. Blood specimens were collected to measure lipid profile and fasting plasma glucose (FPG) following overnight fasting. Drinking was defined as drinking at least once a month on average. Hypertension was defined as SBP ≥140 mm Hg and/or DBP ≥90 mm Hg and/or diagnosed by a physician and currently receiving anti-hypertension treatment according to 2010 Chinese guidelines for the management of hypertension [10]. T2DM status was defined as having an FPG ≥7.0 mmol/L and/or diagnosed by a physician [11]. According to the criteria of the National Kidney Foundation Kidney Disease Outcomes Quality Initiative (NKF-KDOQI) (2007), DKD was diagnosed as estimated glomerular filtration rate (eGFR) <60 mL/min/1.73 m2 and/or urine albumin-to-creatinine ratio (UACR) >30 mg/g for ≥3 months caused by diabetes [12]. eGFR was assessed by the Chronic Kidney Disease Epidemiology Collaboration (CKDEPI) equation, and UACR was measured by random spot urine for three times with at least two positive results out of three tests.
- Prediction model selection and development
- Nomogram approaches have better applications and more advantages in the interpretation of complex mathematical models compared with traditional statistical presentation [7,8,13]. Thus, nomogram based on logistic regression model was selected to establish and develop the optimal DKD screening equation for Chinese patients with T2DM. Candidate predictors were evaluated and selected through univariate analysis. The nomogram was derived and validated using hospitalbased data through the following four steps: nomogram derivation—creation of the nomogram screening equation, nomogram validation—validation of the nomogram screening equation, final nomogram generation—combination of validation and derivation to estimate the final application of the nomogram screening equation, and derivation of the application nomogram—creation of a parsimonious model (fewer predictors) that maintains the discriminative ability, calibration, and overall model performance.
- Logistic regression analysis was used to screen the factors, determine the final variables included in the diagnostic tool based on the nomogram, and evaluate the accuracy, discrimination, and validation of the model in derivation data. A 10- fold cross-validation technique was also utilized to improve the stability and accuracy of the models [14-16].
- Statistical analysis
- Model establishment and evaluation followed the Transparent Reporting of a multivariable prediction model for Individual Prognosis Or Diagnosis (TRIPOD) statement [17], Harrell’s Regression Modeling Strategies [15], and Steyerberg’s guidelines for clinical prediction models [18]. Continuous data were reported as mean±standard deviation for normal distribution or median (interquartile range) for non-normal distribution, and categorical variables were described by count and percentages. Model performance including validity and predictive accuracy was assessed through discrimination (ability to correctly distinguish two classes of outcomes) and calibration (agreement between observed and predicted DKD cases). Discrimination was evaluated by calculating the C-index called area under the receiver operating characteristic (ROC) curve (AUC) [15,19-21]. Calibration was assessed by calibration curve and Hosmer-Lemeshow goodness-of-fit test [19-21] to determine how closely the predicted probabilities numerically agree with the actual outcomes. The performance of the screening equation was evaluated by 10-fold cross-validation technique [14- 16]. Statistical analysis was conducted in R software version 3.5.0 (https://www.R-project.org). A two-tailed P value <0.05 was considered significant.
METHODS
- Participant characteristics
- The demographic and clinical characteristics of participants are presented in Table 1, Supplementary Table 1. Among the 2,163 participants (1,227 men and 949 women), 313 patients with T2DM (194 men and 120 women) were diagnosed as DKD by physicians.
- Gender property was studied for the T2DM patients with and without DKD. The patients with DKD had older age, longer diabetes duration, higher body mass index, DBP, SBP, FPG, glycosylated hemoglobin (HbA1c), fasting plasma C-peptide, total cholesterol (TC), low density lipoprotein cholesterol (LDL-C), uric acid (UA), creatinine, and higher prevalence of hypertension, diabetic retinopathy (DR), and diabetic foot than those without DKD. By contrast, the participants with DKD had lower eGFR than those without DKD. With regard to gender, females have older age, higher LDL-C, high density lipoprotein cholesterol, and TC than males, who in turn have higher fasting plasma C-peptide, DBP, SBP, triglyceride, creatinine, UA, smoking rates, drinking rates, and prevalence of coronary heart disease (CHD) and DKD. Results of the univariate analysis of logistic regression model are presented in Supplementary Table 2.
- Development of predictive models
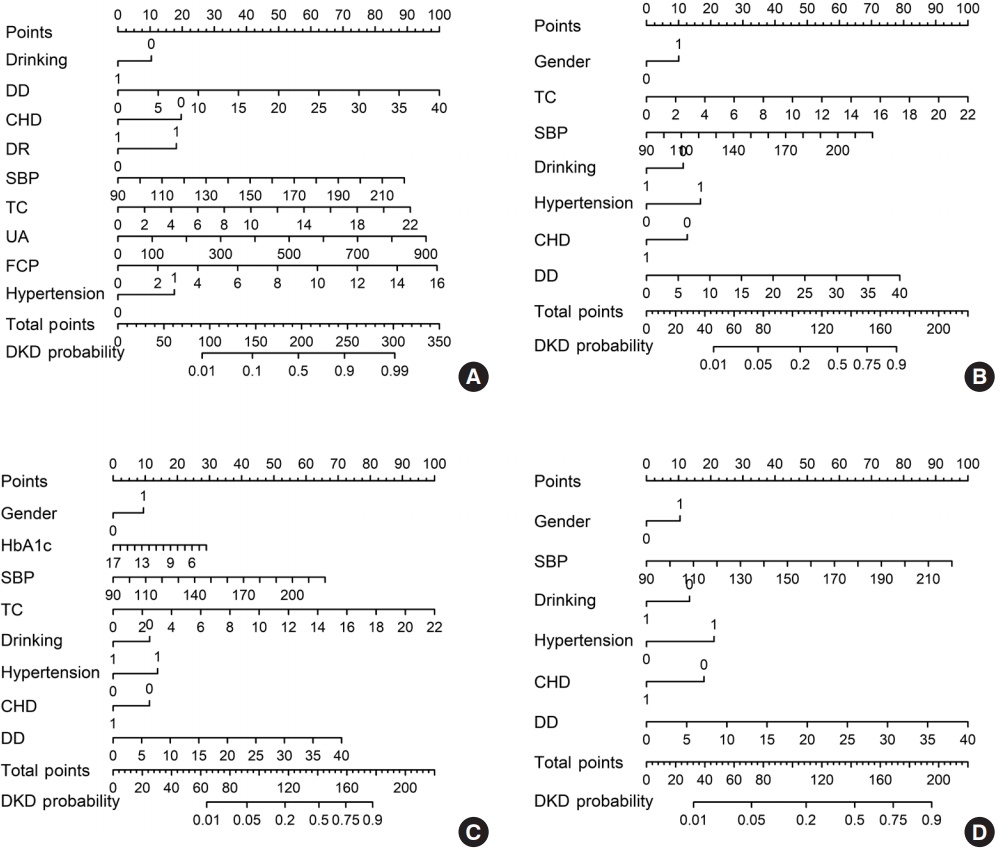
- All candidate predictors (except eGFR and UACR which are key indicators for DKD clinical diagnosis) were considered in assessing the full model. The logistic regression model was established in the full model and included drinking status, hypertension, diabetes duration, CHD history, SBP, TC, fasting plasma C-peptide, UA, and DR (Table 2). The full model indicated good internal consistency as verified by 10-fold crossvalidation (Supplementary Table 3).
- With the exclusion of the predictor of DR, two laboratorybased models (LBMs) were developed based on the full model. The laboratory-based model 1 (LBM1) included gender, SBP, TC, drinking, hypertension, CHD, and diabetes duration (Table 2), and the laboratory-based model 2 (LBM2) included the above parameters with the addition of HbA1c. These models showed good internal consistency as confirmed by 10-fold cross-validation (Supplementary Table 3).
- With the exclusion of blood measured predictors such as TC and HbA1c, a simplified model with non-laboratory predictors was established to provide a common and available method for patients with T2DM. The final simplified model consisted of gender, SBP, drinking, hypertension, CHD, and diabetes duration (Table 2) and indicated good internal consistency as verified by 10-fold cross-validation (Supplementary Table 3).
- The nomograms of these four DKD screening models are shown in Fig. 1.
- Model performance
- C-index was utilized to assess the discrimination of screening models. The ROC curves of different DKD risk screening models for patients with T2DM are shown in Fig. 2. All four screening models generated AUCs with good discrimination (Table 3) with the following values: 0.8450 (95% confidence interval [CI], 0.8202 to 0.8690) for full model, 0.8149 (95% CI, 0.7892 to 0.8405) for LBM1, 0.8171 (95% CI, 0.7912 to 0.8430) for LBM2, and 0.8083 (95% CI, 0.7824 to 0.8342) for simplified model.
- Calibration curve and Hosmer-Lemeshow goodness-of-fit tests were conducted to estimate the calibration of different screening models. Good agreement between the predicted and actual DKD events in patients with T2DM was observed for the full model (χ2=3.2756, P=0.9159), LBM1 (χ2=7.749, P=0.4584), LBM2 (χ2=10.023, P=0.2634), and simplified model (χ2=12.294, P=0.1387). The calibration charts of these four models are presented in Fig. 3.
RESULTS
- Four DKD screening equations (full model, LBM1, LBM2, and simplified model) for patients with T2DM in China were developed, and their ability for discrimination and calibration was evaluated. All four equations showed good discrimination and calibration for DKD screening and thus provide additional choices for patients with T2DM and primary care physicians to provide a cost-effectiveness approach for DKD prevention.
- China has the highest number of people with diabetes in the world (approximately 116.4 million) [22]. Awareness rate, treatment rate, and control rate for T2DM were still low based on the results of the 2013 Chinese Chronic Diseases and Risk Factors Monitoring Report form the Chinese Center for Disease Control and Prevention. Hence, community-level diabetes prevention and control must be improved. Portable glucometer, sphygmomanometer, heights and weight scale, and soft gauge for measuring waist circumference are necessary equipment for community health service station in urban areas and village health station in rural areas according to the Chinese National guidelines for the prevention and control of diabetes in primary care (2018) [23]. However, no national research was conducted on the incidence of DKD among patients with T2DM in China though T2DM is the main type of diabetes and approximately 10% to 40% of patients with T2DM develop DKD in China [24-26]. The awareness and treatment rates of DKD in China are less than 20% and 50%, respectively [27]. Step-by-step tertiary prevention strategies have been developed to improve primary- and community-level diabetes control and prevention. Grassroot and primary units are the frontline and daily monitors of T2DM and DKD prevention and control. This study aimed to establish a simplified and easy-touse nomogram equation for early DKD diagnosis that can be accomplished in community health service stations in urban areas and village health stations in rural areas in China.
- DKD is a diabetes complication characterized by microangiopathy, which greatly reduces the life quality and survival rate of patients with diabetes. Early diagnosis and prevention of DKD are important due to the hidden early onset of this disease. The proposed screening equations differ from the risk prediction equations developed by the CKD prognosis consortium [28], which were derived from self-report data and involved various cohorts from different regions and races. Information on specific lifestyles, cultures, and diets could be lost when enhancing the equations’ generalization and applicability, although they are particularly applicable for European and Asian patients. The equations in the present study were only designed for patients with T2DM in the central part of China with similar race, similar demographics, lifestyle, and diet habits based on hospital data. By contrast, the previous equations were developed with data across approximately a half-century from 1970 to 2017. The collected recent data representing the latest socioeconomic status in China revealed that dietary structure and lifestyles have changed greatly for the past several decades due to the rapid development of economy. In general, risk prediction equations developed for one population cannot be efficiently applied to other populations or even the same country after time due to societal change. The most important difference is that the previous equations were derived for CKD risk prediction, but the proposed ones in the present study were used to identify whether patients with T2DM need further examinations for DKD diagnosis. The current research aimed to apply equations to help people from grassroots and rural areas in the central part of China with limited healthcare resources. China has exerted nation-wide efforts to alleviate poverty, and its economy has greatly progressed during the past four decades. The inequality of wealth among populations and of healthcare accessibility is a serious social problem because medical resources are mostly concentrated in large and medium-sized cities rather than in rural regions, especially in some major agricultural provinces in China, such as Henan. Wu and colleagues reported similar DKD risk predictions in China and established a risk score based on non-laboratory factors to predict the 3-year DKD incident risk [29]. Jing and colleagues developed a risk prediction model on DKD from meta-analysis for Chinese patients with diabetes [30]. However, no screening equation has been proposed. The coefficients should be recalibrated before being applied to a new target population setting when the risk factors of the prediction model are derived from meta-analysis or other studies. These models were utilized to identify individuals at “high risk” of DKD in 3 to 5 years. To date, convenient and intuitive assessment tools to screen and diagnose the risk of DKD in patients with diabetes are lacking. The present study aimed to establish an appropriate screen tool to diagnose DKD among patients with T2DM in areas with limited healthcare resources. Several different screening equations were established for different clinical settings, and they are presented as the easy-to-use nomogram. This study conducted an analysis of risk factors for patients with T2DM complicated with DKD and then performed an intuitive and quantitative evaluation of DKD patients’ risk by using a nomogram model to provide a reference for the diagnosis and prevention of DKD.
- Nomogram is the application of complex mathematical models for disease diagnosis and prediction by combining multi-indicators; this method is advantageous in interpretation over traditional statistical presentation [7,8,13]. Risk screening tools are essential and cost-effective for clinical practice and healthcare management, especially in areas with limited resources such as grassroots community and rural regions of China. Widely available candidate predictors were considered for the proposed models in this study. Several risk factors must be considered in diagnosing DKD in T2DM [31-35]. Many other risk factors associated with DKD in T2DM have also been identified [29,36-38]. Demographic factors (such as age, gender, and diabetes duration), anthropometric factors (such as blood pressure and indicators of obesity) and laboratory factors (such as glycemic control status FPG) are the common independent risk factors. Here, risk predictors for detecting and screening DKD were classified into four models to meet different requirements for various situations. The full model included drinking status, hypertension, diabetes duration, CHD history, SBP, TC, fasting plasma C-peptide, UA, and DR and had the best discrimination ability (AUC, 0.8450; 95% CI, 0.8202 to 0.8690) among all models. However, the predictors included in the full model satisfied extensive availability but were impractical for application. Thus, the highly available predictors of gender, SBP, TC, drinking, hypertension, CHD, and diabetes duration (HbA1c was added for LBM2) were used for LBM1. For the simplified model, only non-laboratory measures were included to ensure its availability for patients with T2DM in family and primary community settings. Compared with previous studies, the present work weighed these risk factors and calculated the cumulative risk due to their combination rather than using a single factor. Consistent with previous findings, hypertension history and SBP were found to be important risk factors for DKD in patients with T2DM [29,32,39].
- All the proposed models exhibited good discriminations and calibration. Similar to previous investigations, internal validations were conducted by 10-fold cross-validation to assess the generalization ability and application of the four models, improve their stability, and avoid over-fitting [14-16]. The simplified model without laboratory parameters can be widely used by all healthcare providers and patients themselves, including those in remote areas with scarce medical resources. For people who can measure blood pressure at home and following health check-up, LBM1 and LBM2 can be applied to conveniently screen DKD. Thus, different options are provided for patients with T2DM to primarily assess and manage DKD risk.
- Data from patients with T2DM in China were collected to develop different DKD screening models. This work has some strengths. First, this study focused on detecting and screening the risk of DKD for patients with T2DM and provided different equations for various requirements. The simplified model can be used without laboratory factors at home settings, and LBM1 and LBM2 can be employed in home and primary hospital settings. Second, nomogram equations are highly visual and have a good interpretation for patients and physicians. Moreover, the validation test revealed good discrimination and calibration for all models. Although this work is the first to assess different nomogram screening equations for DKD in Chinese patients with T2DM, some limitations must be addressed. First, information bias such as recall bias cannot be avoided in observational studies. Second, DKD is usually associated with numerous factors, but this study only included the most important and available factors. Third, this work was conducted in a single area; therefore, the results must be validated on a large population in a multicenter study. Although this research has several limitations, great efforts were dedicated to modifying the models, and the findings are relatively reliable to reflect actual conditions.
- In conclusion, four different DKD screening equations for patients with T2DM in China were established and validated. LBM1, LBM2, and simplified model exhibit good predictive performance and availability and could be recommended for screening DKD cases among Chinese patients with T2DM.
DISCUSSION
Supplementary Materials
Supplementary Table 1.
Supplementary Table 2.
Supplementary Table 3.
-
CONFLICTS OF INTEREST
No potential conflict of interest relevant to this article was reported.
-
AUTHOR CONTRIBUTIONS
Conception or design: G.W., S.C.
Acquisition, analysis, or interpretation of data: G.W., B.W., G.Q., H.L., F.X., Z.C.
Drafting the work or revising: G.Q., F.X.
Final approval of the manuscript: G.W., B.W., G.Q., H.L., F.X., Z.C., S.C.
-
FUNDING
None
NOTES
-
Acknowledgements
- The authors would like to thank the participants, the coordinators, and administrators for their supports during the study. The authors would like to thank Dr. Anna Brickell for her suggestions and revision of the manuscripts.


Values are presented as mean±standard deviation, number (%), or median (interquartile range).
T2DM, type 2 diabetes mellitus; DKD, diabetic kidney disease; CHD, coronary heart disease; DR, diabetic retinopathy; DD, diabetes duration; BMI, body mass index; DBP, diastolic blood pressure; SBP, systolic blood pressure; FPG, fasting plasma glucose; HbA1c, glycosylated hemoglobin; FINS, fasting serum insulin; FCP, fasting plasma C-peptide; HDL-C, high density lipoprotein cholesterol; LDL-C, low density lipoprotein cholesterol; TC, total cholesterol; TG, triglyceride; uALB, urine albumin; eGFR, estimated glomerular filtration rate.
- 1. Lewis G, Maxwell AP. Risk factor control is key in diabetic nephropathy. Practitioner 2014;258:13-7.
- 2. KDOQI. Guideline 2: management of hyperglycemia and general diabetes care in chronic kidney disease. Am J Kidney Dis 2007;49(2 Suppl 2):S62-73.
- 3. World Health Organization. WHO Global report on diabetes. Geneva: WHO; 2016.
- 4. Liu M, Wang J, He Y, Jiang B, Wu L, Wang Y, et al. Awareness, treatment and control of type 2 diabetes among Chinese elderly and its changing trend for past decade. BMC Public Health 2016;16:278.ArticlePubMedPMC
- 5. Quan J, Li TK, Pang H, Choi CH, Siu SC, Tang SY, et al. Diabetes incidence and prevalence in Hong Kong, China during 2006-2014. Diabet Med 2017;34:902-8.ArticlePubMedPDF
- 6. Wang L, Gao P, Zhang M, Huang Z, Zhang D, Deng Q, et al. Prevalence and ethnic pattern of diabetes and prediabetes in China in 2013. JAMA 2017;317:2515-23.ArticlePubMedPMC
- 7. Grimes DA. The nomogram epidemic: resurgence of a medical relic. Ann Intern Med 2008;149:273-5.ArticlePubMed
- 8. Balachandran VP, Gonen M, Smith JJ, DeMatteo RP. Nomograms in oncology: more than meets the eye. Lancet Oncol 2015;16:e173-80.ArticlePubMedPMC
- 9. Perloff D, Grim C, Flack J, Frohlich ED, Hill M, McDonald M, et al. Human blood pressure determination by sphygmomanometry. Circulation 1993;88:2460-70.ArticlePubMed
- 10. Liu LS; Writing Group of 2010 Chinese Guidelines for the Management of Hypertension. 2010 Chinese guidelines for the management of hypertension. Zhonghua Xin Xue Guan Bing Za Zhi 2011;39:579-615.PubMed
- 11. American Diabetes Association. Diagnosis and classification of diabetes mellitus. Diabetes Care 2009;32 Suppl 1:S62-7.ArticlePubMedPDF
- 12. KDOQI. KDOQI clinical practice guidelines and clinical practice recommendations for diabetes and chronic kidney disease. Am J Kidney Dis 2007;49:S12-154.ArticlePubMed
- 13. Yang L, Shen W, Sakamoto N. Population-based study evaluating and predicting the probability of death resulting from thyroid cancer and other causes among patients with thyroid cancer. J Clin Oncol 2013;31:468-74.ArticlePubMed
- 14. Steyerberg EW, Harrell FE Jr, Borsboom GJ, Eijkemans MJ, Vergouwe Y, Habbema JD. Internal validation of predictive models: efficiency of some procedures for logistic regression analysis. J Clin Epidemiol 2001;54:774-81.PubMed
- 15. Harrell FE. Regression modeling strategies: with applications to linear models, logistic and ordinal regression, and survival analysis. Cham: Springer International Publishing; 2015.
- 16. Yang X, Li J, Hu D, Chen J, Li Y, Huang J, et al. Predicting the 10-year risks of atherosclerotic cardiovascular disease in Chinese population: the China-PAR Project (Prediction for ASCVD Risk in China). Circulation 2016;134:1430-40.ArticlePubMed
- 17. Collins GS, Reitsma JB, Altman DG, Moons KG. Transparent reporting of a multivariable prediction model for individual prognosis or diagnosis (TRIPOD): the TRIPOD statement. BMJ 2015;350:g7594.ArticlePubMed
- 18. Steyerberg EW. Clinical prediction models: a practical approach to development, validation, and updating. New York: Springer; 2008.
- 19. Hosmer DW, Lemesbow S. Goodness of fit tests for the multiple logistic regression model. Commun Stat Theory Methods 1980;9:1043-69.Article
- 20. Steyerberg EW, Vickers AJ, Cook NR, Gerds T, Gonen M, Obuchowski N, et al. Assessing the performance of prediction models: a framework for traditional and novel measures. Epidemiology 2010;21:128-38.PubMedPMC
- 21. D’Agostino RB, Nam BH. Evaluation of the performance of survival analysis models: discrimination and calibration measures. Handb Stat 2003;23:1-25.
- 22. International Diabetes Federation. IDF diabetes atlas. 9th ed. Brussels: IDF; 2019.
- 23. Chinese Diabetes Society; National Offic for Primary Diabetes Care. National guidelines for the prevention and control of diabetes in primary care (2018). Zhonghua Nei Ke Za Zhi 2018;57:885-93.PubMed
- 24. Zhang L, Wang F, Wang L, Wang W, Liu B, Liu J, et al. Prevalence of chronic kidney disease in China: a cross-sectional survey. Lancet 2012;379:815-22.ArticlePubMed
- 25. Lu B, Song X, Dong X, Yang Y, Zhang Z, Wen J, et al. High prevalence of chronic kidney disease in population-based patients diagnosed with type 2 diabetes in downtown Shanghai. J Diabetes Complications 2008;22:96-103.ArticlePubMed
- 26. Guo K, Zhang L, Zhao F, Lu J, Pan P, Yu H, et al. Prevalence of chronic kidney disease and associated factors in Chinese individuals with type 2 diabetes: cross-sectional study. J Diabetes Complications 2016;30:803-10.ArticlePubMed
- 27. Luk AO, Li X, Zhang Y, Guo X, Jia W, Li W, et al. Quality of care in patients with diabetic kidney disease in Asia: the Joint Asia Diabetes Evaluation (JADE) Registry. Diabet Med 2016;33:1230-9.ArticlePubMed
- 28. Nelson RG, Grams ME, Ballew SH, Sang Y, Azizi F, Chadban SJ, et al. Development of risk prediction equations for incident chronic kidney disease. JAMA 2019;322:2104-14.ArticlePubMedPMC
- 29. Wu M, Lu J, Zhang L, Liu F, Chen S, Han Y, et al. A non-laboratory-based risk score for predicting diabetic kidney disease in Chinese patients with type 2 diabetes. Oncotarget 2017;8:102550-8.ArticlePubMedPMC
- 30. Jiang W, Wang J, Shen X, Lu W, Wang Y, Li W, et al. Establishment and validation of a risk prediction model for early diabetic kidney disease based on a systematic review and meta-analysis of 20 cohorts. Diabetes Care 2020;43:925-33.ArticlePubMedPDF
- 31. Al-Rubeaan K, Youssef AM, Subhani SN, Ahmad NA, Al-Sharqawi AH, Al-Mutlaq HM, et al. Diabetic nephropathy and its risk factors in a society with a type 2 diabetes epidemic: a Saudi National Diabetes Registry-based study. PLoS One 2014;9:e88956.ArticlePubMedPMC
- 32. Mogensen CE. Microalbuminuria, blood pressure and diabetic renal disease: origin and development of ideas. Diabetologia 1999;42:263-85.ArticlePubMedPDF
- 33. Tseng CH. Correlation of uric acid and urinary albumin excretion rate in patients with type 2 diabetes mellitus in Taiwan. Kidney Int 2005;68:796-801.ArticlePubMed
- 34. Unnikrishnan RI, Rema M, Pradeepa R, Deepa M, Shanthirani CS, Deepa R, et al. Prevalence and risk factors of diabetic nephropathy in an urban South Indian population: the Chennai Urban Rural Epidemiology Study (CURES 45). Diabetes Care 2007;30:2019-24.PubMed
- 35. Hall ME, do Carmo JM, da Silva AA, Juncos LA, Wang Z, Hall JE. Obesity, hypertension, and chronic kidney disease. Int J Nephrol Renovasc Dis 2014;7:75-88.ArticlePubMedPMC
- 36. Adler AI, Stevens RJ, Manley SE, Bilous RW, Cull CA, Holman RR, et al. Development and progression of nephropathy in type 2 diabetes: the United Kingdom Prospective Diabetes Study (UKPDS 64). Kidney Int 2003;63:225-32.ArticlePubMed
- 37. Park JY, Kim HK, Chung YE, Kim SW, Hong SK, Lee KU. Incidence and determinants of microalbuminuria in Koreans with type 2 diabetes. Diabetes Care 1998;21:530-4.ArticlePubMedPDF
- 38. Gall MA, Hougaard P, Borch-Johnsen K, Parving HH. Risk factors for development of incipient and overt diabetic nephropathy in patients with non-insulin dependent diabetes mellitus: prospective, observational study. BMJ 1997;314:783-8.ArticlePubMedPMC
- 39. Ravid M, Brosh D, Ravid-Safran D, Levy Z, Rachmani R. Main risk factors for nephropathy in type 2 diabetes mellitus are plasma cholesterol levels, mean blood pressure, and hyperglycemia. Arch Intern Med 1998;158:998-1004.ArticlePubMed
REFERENCES
Figure & Data
References
Citations
- Development of Serum Lactate Level-Based Nomograms for Predicting Diabetic Kidney Disease in Type 2 Diabetes Mellitus Patients
Chunxia Jiang, Xiumei Ma, Jiao Chen, Yan Zeng, Man Guo, Xiaozhen Tan, Yuping Wang, Peng Wang, Pijun Yan, Yi Lei, Yang Long, Betty Yuen Kwan Law, Yong Xu
Diabetes, Metabolic Syndrome and Obesity.2024; Volume 17: 1051. CrossRef - Changes in urinary exosomal protein CALM1 may serve as an early noninvasive biomarker for diagnosing diabetic kidney disease
Tao Li, Tian ci Liu, Na Liu, Man Zhang
Clinica Chimica Acta.2023; 547: 117466. CrossRef - Developing screening tools to estimate the risk of diabetic kidney disease in patients with type 2 diabetes mellitus
Xu Cao, Xiaomei Pei
Technology and Health Care.2023; : 1. CrossRef - Development and validation of a novel nomogram to predict diabetic kidney disease in patients with type 2 diabetic mellitus and proteinuric kidney disease
Hui Zhuan Tan, Jason Chon Jun Choo, Stephanie Fook-Chong, Yok Mooi Chin, Choong Meng Chan, Chieh Suai Tan, Keng Thye Woo, Jia Liang Kwek
International Urology and Nephrology.2022; 55(1): 191. CrossRef - Nomogram-Based Chronic Kidney Disease Prediction Model for Type 1 Diabetes Mellitus Patients Using Routine Pathological Data
Nakib Hayat Chowdhury, Mamun Bin Ibne Reaz, Sawal Hamid Md Ali, Shamim Ahmad, María Liz Crespo, Andrés Cicuttin, Fahmida Haque, Ahmad Ashrif A. Bakar, Mohammad Arif Sobhan Bhuiyan
Journal of Personalized Medicine.2022; 12(9): 1507. CrossRef - Development and assessment of diabetic nephropathy prediction model using hub genes identified by weighted correlation network analysis
Xuelian Zhang, Yao Wang, Zhaojun Yang, Xiaoping Chen, Jinping Zhang, Xin Wang, Xian Jin, Lili Wu, Xiaoyan Xing, Wenying Yang, Bo Zhang
Aging.2022; 14(19): 8095. CrossRef
 PubReader
 ePub Link
 Cite
Cite- Figure
-


- Related articles
-
- Risk Prediction and Management of Chronic Kidney Disease in People Living with Type 2 Diabetes Mellitus
- Not Control but Conquest: Strategies for the Remission of Type 2 Diabetes Mellitus
- Serum Retinol-Binding Protein Levels Are Associated with Nonalcoholic Fatty Liver Disease in Chinese Patients with Type 2 Diabetes Mellitus: A Real-World Study


