- Current
- Browse
- Collections
-
For contributors
- For Authors
- Instructions to authors
- Article processing charge
- e-submission
- For Reviewers
- Instructions for reviewers
- How to become a reviewer
- Best reviewers
- For Readers
- Readership
- Subscription
- Permission guidelines
- About
- Editorial policy
Articles
- Page Path
- HOME > Diabetes Metab J > Volume 37(3); 2013 > Article
-
Original ArticleOthers Effect of Green Tea Extract/Poly-γ-Glutamic Acid Complex in Obese Type 2 Diabetic Mice
- Ki-Cheor Bae1, Jae-Hyung Park1, Ann-Yae Na1, Sun-Joo Kim1, Shinbyoung Ahn2, Sang-Pyo Kim3, Byung-Chul Oh4, Ho-Chan Cho5, Yong Woon Kim6, Dae-Kyu Song1
-
Diabetes & Metabolism Journal 2013;37(3):196-206.
DOI: https://doi.org/10.4093/dmj.2013.37.3.196
Published online: June 14, 2013
1Department of Physiology, Keimyung University School of Medicine, Daegu, Korea.
2GCB, Co., Ltd., Suwon, Korea.
3Department of Pathology, Keimyung University School of Medicine, Daegu, Korea.
4Lee Gil Ya Cancer and Diabetes Institute, Gachon University, Incheon, Korea.
5Department of Internal Medicine, Keimyung University School of Medicine, Daegu, Korea.
6Department of Physiology, Yeungnam University College of Medicine, Daegu, Korea.
- Corresponding author: Dae-Kyu Song. Department of Physiology, Keimyung University School of Medicine, 1095 Dalgubeol-daero, Dalseo-gu, Daegu 704-701, Korea. dksong@kmu.ac.kr
- Corresponding author: Yong Woon Kim. Department of Physiology, Yeungnam University College of Medicine, 170 Hyeonchung-ro, Nam-gu, Daegu 705-717, Korea. kimyw@yn.med.ac.kr
- *Ki-Cheor Bae and Jae-Hyung Park contributed equally to this study as first authors.
Copyright © 2013 Korean Diabetes Association
This is an Open Access article distributed under the terms of the Creative Commons Attribution Non-Commercial License (http://creativecommons.org/licenses/by-nc/3.0/) which permits unrestricted non-commercial use, distribution, and reproduction in any medium, provided the original work is properly cited.
ABSTRACT
-
Background
- The increasing prevalence of type 2 diabetes mellitus (T2DM) is associated with the rapid spread of obesity. Obesity induces insulin resistance, resulting in β-cell dysfunction and thus T2DM. Green tea extract (GTE) has been known to prevent obesity and T2DM, but this effect is still being debated. Our previous results suggested that circulating green tea gallated catechins (GCs) hinders postprandial blood glucose lowering, regardless of reducing glucose and cholesterol absorption when GCs are present in the intestinal lumen. This study aimed to compare the effect of GTE with that of GTE coadministered with poly-γ-glutamic acid (γ-PGA), which is likely to inhibit the intestinal absorption of GCs.
-
Methods
- The db/db mice and age-matched nondiabetic mice were provided with normal chow diet containing GTE (1%), γ-PGA (0.1%), or GTE+γ-PGA (1%:0.1%) for 4 weeks.
-
Results
- In nondiabetic mice, none of the drugs showed any effects after 4 weeks. In db/db mice, however, weight gain and body fat gain were significantly reduced in the GTE+γ-PGA group compared to nondrug-treated db/db control mice without the corresponding changes in food intake and appetite. Glucose intolerance was also ameliorated in the GTE+γ-PGA group. Histopathological analyses showed that GTE+γ-PGA-treated db/db mice had a significantly reduced incidence of fatty liver and decreased pancreatic islet size. Neither GTE nor γ-PGA treatment showed any significant results.
-
Conclusion
- These results suggest that GTE+γ-PGA treatment than GTE or γ-PGA alone may be a useful tool for preventing both obesity and obesity-induced T2DM.
- In both developing and developed countries, calorie consumption exceeds the necessary level. In addition, modern sedentary lifestyle predisposes people to obesity. The spread of obesity is strongly associated with increasing prevalence of type 2 diabetes mellitus (T2DM) [1,2]. Obesity induces insulin resistance and thus insulin hypersecretion in pancreatic β-cells, resulting in β-cell dysfunction, particularly in people who are genetically susceptible to T2DM [3-6]. Therefore, controlling obesity may be critical in preventing an increase in the number of T2DM patients.
- Green tea extract (GTE) has been widely considered as a potential supplemental remedy for obesity and T2DM; however, its effectiveness in humans has not been clearly demonstrated. In a previous study, we found that GTE reduces postprandial blood glucose levels (BGLs) in the intestinal lumen but elevates postprandial BGLs in the circulation [7]. In addition, we found that gallated catechins (GCs) in GTE, such as epigallocatechin gallate (EGCG) and epicatechin gallate (ECG), could be the major active components [7]. GCs inhibit the function of plasmalemmal glucose transporters in most cells, including Na-dependent glucose transporters in the intestine and kidney (where the GCs exert their beneficial effect), and Na-independent glucose transporters (GLUTs) in the liver, skeletal muscle and adipocytes, where GCs block the cellular entry of glucose [8]. Therefore, nontoxic polymers may be needed to block the intestinal absorption of GCs, lessening the inhibitory effect of GCs on various GLUTs in the circulation.
- Previously, it was found that the antibacterial activity of GTE against Helicobacter pylori observed in vitro was not observed in vivo, most likely because GTE does not stay long enough in the gastrointestinal lumen, instead being easily absorbed into the circulation [9]. When sucralfate (sucrose sulfate-aluminum complex), which is used for antiulcerative therapy and has an affinity for the mucosal membrane of the gastrointestinal tract, is coadministered with GTE, the antibacterial activity of GTE can be observed in vivo [10]. This novel finding prompted us to use poly-γ-glutamic acid (γ-PGA) to increase the persistence of GCs in the intestine and inhibit the intestinal absorption of GCs. γ-PGA is a natural component of food and has been proven to be safe for animals and humans. It is a mucin-like amino acid chain in which D- and L-glutamic acid are linked by a γ-glutamyl bond. γ-PGA can be obtained by cultivating Bacillus subtilis from foods made with fermented beans (Japanese natto, Nepali kinema, Korean chungkookjang for B. subtilis var. chungkookjang). γ-PGA has been widely used as a supplement in foods, cosmetics and drug-delivery systems [11-13]. In this study, we aimed to evaluate the effect of a 4-week GTE+γ-PGA regimen on gain in body weight (BW) and glucose intolerance in obese T2DM db/db mice compared to treatment with GTE alone.
INTRODUCTION
- Chemicals and diets
- γ-PGA (MW: 2,000 KDa) was delivered from NUC Electronics Co. (Daegu, Korea). Green tea leaves (Bosung Seijak) were purchased from Bosung Green Tea Co. (Bosung, Korea). A normal commercial chow diet (NC; 10% fat, 70% carbohydrate, 20% protein), a normal chow diet containing γ-PGA (1 g γ-PGA/kg diet), a normal chow diet containing GTE (10 g GTE/kg diet), and a normal chow diet containing GTE+γ-PGA (10 g GTE/kg and 1 g γ-PGA/kg diet) were prepared by Hyochang Science (Seoul, Korea). Briefly, each ingredient was weighed and blended to homogeneity into appropriately powdered diet. The mixture was then formed into equal sized pellets and placed into a temperature- and humidity-controlled room to remove moisture.
- Preparation of GTE
- For animal studies, 20 g of green tea leaves was added to 1,000 mL of nanopure water. The tea leaves were stirred for 5 minutes at 80℃ and removed by filtration using filter paper (Advantec 2 filter paper; Hyundai Micro Co., Seoul, Korea) under reduced pressure. The extract was dried by lysophilization. A total of 3 g of GTE was harvested. The procedure was repeated until enough amount of GTE necessary for the experiments were harvested; the levels of EGCG, ECG, epigallocatechin, and epicatechin were 100, 53, 56, and 31 mg/g GTE, respectively. Periodically, the diet containing GTE was checked to confirm the concentrations of catechins exceeding 200 mg/g GTE.
- Analysis of catechins from GTE with high performance liquid chromatography
- High performance liquid chromatography (HPLC) analysis was conducted on a Waters Alliance 2,695 liquid chromatograph equipped with a model 2,487 dual absorbance detector (Waters Co., Milford, MA, USA). A Waters Symmetry C18 reversed-phase packing column (4.5×250 mm, 5 m) was used at 25℃ for separation throughout this study. Catechins were determined simultaneously at 235 nm. A gradient elution was performed by varying the proportion of solvent A (water-trifluoroacetic acid, 99.9:0.1 v/v) to solvent B (acetonitrile-trifluoroacetic acid, 99.9:0.1 v/v), with a flow rate of 1 mL/min. The mobile phase composition changed linearly from 9.5% to 14% solvent B in 10 minutes and then kept the same composition for 10 minutes. There was a linear increase in the proportion of solvent B, which reached 27.5% within 15 minutes. The mobile phase composition then returned to the initial conditions over a period of 5 minutes for the next run. All prepared solutions were filtered through 0.45 µm membranes (Sartorius, Maisemore, UK), and the mobile phase was degassed before injection into the HPLC.
- Nuclear magnetic resonance spectroscopy of EGCG-γ-PGA complex
- Nuclear magnetic resonance (NMR) spectroscopy was used to investigate the molecular interactions between EGCG and γ-PGA. 1H NMR and 13C NMR spectra were measured on a JEOL JNM-AL 300 (300 MHz) spectrometer. The sample for EGCG-γ-PGA (w/w, 1:1) complex was prepared by dissolving it in D2O/DMSO-d6 (1:1; Sigma-Aldrich, St. Louis, MO, USA) (concentration of 0.25% [w/v]).
- Animals and treatments
- To determine the short-term effects of GTE+γ-PGA on type 2 diabetic mice, C57BLKS/J Leprdb/Leprdb mice (db/db, male, 9 weeks old, 30.0 to 35.0 g, BGLs 200 to 300 mg/dL) and age-matched control nondiabetic heterozygous mice (male, 18.0 to 22.0 g, BGLs 110 to 140 mg/dL) were purchased from Jung-Ang Experimental Animals (Seoul, Korea) and used as an obese diabetic mouse model. The mice were allowed to acclimate for 1 week on chow and water. Starting at 10 weeks of age, the mice were randomly divided into four groups of 10: control, γ-PGA, GTE, and GTE+γ-PGA. The mice were provided with a semisynthetic normal chow diet containing vehicle, γ-PGA, GTE, or GTE+γ-PGA for 4 weeks. The food consumption of individual mice was checked every day. BW was measured every 7 days using an electronic balance. All mice had free access to food and water and received their specified diet for 4 weeks. The animals were housed (3 to 4 per cage) under a daily cycle of 12 hours light and 12 hours darkness. The experiment conditions were approved by the Keimyung University Institutional Ethics Committee, Daegu, Korea, which supervises animal research.
- Oral and intraperitoneal glucose tolerance test
- Oral glucose tolerance test (OGTT) was performed on normal mice. The mice were randomly divided into six groups of seven each: control, GTE, GTE+γ-PGA, GTE+1/2γ-PGA, GTE+1/3γ-PGA, and GTE+1/4γ-PGA. On the test days, GTE (900 mg/kg containing 90 mg EGCG/kg) and γ-PGA (90, 45, 22.5, and 11.25 mg/kg) were suspended in water and administered orally to fasted (12 hours) mice. Ninety minutes later, 2 g/kg glucose was given orally. The BGLs were measured in tail blood samples collected at 0, 15, 30, 60, 90, 120, and 180 minutes after glucose treatment. BGLs were measured using Glucocard Test Strip II (Arkray Inc., Kyoto, Japan). Intraperitoneal glucose tolerance test (IPGTT) was performed after the 4-week drug treatment in nondiabetic control and db/db mice. On test days, the animals were fasted for 12 hours and then given an intraperitoneal injection of glucose (500 mg/kg). BGLs were measured in tail blood samples at 0, 15, 30, 60, 90, 120, and 180 minutes after the glucose treatment.
- Collection of blood and internal organ samples
- At the conclusion of the study, animals were anaesthetized (nembutal, 100 mg/kg), and a 500-µL blood sample was drawn from the orbital venous plexus into a heparinized tube and immediately chilled on ice. The plasma was then separated and stored at -80℃ before analysis. After blood sampling, visceral adipose tissues (perirenal, retroperitoneal, and epididymal depots), liver, pancreas, and hypothalamus were dissected. The hypothalamus tissues were immediately frozen in liquid nitrogen and stored at -80℃ until measurement of mRNA levels by real-time reverse transcriptase-polymerase chain reaction (RT-PCR). Visceral adipose tissues were weighed and immediately frozen in liquid nitrogen. The liver and pancreas were fixed immediately in 10% neutral formalin solution and then embedded in paraffin.
- Biochemical profile
- Serum samples were obtained from blood by centrifugation for 15 minutes at 950 g at room temperature. Fasting glucose and insulin were measured using commercial kits (SpinReact, Gerona, Spain; Millipore, Billerica, MA, USA, respectively). The homeostasis model assessment of insulin resistance (HOMA-IR) was calculated using the final blood glucose and insulin levels in food-deprived mice.
- Real-time polymerase chain reaction analysis
- Each whole mouse hypothalamus was homogenized in TRI reagent (Sigma-Aldrich) using Ultra-Turrax T25 (IKA, Staufen, Germany). RNA was reverse transcribed to cDNA from 1 µg of total RNA using High-Capacity cDNA Reverse Transcription Kit (Applied Biosystems, Foster City, CA, USA). Quantitative real-time PCR was performed using Real-Time PCR 7500 System and Power SYBR Green PCR Master Mix (Applied Biosystems) according to the manufacturer's instructions. The expression level of glyceraldehyde 3-phosphate dehydrogenase (GAPDH) was used as an internal control. The reactions were incubated at 95℃ for 10 minutes, followed by 45 cycles of 95℃ for 15 seconds, 55℃ for 20 seconds, and 72℃ for 35 seconds. Primers for mouse neuropeptide Y (NPY) and GAPDH were based on NCBI's nucleotide database and designed using the Primer Express program (Applied Biosystems): mouse NPY (forward, 5'-TAT CCC TGC TCG TGT GTT TG-3'; reverse, 5'-GTT CTG GGG GCA TTT TCT G-3'), mouse GAPDH (forward, 5'-CAG GAT GAC ACC AAA ACC CTC-3'; reverse, 5'-TCC AAG CCA GTG ACC CTC TG-3').
- Liver and pancreas histopathology
- Embedded liver and pancreas tissue blocks were cut into 6-micron sections and stained with hematoxylin and eosin. Pancreas tissue blocks were stained with HRP conjugated anti-insulin antibody. Mounting medium and cover slips were placed on the slides, which were then left to dry overnight. A diagnosis of fatty liver was made based on the presence of macrovesicular or microvesicular fat in 0.5% of the hepatocytes in a given slide.
- Tissue lipid determination
- Samples of liver were homogenized in 0.25% sucrose containing 1 mM ethylenediaminetetraacetic acid. Lipids were extracted using chloroform/methanol methanol (2:1, v/v) and evaporated in Savant Speedvac Concentrator (Thermo Fisher Scientific Co., Waltham, MA, USA). Next, the pellets were dissolved in 5% fatty acid-free bovine serum albumin dissolved in water. Proteins in the homogenate were assayed using protein assay reagent (Bio-Rad, Hercules, CA, USA) to normalize the amount of lipid extracted. Tissue triglyceride levels were determined using kits from Roche Diagnostics.
- Statistical analysis
- The results are expressed as the mean±standard error. SPSS version 14.0 (SPSS Inc., Chicago, IL, USA) was used for statistical analyses. The area under the curve (AUC) was calculated using Microcal Origin software version 7.0 (Microcal Software, Northampton, MA, USA). Comparisons between the two groups were performed with Student two-tailed t-test. When comparing two or more groups, significance was tested using ANOVA with Bonferroni correction to deal with relatively small number of samples. P values of less than 0.05 were considered significant.
METHODS
- Effect of GTE+γ-PGA on OGTT in normal mice
- When glucose was loaded orally 90 minutes after each drug treatment, BGL significantly increased in GTE group compared to control (Fig. 1A and B), suggesting that GCs are already absorbed into the circulation where they inhibit cellular glucose uptake in various tissues. However, BGL of the GTE+γ-PGA groups were lower than the control group in γ-PGA-dose-dependent manner, suggesting that γ-PGA captures GCs in the alimentary tract, inhibiting glucose absorption. NMR measurement revealed possible interaction sites between γ-PGA and EGCG molecules through hydrogen bond and van der Waals interaction (Fig. 1C).
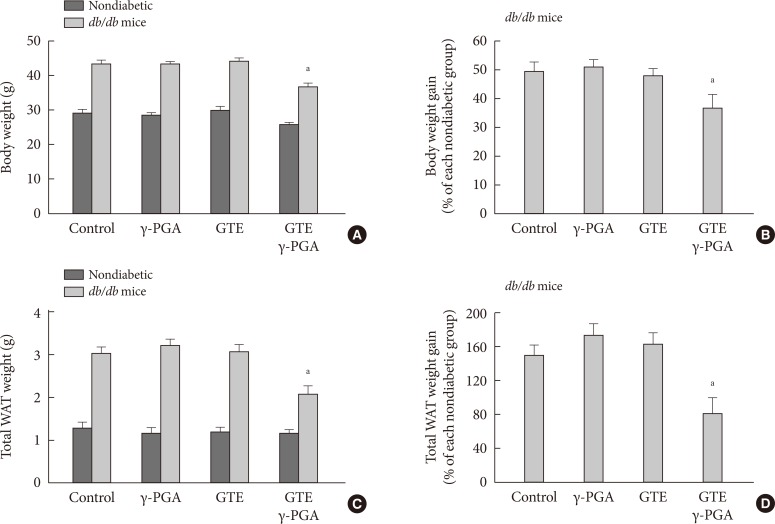
- Effect of GTE+γ-PGA on food intake, BW, and body fat in db/db mice
- There were no differences in BW, fed blood glucose, and daily food intake among the groups at the beginning of the experiment (data not shown). Obesity and diabetes were verified by evaluating BW and BGLs, respectively. The db/db mice with BGLs of 250 mg/dL or greater were considered as diabetic. After the 4-week drug treatment, the GTE+γ-PGA diet db/db mice showed approximately 15% less BW gain compared to control diet db/db mice (Fig. 2A and B). This was attributable to weight decreases in visceral adipose tissues containing perirenal, retroperitoneal and epididymal depots (Fig. 2C and D). However, GTE alone did not have any effect on BW or visceral fat contents. Daily food intake per cage did not differ among the groups (Table 1). Hypothalamic NPY, a typical orexigenic peptide [14,15], was also analyzed-there was no significant difference in basal hypothalamic NPY expression between the four groups of db/db mice after the drug treatment (Table 1).
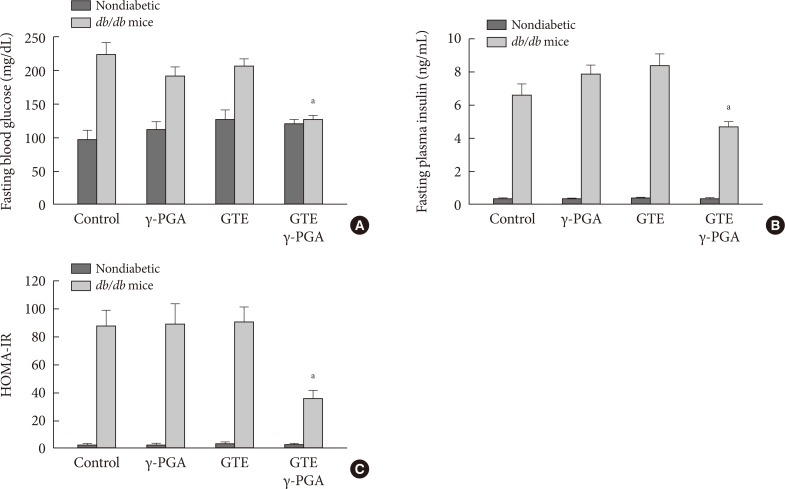
- Effect of GTE+γ-PGA on fasting blood glucose, fasting plasma insulin, and HOMA-IR index
- After 4 weeks of the drug treatments, overnight fasting blood glucose and insulin levels were significantly lower in the GTE+γ-PGA diet db/db mice compared to control diet db/db mice (Fig. 3A and B). Additionally, HOMA-IR, a marker of insulin resistance, was also lower in GTE+γ-PGA diet db/db mice compared to control diet db/db mice (Fig. 3C).
- Effect of GTE+γ-PGA on glucose tolerance
- Glucose tolerance in nondiabetic control (Fig. 4A) and db/db (Fig. 4B) mice was evaluated by IPGTT after 4 weeks of treatment. GTE+γ-PGA diet in db/db mice significantly ameliorated glucose intolerance compared to the control diet (Fig. 4B). The AUC describing the blood glucose of the GTE+γ-PGA db/db group was approximately 25% less (P<0.01) than that of the control group (Fig. 4C).
- Effect of GTE+γ-PGA on pancreas and liver pathology
- Histopathological analysis of the pancreas found db/db mice to have significantly increased islet size when compared to control nondiabetic heterozygous mice (Fig. 5A and B); however, islet size in the GTE+γ-PGA diet db/db mice was maintained at a relatively smaller size compared with the control diet db/db mice. Additionally, db/db mice had significantly increased liver size (relative to BW) compared to control nondiabetic heterozygous mice (data not shown). Histopathological analyses showed that these mice also had a significantly higher incidence of fatty liver, whereas GTE+γ-PGA diet db/db mice had reduced incidence of fatty liver compared to control diet db/db mice (Fig. 6A). Triglyceride content was significantly decreased in GTE+γ-PGA diet db/db mice compared to control diet db/db mice (Fig. 6B).
RESULTS
- The NMR results of this study have shown that γ-PGA can interact with EGCG, a major GC of GTE. This possible complex formation in the intestine may delay the absorption of GCs of GTE that ameliorate BW gain and glucose intolerance in db/db mice in the 4-week drug treatment. That the regimen was not effective in nondiabetic mice may indicate that it does not have significant side effects. GTE+γ-PGA treatment did not change food intake and hypothalamic NPY expression, suggesting that the drug does not act on the hypothalamic appetite center; rather, it reduced the uptake of calories from the intestine. In contrast to other therapeutic drugs inhibiting gastrointestinal absorption of glucose, such as α-glucosidase inhibitors, a novel advantage of GTE for reducing gastrointestinal calorie intake may be based on its inhibition of both glucose and cholesterol absorption. Therefore, GTE+γ-PGA regimen may be a good candidate for supportive prevention and treatment of both obesity and T2DM with relatively few side effects.
- This study has shown that the administration of GTE alone did not significantly ameliorate BW gain and glucose intolerance in a 4-week treatment at the tested concentrations. We have previously confirmed that GTE, when simultaneously administered with glucose, reduces postprandial glucose elevation [7], which is consistent with many other reports [8,16-18]. However, as shown in this study, the effect of GTE can be reversed when GTE is administered approximately 30 to 60 minutes before glucose loading, implying its ambivalent effects on BGLs depending upon the time between the administration of GTE and glucose [7]. In the present study, GTE was always supplied mixed with chow diet. Adverse effect of GTE on glucose intolerance may appear if GTE is given to animals between meals. In contrast to this study, EGCG given at higher concentrations could reduce food intake and BW even in normal rats by reducing appetite through the hypothalamus [19]. Various complications, however, were detected at such high concentrations of EGCG, one of which is antiandrogenic effect of EGCG [20].
- Intake of Korean chungkookjang and Japanese natto has long been known to be effective in reducing blood cholesterol levels and increasing insulin sensitivity and cellular antioxidant activity [21-25]. The main active components of chungkookjang and natto are thought to be isoflavones [26]. γ-PGA, another component of chungkookjang and natto, was also reported to have antioxidant activity [27]. Although some reports have discussed the capacity of high molecular weight γ-PGA (>2,000 KDa) to reduce BW and blood cholesterol levels in animals and humans [26,28], the present results do not provide antiobese and antidiabetic effects of γ-PGA alone (MW: 2,000 KDa) in db/db mice. The reason may be the difference in not only the molecular weight, but also the treatment duration with γ-PGA. The short duration of experiment of this study may not detect the full effect of γ-PGA. The effect of prolonged treatment with γ-PGA alone remains to be further determined.
- The beneficial effect of GTE+γ-PGA on glucose tolerance appears to result from lower BW gain and decreased body fat mass, a similar mechanism to α-glucosidase inhibitors [29]. Like α-glucosidase inhibitors, GTE+γ-PGA may cause gastrointestinal side effects, such as diarrhea and soft feces. However, GTE+γ-PGA can prevent the absorption of simple sugars by inhibiting glucose transport, while α-glucosidase is unable to do so. An additional benefit of GTE+γ-PGA may be the inhibition of cholesterol absorption from the alimentary tract [30]. GCs appear to be responsible for the inhibitory effect, primarily through the inhibition of mixed micelle formation in the intestinal lumen [30].
- In conclusion, this study has shown that GTE+γ-PGA treatment can significantly alleviate BW gain and the development of glucose intolerance in db/db mice, probably through the action of intestinal GTE. This combined treatment is much more effective than treatment with either GTE or γ-PGA alone. Therefore, a GTE+γ-PGA regimen may be a promising preventative and therapeutic candidate for obesity and obesity-related metabolic disorders, such as T2DM.
DISCUSSION
-
Acknowledgements
- This work was supported by iPET (Korea Institute of Planning and Evaluation for Technology in Food, Agriculture, Forestry and Fisheries), Ministry for Food, Agriculture, Forestry and Fisheries, Republic of Korea (Grant number 110135-3).
ACKNOWLEDGMENTS
- 1. Rossner S. Obesity: the disease of the twenty-first century. Int J Obes Relat Metab Disord 2002;26(Suppl 4):S2-S4. ArticlePubMedPDF
- 2. Mokdad AH, Bowman BA, Ford ES, Vinicor F, Marks JS, Koplan JP. The continuing epidemics of obesity and diabetes in the United States. JAMA 2001;286:1195-1200. ArticlePubMed
- 3. Kahn SE, Prigeon RL, McCulloch DK, Boyko EJ, Bergman RN, Schwartz MW, Neifing JL, Ward WK, Beard JC, Palmer JP. Quantification of the relationship between insulin sensitivity and beta-cell function in human subjects. Evidence for a hyperbolic function. Diabetes 1993;42:1663-1672. ArticlePubMed
- 4. Perley M, Kipnis DM. Plasma insulin responses to glucose and tolbutamide of normal weight and obese diabetic and nondiabetic subjects. Diabetes 1966;15:867-874. ArticlePubMedPDF
- 5. Polonsky KS, Given BD, Van Cauter E. Twenty-four-hour profiles and pulsatile patterns of insulin secretion in normal and obese subjects. J Clin Invest 1988;81:442-448. ArticlePubMedPMC
- 6. Kahn SE. Clinical review 135: the importance of beta-cell failure in the development and progression of type 2 diabetes. J Clin Endocrinol Metab 2001;86:4047-4058. PubMed
- 7. Park JH, Jin JY, Baek WK, Park SH, Sung HY, Kim YK, Lee J, Song DK. Ambivalent role of gallated catechins in glucose tolerance in humans: a novel insight into non-absorbable gallated catechin-derived inhibitors of glucose absorption. J Physiol Pharmacol 2009;60:101-109.
- 8. Kobayashi Y, Suzuki M, Satsu H, Arai S, Hara Y, Suzuki K, Miyamoto Y, Shimizu M. Green tea polyphenols inhibit the sodium-dependent glucose transporter of intestinal epithelial cells by a competitive mechanism. J Agric Food Chem 2000;48:5618-5623. ArticlePubMed
- 9. Mabe K, Yamada M, Oguni I, Takahashi T. In vitro and in vivo activities of tea catechins against Helicobacter pylori. Antimicrob Agents Chemother 1999;43:1788-1791. ArticlePubMedPMCPDF
- 10. Takabayashi F, Harada N, Yamada M, Murohisa B, Oguni I. Inhibitory effect of green tea catechins in combination with sucralfate on Helicobacter pylori infection in Mongolian gerbils. J Gastroenterol 2004;39:61-63. ArticlePubMedPDF
- 11. Hu R, He C, Liu J, Wu Y, Li J, Feng Z, Huang J, Xi XG, Wu Z. Effects of insulin-mimetic vanadyl-poly(gamma-glutamic acid) complex on diabetic rat model. J Pharm Sci 2010;99:3041-3047. PubMed
- 12. Karmaker S, Saha TK, Yoshikawa Y, Sakurai H. A Zinc(II)/poly(gamma-glutamic acid) complex as an oral therapeutic for the treatment of type-2 diabetic KKAy mice. Macromol Biosci 2009;9:279-286. ArticlePubMed
- 13. Karmaker S, Saha TK, Yoshikawa Y, Sakurai H. Amelioration of hyperglycemia and metabolic syndromes in type 2 diabetic KKA(y) mice by poly (gamma-glutamic acid) oxovanadium (IV) complex. ChemMedChem 2007;2:1607-1612. ArticlePubMed
- 14. Schwartz MW, Woods SC, Porte D Jr, Seeley RJ, Baskin DG. Central nervous system control of food intake. Nature 2000;404:661-671. ArticlePubMedPDF
- 15. Harrold JA. Hypothalamic control of energy balance. Curr Drug Targets 2004;5:207-219. ArticlePubMed
- 16. Johnston K, Sharp P, Clifford M, Morgan L. Dietary polyphenols decrease glucose uptake by human intestinal Caco-2 cells. FEBS Lett 2005;579:1653-1657. ArticlePubMed
- 17. Van Amelsvoort JM, Van Hof KH, Mathot JN, Mulder TP, Wiersma A, Tijburg LB. Plasma concentrations of individual tea catechins after a single oral dose in humans. Xenobiotica 2001;31:891-901. ArticlePubMed
- 18. Tsuneki H, Ishizuka M, Terasawa M, Wu JB, Sasaoka T, Kimura I. Effect of green tea on blood glucose levels and serum proteomic patterns in diabetic (db/db) mice and on glucose metabolism in healthy humans. BMC Pharmacol 2004;4:18ArticlePubMedPMC
- 19. Kao YH, Hiipakka RA, Liao S. Modulation of endocrine systems and food intake by green tea epigallocatechin gallate. Endocrinology 2000;141:980-987. ArticlePubMed
- 20. Naftalin RJ, Afzal I, Cunningham P, Halai M, Ross C, Salleh N, Milligan SR. Interactions of androgens, green tea catechins and the antiandrogen flutamide with the external glucose-binding site of the human erythrocyte glucose transporter GLUT1. Br J Pharmacol 2003;140:487-499. ArticlePubMedPMCPDF
- 21. Kim W, Choi K, Kim Y, Park H, Choi J, Lee Y, Oh H, Kwon I, Lee S. Purification and characterization of a fibrinolytic enzyme produced from Bacillus sp. strain CK 11-4 screened from Chungkook-Jang. Appl Environ Microbiol 1996;62:2482-2488. ArticlePubMedPMCPDF
- 22. Kwak CS, Lee MS, Park SC. Higher antioxidant properties of Chungkookjang, a fermented soybean paste, may be due to increased aglycone and malonylglycoside isoflavone during fermentation. Nutr Res 2007;27:719-727.Article
- 23. Kwon DY, Jang JS, Lee JE, Kim YS, Shin DH, Park S. The isoflavonoid aglycone-rich fractions of Chungkookjang, fermented unsalted soybeans, enhance insulin signaling and peroxisome proliferator-activated receptor-gamma activity in vitro. Biofactors 2006;26:245-258. ArticlePubMed
- 24. Kwon DY, Jang JS, Hong SM, Lee JE, Sung SR, Park HR, Park S. Long-term consumption of fermented soybean-derived Chungkookjang enhances insulinotropic action unlike soybeans in 90% pancreatectomized diabetic rats. Eur J Nutr 2007;46:44-52. ArticlePubMedPDF
- 25. Sung MH, Park C, Kim CJ, Poo H, Soda K, Ashiuchi M. Natural and edible biopolymer poly-gamma-glutamic acid: synthesis, production, and applications. Chem Rec 2005;5:352-366. PubMed
- 26. Park JH, Choi JC, Sung MH, Kang JH, Chang MJ. High molecular weight poly-gamma-glutamic acid regulates lipid metabolism in rats fed a high-fat diet and humans. J Microbiol Biotechnol 2011;21:766-775. ArticlePubMed
- 27. Casscells W, Naghavi M, Willerson JT. Vulnerable atherosclerotic plaque: a multifocal disease. Circulation 2003;107:2072-2075. ArticlePubMed
- 28. Lee H, Chang MJ, Kim SH. Effects of poly-gamma-glutamic acid on serum and brain concentrations of glutamate and GABA in diet-induced obese rats. Nutr Res Pract 2010;4:23-29. ArticlePubMedPMC
- 29. Negishi M, Shimomura K, Proks P, Shimomura Y, Mori M. Alpha glucosidase inhibitor voglibose can prevent pioglitazone-induced body weight gain in type 2 diabetic patients. Br J Clin Pharmacol 2008;66:318-319. ArticlePubMedPMC
- 30. Raederstorff DG, Schlachter MF, Elste V, Weber P. Effect of EGCG on lipid absorption and plasma lipid levels in rats. J Nutr Biochem 2003;14:326-332. ArticlePubMed
REFERENCES
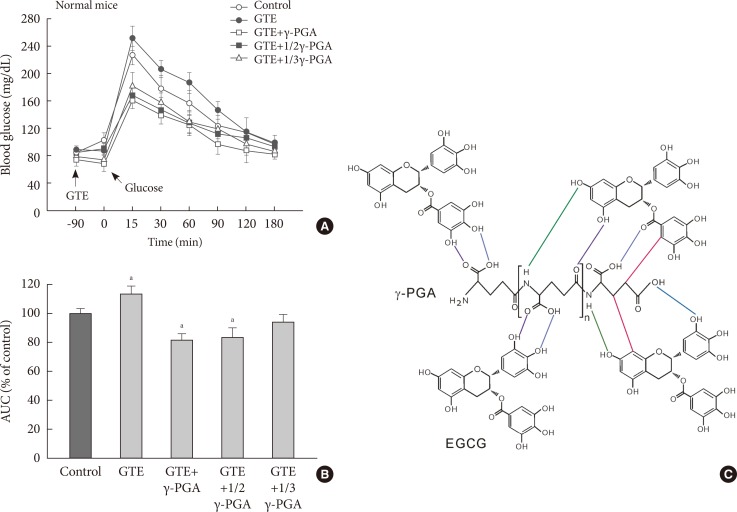


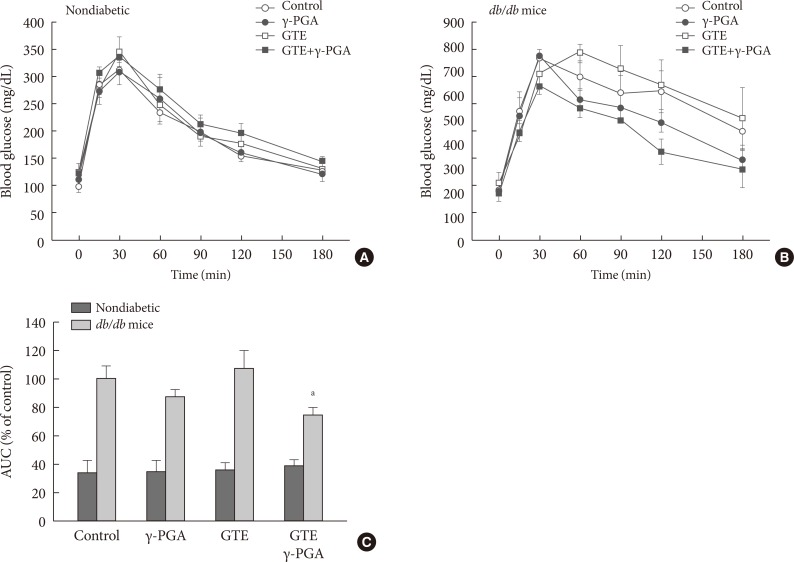
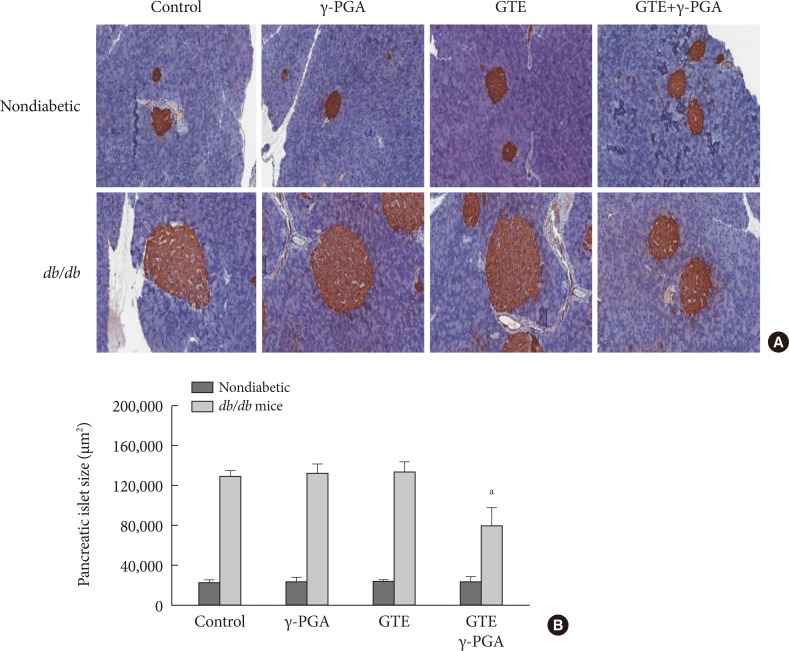
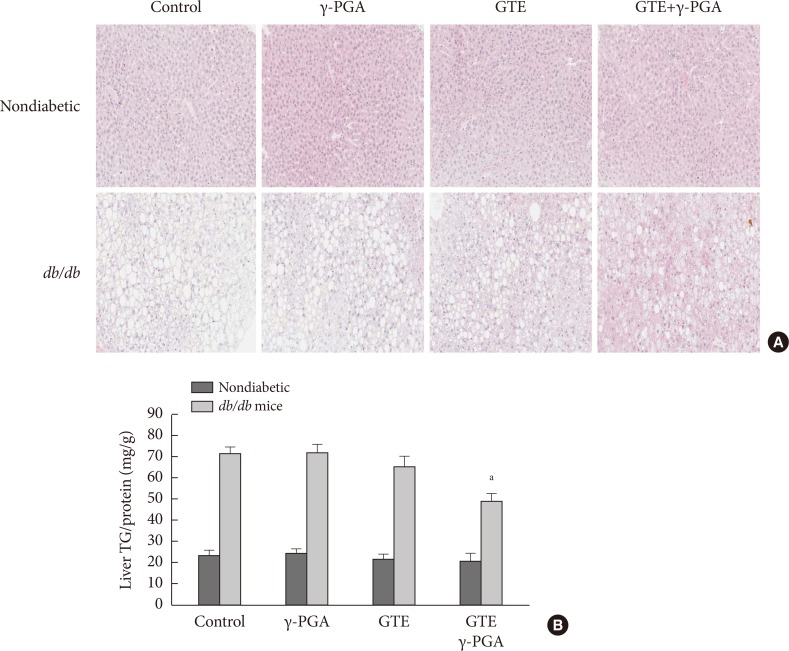

Figure & Data
References
Citations
- Preparation of Type-A Gelatin/Poly-γ-Glutamic Acid Nanoparticles for Enhancing the Stability and Bioavailability of (-)-Epigallocatechin Gallate
Weijie Zhang, Huangchen Shen, Ying Li, Kai Yang, Peng Lei, Yian Gu, Liang Sun, Hong Xu, Rui Wang
Foods.2023; 12(9): 1748. CrossRef - γ-PGA-Rich Chungkookjang, Short-Term Fermented Soybeans: Prevents Memory Impairment by Modulating Brain Insulin Sensitivity, Neuro-Inflammation, and the Gut–Microbiome–Brain Axis
Do-Youn Jeong, Myeong Seon Ryu, Hee-Jong Yang, Sunmin Park
Foods.2021; 10(2): 221. CrossRef - Anti-inflammatory activities of green tea catechins along the gut–liver axis in nonalcoholic fatty liver disease: lessons learned from preclinical and human studies
Joanna K. Hodges, Geoffrey Y. Sasaki, Richard S. Bruno
The Journal of Nutritional Biochemistry.2020; 85: 108478. CrossRef - Role of PCK1 gene on oil tea-induced glucose homeostasis and type 2 diabetes: an animal experiment and a case-control study
Qiantu Hu, Huafeng Chen, Yanli Zuo, Qin He, Xuan He, Steve Simpson, Wei Huang, Hui Yang, Haiying Zhang, Rui Lin
Nutrition & Metabolism.2019;[Epub] CrossRef - Oil tea improves glucose and lipid levels and alters gut microbiota in type 2 diabetic mice
Rui Lin, Xuan He, Huafeng Chen, Qin He, Ziting Yao, Yuanfan Li, Hui Yang, Steve Simpson
Nutrition Research.2018; 57: 67. CrossRef - Isomalto-oligosaccharides, a prebiotic, functionally augment green tea effects against high fat diet-induced metabolic alterations via preventing gut dysbacteriosis in mice
Dhirendra Pratap Singh, Jagdeep Singh, Ravneet Kaur Boparai, JianHua Zhu, Shrikant Mantri, Pragyanshu Khare, Romesh Khardori, Kanthi Kiran Kondepudi, Kanwaljit Chopra, Mahendra Bishnoi
Pharmacological Research.2017; 123: 103. CrossRef - Hypoglycemic, Hypolipidemic and Antioxidant Effects of Peptides from Red Deer Antlers in Streptozotocin-Induced Diabetic Mice
Ning Jiang, Shuangjian Zhang, Jing Zhu, Jing Shang, Xiangdong Gao
The Tohoku Journal of Experimental Medicine.2015; 236(1): 71. CrossRef - Coffee but not green tea consumption is associated with prevalence and severity of hepatic steatosis: the impact on leptin level
T Imatoh, S Kamimura, M Miyazaki
European Journal of Clinical Nutrition.2015; 69(9): 1023. CrossRef - Green tea and type 2 diabetes
Jae-Hyung Park, Jae-Hoon Bae, Sung-Soon Im, Dae-Kyu Song
Integrative Medicine Research.2014; 3(1): 4. CrossRef - The Effects of Green Tea on Obesity and Type 2 Diabetes
Hyun Min Kim, Jaetaek Kim
Diabetes & Metabolism Journal.2013; 37(3): 173. CrossRef
 PubReader
 Cite
Cite