Importance of Awareness and Treatment for Diabetes in Influenza Vaccination Coverage of Diabetic Patients under 65 Years: A Population-Based Study
Article information

Abstract
Background
Influenza is a global public health problem causing considerable morbidity and mortality. Although vaccination is the most effective way to prevent infection, vaccination coverage is insufficient in people with chronic disease under 65 years, especially diabetes. The purpose of this study was to evaluate influenza vaccination coverage and identify factors associated with influenza vaccination in Korean diabetic adults under 65 years.
Methods
Data were obtained from 24,821 subjects in the Korea National Health and Nutrition Examination Survey (2014 to 2017). Socioeconomic, health-related, and diabetic factors were investigated for their relations with influenza vaccination in diabetic patients under 65 years using univariate and multivariate analyses.
Results
Among 24,821 subjects, 1,185 were diabetic patients under 65 years and their influenza vaccination rate was 36.5%. Socioeconomic (older age, female gender, non-smoker, light alcohol drinker, lower educational level, and employed status), health-related factors (lower fasting glucose and glycosylated hemoglobin level, good self-perceived health status, more comorbidities, recent health screening, more outpatient visits, and diet therapy), and diabetic factors (more awareness and getting treated) were associated with influenza vaccination. In multivariate analysis, more awareness and getting treated for diabetes were associated with influenza vaccination in diabetic patients under 65 years (odds ratio, 1.496 and 1.413; 95% confidence interval, 1.022 to 2.188 and 1.018 to 2.054, respectively).
Conclusion
Influenza vaccination rate was low in diabetic patients under 65 years, especially in those with unawareness and not getting treated for diabetes. Active screening and treatment for diabetes may be helpful to improve the influenza vaccination rate in these patients.
INTRODUCTION
Diabetes is a common chronic disease with multiple complications that contribute to global health-care burden [1]. According to the 2016 World Health Organization (WHO) report, it was found from 422 million people, about 8.5% of the adult population in the world [2]. It is well known that glycemic control is important in mortality of diabetes [345]. In addition to glycemic control, another factor that influences the mortality of diabetes is infection [67]. Patients with diabetes have higher incidence of infectious diseases than healthy adults. Once an infectious disease occurs, it can progress to more severe illness. Hyperglycemia raises the risk of infectious diseases by causing neutrophil dysfunction, decreased antioxidant function, and decreased humoral immune function [8]. Patients with long duration of diabetes are accompanied by chronic diseases of various organs due to peripheral neuropathy or vascular complications that can also increase the risk of infectious disease. A study conducted in Canada found that diabetics had 1.21 times higher incidence of infectious diseases, especially skin soft tissue infections, genitourinary tract infections, gastrointestinal tract infections, and respiratory infections, than those without diabetes [9]. In a study conducted in the United Kingdom, the incidence of infectious diseases was 1.66 times higher in type 1 diabetes mellitus and 1.47 times higher in type 2 diabetes mellitus [10]. Therefore, those with diabetes need to take optimal measures to prevent infectious diseases. Among infectious diseases, influenza is a disease that can be prevented through vaccination. Influenza is a disease that spreads every year, causing high morbidity and mortality. About 3 to 5 million people are affected and about 250,000 to 300,000 people die from it [10]. The most effective method for preventing influenza is vaccination [11]. Influenza vaccination not only prevents the development of influenza itself in diabetic patients, but also reduces the incidence of complications such as influenza-related pneumonia. It can significantly reduce the risk of hospitalization or death [121314]. Therefore, American Diabetic Association recommends that adults with diabetes should receive the influenza vaccine every year [15]. Also, WHO and United States Centers for Disease Control recommend annual influenza vaccination to high-risk groups such as pregnant women, children of 6 months to 5 years old, seniors over 65 years, patients with chronic disease including diabetes, and health-care workers [1016]. The WHO has set a target of 75% for influenza vaccination rates in the high-risk groups [17]. Regarding the actual influenza vaccination rate in high-risk groups, influenza vaccination rates of people over 65 years in Korea, the United States, Canada, the United Kingdom, and so on, in which governments provide financial supports for influenza vaccination, was about to 60% to 80% [18]. However, the vaccination rate is much lower in patients with chronic disease under 65 years who also belong to the high-risk groups, and this is not different in diabetes [192021]. In other words, in order to maximize vaccination rate in high-risk groups, it is important to identify factors that significantly affect the vaccination rate in chronic disease patients under 65 years, not the elderly over 65 years. Therefore, the objective of this study was to find factors that could significantly affect influenza vaccination rate in patients under 65 years who had diabetes, one of representative chronic diseases.
METHODS
Study population
We used data from the Korean National Health and Nutrition Survey (KNHANES), a nation-wide population-based cross-sectional survey. This survey has been conducted in six phases: KNHANES phases I (1998), II (2001), III (2005), IV (2007 to 2009), V (2010 to 2012), VI (2013 to 2015), and VII (2016 to 2017) [22]. For our study, data from 2014 to 2017 (KNHANES VI, VII) were included. The KNHANES consists of several surveys about health and nutritional status. This survey used a stratified multi-stage sampling method to represent Korean adult population. Trained interviewer conducted annual face-to-face interviews across the nation to gather information about health and nutritional status. Informed consents were taken to every participant before inclusion to studies. The initial sample for this study consisted of 31,207 candidates completing the surveys. Of these, we excluded subjects under the age of 19 years (n=6,386), those who give no information about influenza vaccination or had missing data (n=174), and those who had no diabetes (n=22,280). Finally, a total of 2,367 subjects were included in the analysis. This study was approved by the Institutional Review Board of the Korea Centers for Disease Control (approval number: VC20ZISI0004).
Study variables
Influenza vaccination coverage was measured with the following question: “During the past 12 months, have you been vaccinated against influenza?” Those who answered “yes” were defined as being vaccinated. The diagnosis of diabetes was based on fasting plasma glucose (FPG) ≥126 mg/dL, current use of antidiabetic medication, a previous history of diabetes, or glycosylated hemoglobin (HbA1c) ≥6.5%. Anthropometric, socioeconomic, health-related, psychological, and treatment variables were included in the analysis. Anthropometric variables included height (cm) and weight (kg) measured to the nearest 0.1 cm and 0.1 kg by a trained examiner. Body mass index (BMI) was calculated by dividing weight (kg) by the square of height (m2). Socioeconomic variables included gender, age, monthly income (in quartile), educational level (elementary or lower, middle, high, college, or higher), occupation (employed or unemployed), and residency area (urban or rural). Monthly income was calculated as an equivalent income, dividing monthly income into square root of family size. Health-related variables included smoking and alcohol drinking status, FPG, HbA1c, regular exercise, self-reported health status, comorbidity, a history of health screening in the past 2 years, number of outpatient visit in recent 2 weeks, diet therapy, and treatments. Smoking status was classified into three groups: never smoker, ex-smoker, and current smoker. Those who had smoked more than five packs in a lifetime were defined as smokers. Exsmokers were distinguished from current smokers based on their present smoking status. Subjects who ceased smoking at the survey time were considered as ex-smokers regardless of the duration of smoking cessation. Alcohol drinking status was classified into three groups: never, mild to moderate, and heavy drinker according to daily alcohol consumption at the survey time. Never drinker was defined as individuals consuming on one or less occasion per month. Mild to moderate drinker was defined as individuals drinking below 30 g of alcohol per day. Heavy drinker was defined as individuals drinking more than 30 g of alcohol per day. For biochemical measurements, FPG and HbA1c levels were measured by high-performance liquid chromatography on a Tosoh G8 device (Tosoh, Tokyo, Japan). Regular exercise was defined as exercising more than three times a week for more than 30 minutes each time. Self-perceived health status was classified into three levels (good, fair, and poor) according to response to the following question: “How do you assess your own health status?” The presence of comorbidities was determined by asking respondents if they were ever diagnosed or treated with the followings: cerebrovascular disease, angina, myocardial infarction, asthma, hypertension, dyslipidemia, chronic liver disease (hepatitis B and C, liver cirrhosis), chronic renal disease, or any cancer. Diet therapy was defined as dietary control, including daily diet, for glycemic control. Treatments variables for diabetes included lifestyle modification, insulin therapy, and oral medication. Diabetic variables were classified into three variables: awareness, treatment, and control rates. Awareness rate was defined as rate of people diagnosed with diabetes by a doctor among people diagnosed with diabetes [2324]. Treatment rate was defined as rate of people treated with oral hypoglycemic agents or insulin therapy among people diagnosed with diabetes. Control rate in diabetes was defined as rate of people with HbA1c <6.5% among people diagnosed with diabetes.
Statistical analysis
General characteristics according to influenza vaccination or diabetes status are presented as percentages (standard errors [SE]) and as mean±SE for quantitative variables. To perform group comparisons, Chi-square test and t-test were used for categorical and continuous data, respectively. Both univariate and multiple logistic regression analyses were used to evaluate variables as factors related to influenza vaccination. In multiple logistic regression analyses, socioeconomic factors (age, sex, education level, household income, and employed status) and health-related factors (smoking and alcohol drinking status, health screening within past 2 years, number of outpatient visit in recent 2 weeks, FPG, HbA1c, self-perceived health status, and diet therapy) were adjusted for. Odds ratios (ORs) and 95% confidence intervals (CIs) for influenza vaccination coverage were calculated according to combinations of those factors. All statistical analyses were conducted using SAS version 9.2 for Windows (SAS Institute Inc., Cary, NC, USA).
RESULTS
Clinical characteristics and vaccination coverage
Table 1 presents clinical characteristics of the study population (2,367 with diabetes and 22,280 without diabetes). Compared to the non-diabetic group, the diabetic group showed older mean age, higher proportions of elderly individuals (over 65 years) and men, higher BMI, higher rate of smoking and alcohol history, lower levels of education and household income, higher proportion of unemployed responders, and higher percentage of rural residents. In health-related factors, diabetic group had higher FPG and HbA1c levels, lower proportions of individuals with aerobic exercise and good self-perceived health status, higher comorbidity prevalence (hypertension, dyslipidemia cerebrovascular attack, coronary artery disease, chronic liver disease, and cancer), higher proportion of individuals who received health screening within past 2 years, more outpatient visits in recent 2 weeks, and higher proportion of diet therapy. Influenza vaccination rate was 52.9% in the diabetic group and 34% in the non-diabetic group.
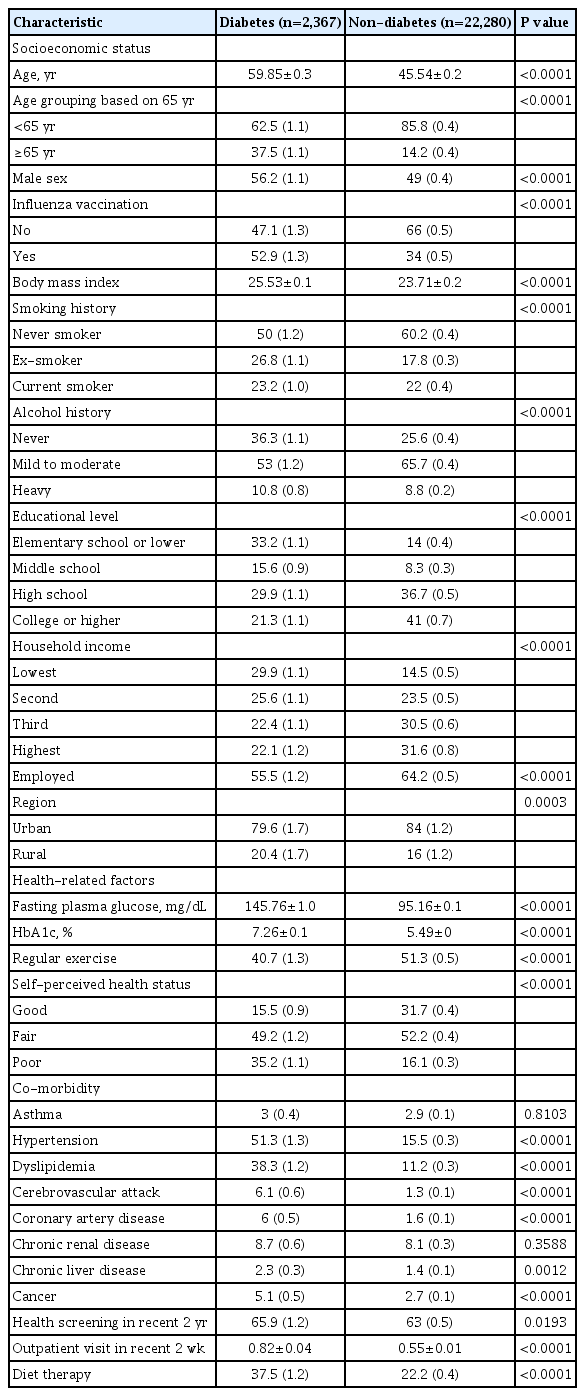
Clinical characteristics of study populations
Clinical characteristics according to influenza vaccination in diabetic patients based on 65 years
Comparison of clinical characteristics according to influenza vaccination in diabetic patients based on 65 years is shown in Table 2. In the diabetic group, vaccination rate was 36.5% in those under 65 years and 85% in those over 65 years. In the diabetic group under 65 years, mean age was significantly higher in vaccinated group than that in the unvaccinated group. In the diabetic group under 65 years, the vaccination rate was higher in women, subjects with lower smoking and drinking level, subjects with lower educational level, and unemployed state. Vaccinated group in diabetic patients under 65 years showed significantly lower fasting blood glucose and HbA1c level, poor self-perceived health status, higher proportions of individuals with comorbidity (hypertension, dyslipidemia, coronary artery disease, and chronic renal disease), more health screenings within past 2 years, more outpatient visits in recent 2 weeks, and higher proportions of individuals with diet therapy than unvaccinated group in diabetic patients under 65 years. In the diabetic group over 65 years, the vaccinated group showed older age and high proportions of women and lower smoking history than the unvaccinated group. Trends of vaccination rate by age groups in diabetic and non-diabetic group are displayed in Fig. 1. Results of comparison of diabetic variables according to influenza vaccination in diabetic patients based on 65 years are presented in Table 3. In diabetic patients under 65 years, the vaccinated group had significantly higher awareness and treatment rate than the unvaccinated group. In diabetic patients over 65 years, such differences between vaccinated and unvaccinated groups were not observed. There was no significant difference in control rate between vaccinated and unvaccinated groups in diabetic patients both age below 65 and more than 65 years.
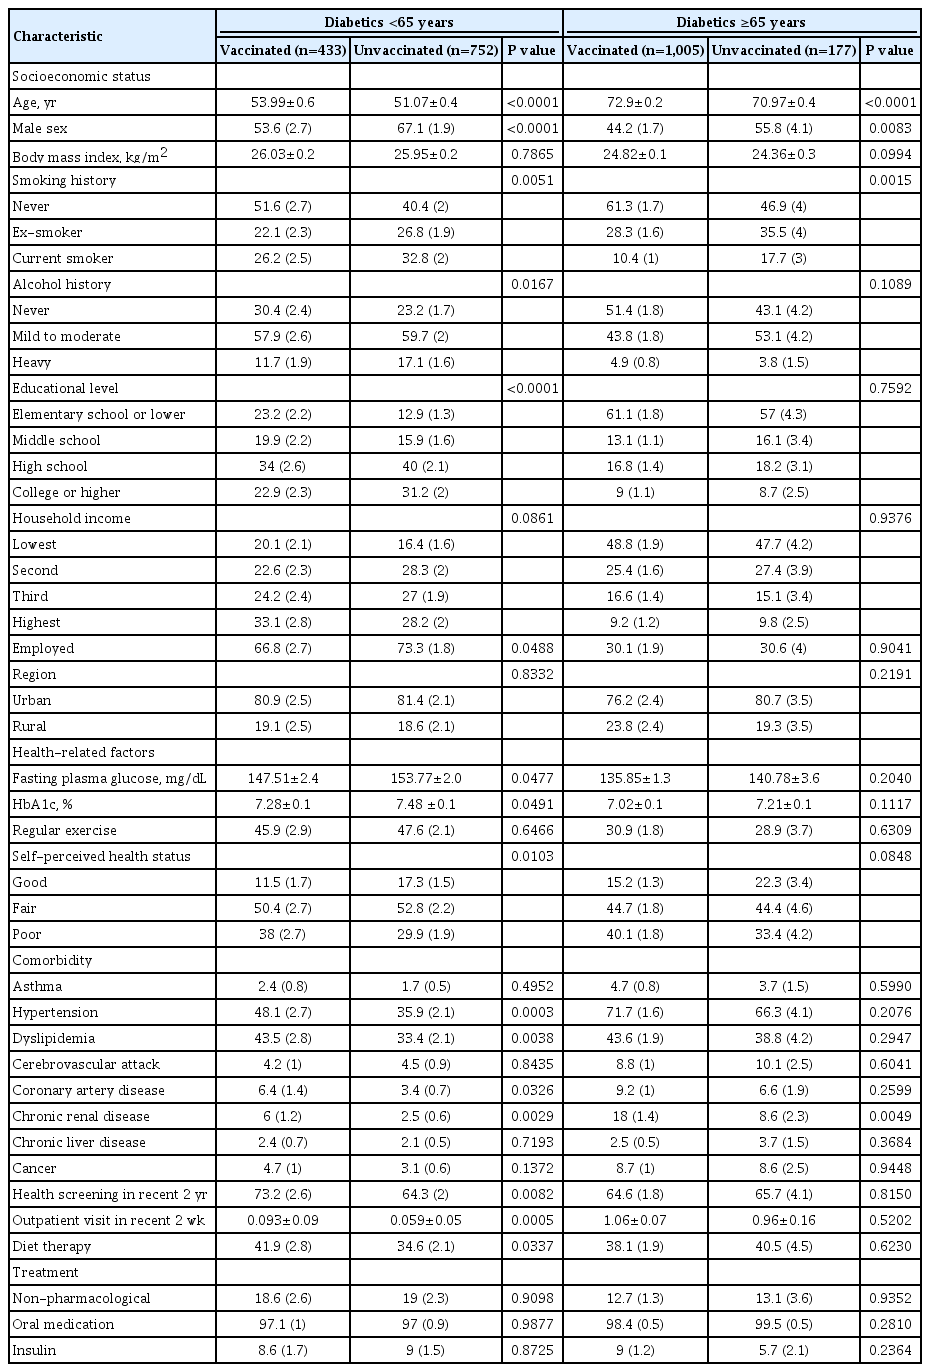
Comparison of clinical characteristics according to influenza vaccination in diabetic patients based on 65 years
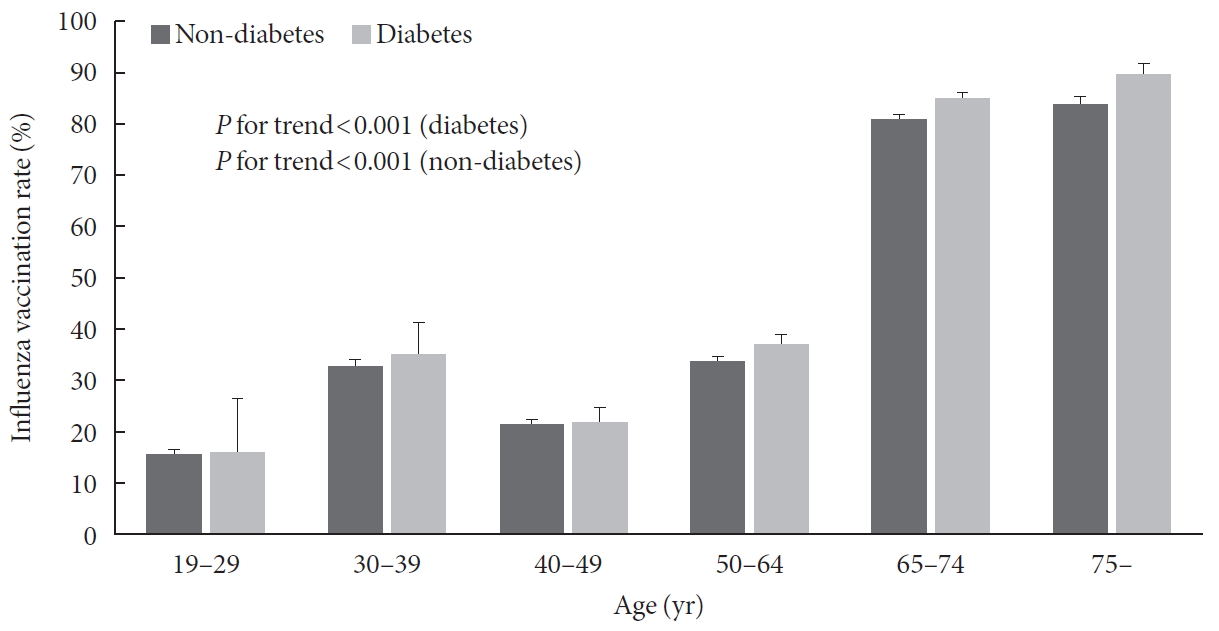
Influenza vaccination coverage rate by age groups in diabetic and non-diabetic groups.
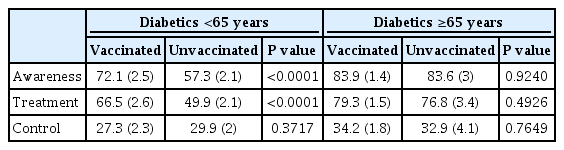
Comparison of diabetic factors according to influenza vaccination in diabetic patients based on 65 years
Factors associated with influenza vaccination rate in diabetic patients below 65 years and more than 65 years
In multivariate logistic regression analysis, more awareness and getting treated for diabetes were significantly associated with influenza vaccination in diabetic patients under 65 years. There was no association between treatment and control rate of diabetes and influenza vaccination in diabetic patients under 65 years. On the other hand, diabetic patients over 65 years showed no factors associated with influenza vaccination (Table 4).
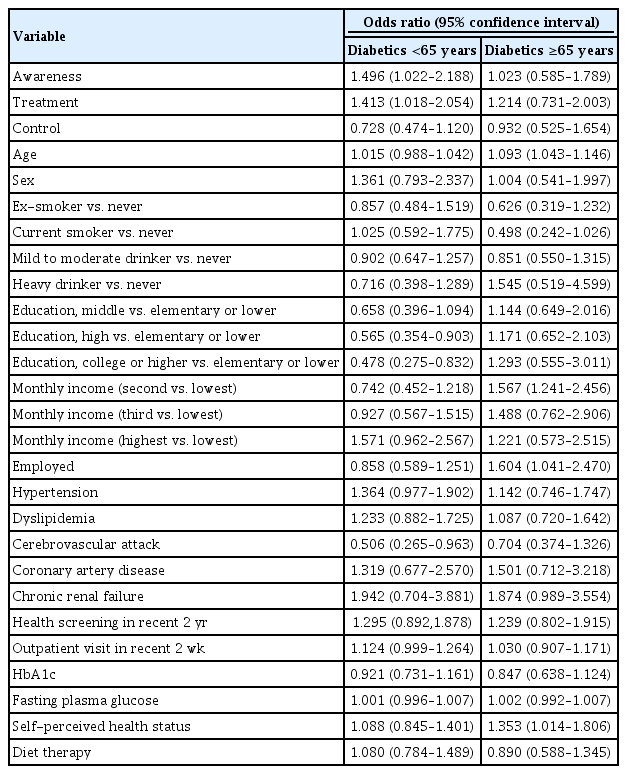
Multivariate logistic regression analysis for influenza vaccination in diabetic patients based on 65 years
DISCUSSION
Influenza vaccination is important to reduce morbidity and mortality of diabetic patients [1213]. In our study, the influenza vaccination rate was 85% in diabetic patients over 65 years. However, in diabetic patients under 65 years, the influenza vaccination rate was 35.4%, which was considerably lower than desired when considering the target of the WHO in the influenza vaccination was 75%. This difference of influenza vaccination rate was also identified in a previous study (78.7% in diabetics over 65 years; 34.3% in diabetics under 65 years) [25]. In other words, there is a significant gap in influenza vaccination rate between diabetic patients under 65 years and over 65 years. Reducing such gap might contribute to the reduction of morbidity and mortality in all diabetic patients. In order to reduce this gap, it is important to increase influenza vaccination rate of diabetic patients under 65 years and investigate clinical features related to influenza vaccination in diabetic patients under 65 years.
Our study showed that awareness and treatment rates of diabetes in diabetic patients under 65 years were significant factors associated with influenza vaccination. Awareness and treatment rates of diabetes have long been known as important factors for reducing overall mortality and complications of diabetes. According to a study by the American Medical Care System, the onset of diabetes on average is up to 10 to 12 years before clinical diagnosis [26]. Complications such as diabetic retinopathy and diabetic neuropathy are commonly found at the time of diagnosis. Cardiovascular diseases such as peripheral arterial disease and coronary heart disease are co-diagnosed in many cases [27]. In addition, overall mortality in diabetic patients is associated with these complications and comorbidities [28]. Therefore, early diagnosis and treatment is very important to prevent complications and comorbidities of diabetes and reduce overall mortality. Our study found that awareness and treatment rates of diabetes were related to influenza vaccination as well as overall mortality and comorbidity of diabetes. This is a different result from several previous studies. In a nation-wide cross-sectional study, Shin et al. [25] have reported that socioeconomic factors (older age, higher family income, and medical aid insurance) and health-related factors (lack of risky alcohol consumption, obesity, and recent health screening) can affect influenza vaccination in diabetic patients under 65 years. One United States study has reported that there are significant differences in influenza vaccination according to race of patients with diabetes [29]. Studies in other chronic diseases than diabetes have also reported that socioeconomic factors and health-related factors are significant factors associated with influenza vaccination [30313233]. However, results of the present study showed that awareness and treatment rates of diabetes, not socioeconomic factors or health-related factors, were significant factors affecting influenza vaccination in diabetic patients under 65 years. This means that both awareness and treatment of diabetes are more important for influenza vaccination than individual socioeconomic situation or health behavior in diabetic patients under 65 years. These results correspond to other previous studies. One study has shown that awareness of diabetes can lead to significantly higher odds of influenza vaccination than non-awareness [34]. Another study has shown that although awareness and treatment rate of diabetes are close to 70% in diabetic patients over 65 years old, they are much lower in the group under 65 years, especially in men than in women [23]. In other words, low awareness of diabetes in diabetic patients of relatively younger age can lead to low treatment rate and low influenza vaccination rate. Those who are unaware of diabetes are less likely to visit a hospital and receive treatment. Since they are not exposed to health information, they are less likely to be vaccinated. This appears only in diabetic patients under 65 years. Influenza vaccination rate was higher than 80% in the group over 65 years with or without diabetes. In diabetic patients over 65 years, there was no significant association between influenza vaccination and awareness rate for diabetes. This is because influenza vaccine is given to people over 65 years free of charge under the government policy in Korea.
Although multivariate analysis in our study confirmed that awareness and treatment rates of diabetes was significantly associated with influenza vaccination in diabetic patients under 65 years, univariate analysis results were similar to those of previous studies. Influenza vaccination rate was higher in women aged both under 65 years and older than 65 years, as shown in previous studies [2535]. In general, females have a tendency to prefer healthy lifestyle. Thus, they have higher probability to get health information and take preventive action like vaccination than males [3637]. However, other previous studies have shown higher vaccination rates in males [3839]. Thus, further research is needed to clarify this. Smoking and drinking rates were lower in the vaccinated group than those in the unvaccinated group. Rates of health screening within the past 2 years, comorbidities, numbers of outpatient visits in recent 2 weeks, and diet therapy were also higher in the vaccinated group. FPG and HbA1c levels in the vaccinated group were lower than those in the unvaccinated group. These factors might be associated with influenza vaccination in that they reflect health-related behavior. In other words, patients with more comorbidities and outpatient visits will visit hospitals more often and see doctors more often, thereby receiving more information and recommendations on influenza vaccination. In addition, because they exhibit more concern about their health, they are more likely to have health-related behaviors such as non-drinking, quitting smoking, health screening, diet, etc., leading to better glycemic control. These health-related behaviors are considered to be ultimately related to preventive measures such as influenza vaccination. Association between educational level and influenza vaccination varies from study to study. In previous studies in United States, Poland, and Austria, those with high educational level show high vaccination coverage [404142]. However, those with high educational level show low vaccination coverage in studies conducted in China, Spain, and Italy [4344]. Studies in Korea have reported that those with low educational level show high vaccination coverage [1930454647]. In line with these studies in Korea, educational level shows a negative association with vaccination in our study. Our study also found higher employment rates in the unvaccinated group. In other words, higher education level leads to higher employment rate and being busy and lack of time to get vaccinated are among reasons why people do not get vaccinated. In the case of unemployed people, time available for vaccination is the possible reason for their high vaccination coverage. A recent study in Korea has shown that those with low educational level think themselves as unhealthy that they are more likely to be vaccinated [30]. Our study also showed that self-perceived health-status was poorer in the vaccinated group, consistent with the above finding. Also, a Spain study has shown that those with high educational level are more hesitant to have vaccination as they tend to criticize vaccination recommendation from government and find alternatives [43].
The current study has several limitations. First, the survey examined whether participants were vaccinated last year. This could not reflect recent changes in their current circumstances. Second, data about influenza vaccination were obtained from subjects' own reports. This is a possibility to cause recall bias. Third, the vaccinations were investigated last year only, so we could not include the previous vaccination history. Finally, this study was inevitably performed with cross-sectional design because of retrospective analysis of established data set. Thus, it is difficulty to validate the causality. However, our study had several strengths. Our data were taken from a nation-wide survey sample showing high response rate. In addition, a wide range of data which could surmount potential confounding factors was available. Moreover, our data were collected from a sample of big size, which could augment the accuracy of our results and tolerate various statistical adjustments. Furthermore, this is the first study to report that awareness and treatment rates of diabetes are related to influenza vaccination in diabetic patients under 65 years.
In conclusion, awareness and treatment rates of diabetes in patients under 65 years were significantly associated with influenza vaccination. This suggests that it is more important to be aware of diabetes and receive consistent treatment rather than how well diabetes is controlled to increase influenza vaccination rate in patients with diabetics under 65 years. Further, it is also important to increase active screening and treatment adherence for diabetes to increase influenza vaccination rate. In addition, vaccination rate might be increased by expanding free vaccination, even for patients with diabetics younger than 65 years. Although further study on cost-effectiveness of this strategy must be made in the future, our study may be the basis for establishing a national policy on free vaccination for influenza in diabetic patients.
Notes
CONFLICTS OF INTEREST
No potential conflict of interest relevant to this article was reported.
AUTHOR CONTRIBUTIONS
Conception or design: S.H.K., K.H., S.K.K.
Acquisition, analysis, or interpretation of data: K.H., Y.M.P., J.Y.C., S.Y.K.
Drafting the work or revising: Y.M.K., K.S.K., S.H.K., C.H.K.
Final approval of the manuscript: Y.M.K., S.H.K., K.H., Y.M.P., J.Y.C., S.Y.K., S.H.S., C.H.K., S.K.K.
FUNDING
This research was supported by a grant (HI18C0275) of the Korea Health Technology R&D Project through the Korea Health Industry Development Institute (KHIDI) funded by the Ministry of Health and Welfare, Republic of Korea.
ACKNOWLEDGMENTS
None
References
Article information Continued
Notes
Highlights
• Influenza is a global public health problem causing considerable morbidity and mortality.
• Although vaccination is the most effective way to prevent infection, vaccination coverage is insufficient in people with chronic disease under 65 years, especially diabetes.
• Influenza vaccination rate was low (36.5%) in diabetic patients under 65 years, especially in those with unawareness and not getting treated for diabetes.
• Active screening and treatment for diabetes may be helpful to improve the influenza vaccination rate in these patients.