Effects of High Performance Inulin Supplementation on Glycemic Control and Antioxidant Status in Women with Type 2 Diabetes
Article information
Abstract
Background
The purpose of this study was to evaluate the effects of high performance inulin supplementation on blood glycemic control and antioxidant status in women with type 2 diabetes.
Methods
In a randomized, triple-blind controlled trial, 49 females (fiber intake <30 g/day, 25<body mass index <35 kg/m2) with type 2 diabetes were recruited from the Iran Diabetes Society and from endocrinology and metabolism clinics associated with the Tabriz University of Medical Science. The participants were divided into one of two groups in which the participants either received 10 g/day of inulin (intervention, n=24) or maltodextrin (control, n=25) for 2 months. Fasting blood samples were obtained and both glycemic control and antioxidant status were determined at baseline and at the end of the study.
Results
At the end of the study period, there were significant decreases in fasting plasma glucose (8.47%), glycosylated hemoglobin (10.43%), and malondialdehyde (37.21%) levels and significant increases in total antioxidant capacity (18.82%) and superoxide dismutase activity (4.36%) in the inulin group when compared to the maltodextrin group (P<0.05). Changes in fasting insulin, homeostasis model assessment of insulin resistance, and catalase activity were not significant in the inulin group when compared with the maltodextrin group. Glutathione peroxidase activity remained unchanged in both groups.
Conclusion
Inulin supplementation may improve some glycemic and antioxidant indices and decrease malondialdehyde levels in women with type 2 diabetes. Further investigations are needed in order to confirm the positive effects that inulin may have on the glycemic and antioxidant indices of patients with type 2 diabetes.
INTRODUCTION
Diabetes mellitus (DM) is a common health problem and is the main cause of morbidity in developing and developed countries. The number of people with diabetes is gradually increasing, and its prevalence was reported to be 171 million people in 2000. It is estimated that at least 366 million people will suffer from DM by the year 2030 [1]. In 2010, the prevalence of DM was 8% and its health expenditure was equal to 600 million U.S. dollars in the country of Iran [2]. DM is a metabolic disease that is characterized by the existence of hyperglycemia along with having biochemical alterations of glucose, lipid profile, lipid peroxidation, insulin resistance and β-cell dysfunction [3]. Prolonged exposure to hyperglycemia causes oxidative stress and an imbalance of the oxidant/antioxidant status. Oxidative stress has been suggested to play a key role in the pathophysiology of type 2 diabetes and its complications [4].
Nowadays, functional foods are of interest due to their potential health benefits [5]. The potential consequence of oxidative stress could be attenuated by the dietary consumption of functional foods. Inulin-type fructans, a well-defined type of functional foods, are naturally found in vegetables and fruits such as: onions, garlic, chicory root, banana, and wheat, and are used as prebiotic and dietary fiber in various food items. Inulin-type fructans are indigestible carbohydrates, contain fructose monomers that are linked by β (1→2) bounds, and are arranged as nonviscous, soluble, and fermentable fibers. High performance (HP) inulin is a prebiotic that has a long-chain, high-molecular weight mixes of inulin-type fructans, without any fructans that have a degree of polymerization <10 [5]. This type of inulin is incorporated into baked goods, milk products, drinks, and desserts as a substitute for sugar and/or fat [6]. HP Inulin has a specific colonic fermentation property that is able to change the composition of the gut microflora toward bifidobacteria. Ingestion of 5 to 8 g/day of inulin should be sufficient to exhibit a positive effect on the gut microflora. Possible side effects of inulin-type fructans can be seen at doses that are higher than 20 g/day [5].
The effects that inulin-type fructans have on reducing blood glucose and oxidative stress has been shown in previous animal based studies [7,8]. To our knowledge, all of the human studies to date have only assessed the effects of fructooligosaccharides (FOS), which have a lower molecular weight than HP inulin, on diabetic patients and that there has been no study that has yet assessed the effects of HP inulin on diabetic patients [9-11]. The results of the FOS studies on diabetic patients have been inconsistent. Yamashita et al. [9] has shown that beneficial effects of oligofructose exist in regards to the blood glucose and lipid profile of diabetic patients. In contrast, a couple of other studies have failed to show any beneficial effects of inulin-type fructans in diabetic patients [10,11]. Due to the probably beneficial effects of inulin-type fructans, especially on the carbohydrate metabolism [9, 12] and the antioxidant status [7,8], and the scarcity of data that exist on the HP inulin effect on glycemic and antioxidant status, the present study was designed to assess the hypoglycemic and antioxidant effects of HP inulin in women with type 2 diabetes.
METHODS
Subjects
Sixty-five females with DM that were between the ages of 20 and 65 years of age had participated in the study. Participants were recruited from the Iranian Diabetic Society and from endocrinology and metabolism clinics that were associated with the Tabriz University of Medical Science. Inclusion criteria was defined as: having DM for more than 6 months, currently having anti-diabetic treatment, having a stable diet and a body mass index (BMI) >25 kg/m2 for the past 3 months. DM was defined as having a fasting glucose level that is ≥126 mg/dL [13]. Subjects were excluded if they had a history of gastrointestinal, pancreatic, or cardiovascular disease, renal, thyroid or liver disturbance, being pregnant or lactating, consuming prebiotics, or probiotics, antibiotics, antacids, alcohol, antidiarrheal, anti-inflammatory or laxatives drugs, or lipid-lowering medications 2 months prior to the intervention or during the intervention, or if the individual had a typical fiber intake >30 g. Prior to the intervention, an appointment time was set for each subjects to provide study information and to complete their individual questionnaire and to provide their written informed consent. Demographic data including age, medication, and diabetes duration (in years) was obtained by using the questionnaire. The study was approved by the Ethical Committee of the Tabriz University of Medical Sciences and it was registered on the Iranian Registry of Clinical Trials website (http://www.irct.ir/, IRCT201110293253N4).
Experimental design
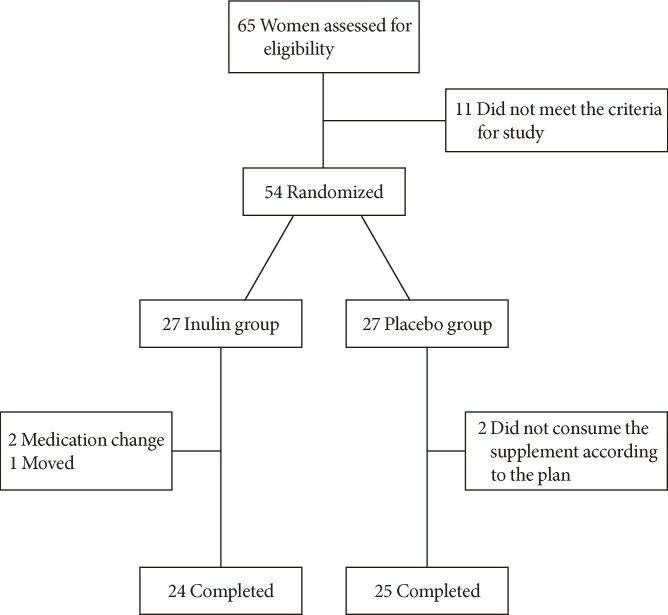
The randomized control trial design was used to perform our study in parallel and as a triple-blinded study. Both the participants and the researcher were blinded to the intervention. Participants were randomly assigned in to one of two groups by using a block randomization procedure, which matched subjects to each block based on BMI and age. The experimental group received a daily supplement of 10 g of HP inulin (Sensus, Roosendaal, The Netherlands) and the control group received a similar amount of maltodextrin (Jiujiang Hurirong Trade Co., Ltd, Jiujiang, China), which served as the placebo, for 2 months. Daily supplements were divided in to two packages of 5 g each, which were instructed to be consumed with breakfast and dinner along with a cup of water. The taste and appearance of maltodextrin and inulin were similar to one another and the substrates were provided to the volunteers in similar opaque packages. Subjects received half of their packages at the beginning of the study and received the remaining packages in the middle of the study. In order to minimize the dropout rate and to ensure the consumption of the supplements, the participants received a phone call once per week. The phone number of the researcher was provided to all of the participants to help answer any question or concerns that may arise throughout the intervention. Subjects were recommended to return all of their packets regardless of whether they were (full or empty) in order to assess the consumption status of each participant. The volunteers were recommended to have stable physical activity throughout the duration of the study. A diagram of the study design is shown in Fig. 1.
Study design.
Body weight and food intake assessment
A research assistant measured the anthropometric indices, including body weight and height, at the beginning and at the end of the trial. Weight was measured to the nearest 0.1 kg, and the height was measured, to the nearest 0.1 cm. BMI was calculated as weight in kilograms divided by the square of the height in meters. Nutrient intake data was also collected at the beginning and at the end of the trial period. Diet evaluations were performed with the use of 3-day diet record at the baseline and at the end of the study. All of the subjects attended a training meeting prior to the start of the intervention where they were instructed on how to properly use the food scale and record their food intake. Subjects were instructed to report all of the food they had consumed for 2-week days and 1-weekend day at the beginning and at the end of the study. Dietary data were analyzed using the Nutritionist 4 software (First Databank Inc., Hearst Corp., San Bruno, CA, USA).
Blood sampling and biochemical assays
At the beginning and at the end of the trial period, 10 mL of venous blood were collected between 7:00 to 9:00 AM after an overnight fast, into two vacutainer tubes, in which one tube contained ethylene-diamine-tetraacetic acid in order to measure the blood levels of glycosylated hemoglobin (HbA1c) and the other tube contained sodium fluoride in order to determine glucose, insulin and antioxidant indices including the total antioxidant capacity (TAC), superoxide dismutase (SOD), glutathione peroxidase (GSH-Px), catalase, and malondialdehyde (MDA). The serum and plasma samples were separated from whole blood by centrifugation at 2,500 rpm for 10 minutes (Beckman Avanti J-25; Beckman Coulter, Brea, CA, USA) at room temperature. The serum samples were stored at -20℃ immediately after centrifugation until they were used for their respective assays. Fasting plasma glucose (FPG), HbA1c, and insulin were analyzed on the day of sampling. FPG was measured by using the enzymatic method using an Abbot Model Aclyon 300, USA autoanalyzer with kits from Pars-Azmone (Tehran, Iran). HbA1c was determined using the sample of whole blood by using an automated HP liquid chromatography analyzer with commercially available kits from Bio-Rad D-10 Laboratories, Schiltigheim, France. Serum insulin was measured using the chemiluminescent immunoassay method (LIAISON analyzer 310360; Diasorin S.P.A, Verecelli, Italy).
Homeostasis model assessment of insulin resistance (HOMA-IR) was calculated according to the following formula: [fasting insulin (µU/mL)×FPG (mg/dL)]/405 [14]. Measurement of TAC in serum and SOD and GSH-Px in whole blood was performed by using the colorimetric method with commercial kits (TAS, RANDOX kits; SOD, RANSOD kits; and GSH-Px, RANSEL kits; RANDOX Laboratory, Crumlin, UK), on an automatic analyzer (Abbott model Alcyon 300; Abbott Laboratories, Abbott Park, IL, USA). The serum MDA level, which is used as a marker for lipid peroxidation and oxidative stress, was measured by using a reaction with thiobarbituric acid (TBA) as a TBA reactive substance (TBARS) in order to produce a pink colored complex. This fluorescence intensity was measured at 547 nm with an excitation at 525 nm with a spectrofluorimeter (model SFM 25A; Kontron, Milan, Italy) [15]. Catalase activity was estimated using the method described by Aebi [16]. Catalase can degrade H202 and this can be measured directly by the reduction in the absorbance at 240 nm. The H202 was diluted with phosphate buffer that was at a pH 7.0 and its initial absorbance was adjusted between 0.5 to 0.6 absorbance units at 240 nm. The reduction in the absorbance was measured. One unit of catalase activity was defined as the amount of catalase that is fully absorbed in 30 seconds at 25℃. The catalase activity was then calculated from the change in absorbance and was finally expressed as units per milliliter [16].
Statistical analysis
Data were analyzed using the SPSS software version 17.0 (SPSS Inc., Chicago, IL, USA). The results were expressed as mean±standard deviation. The normality of the distribution of data was evaluated by the one-sample Kolmogorov-Smirnov test. For quantitative variables, paired and unpaired sample t-tests were used for means comparisons. The medications used in the two groups were compared using the Mann-Whitney U test. Analysis of covariance (ANCOVA) was used to identify any differences between the two groups after intervention, and was adjusted for the baseline measurements and covariates. Differences with a P<0.05 were considered to be statistically significant.
RESULTS
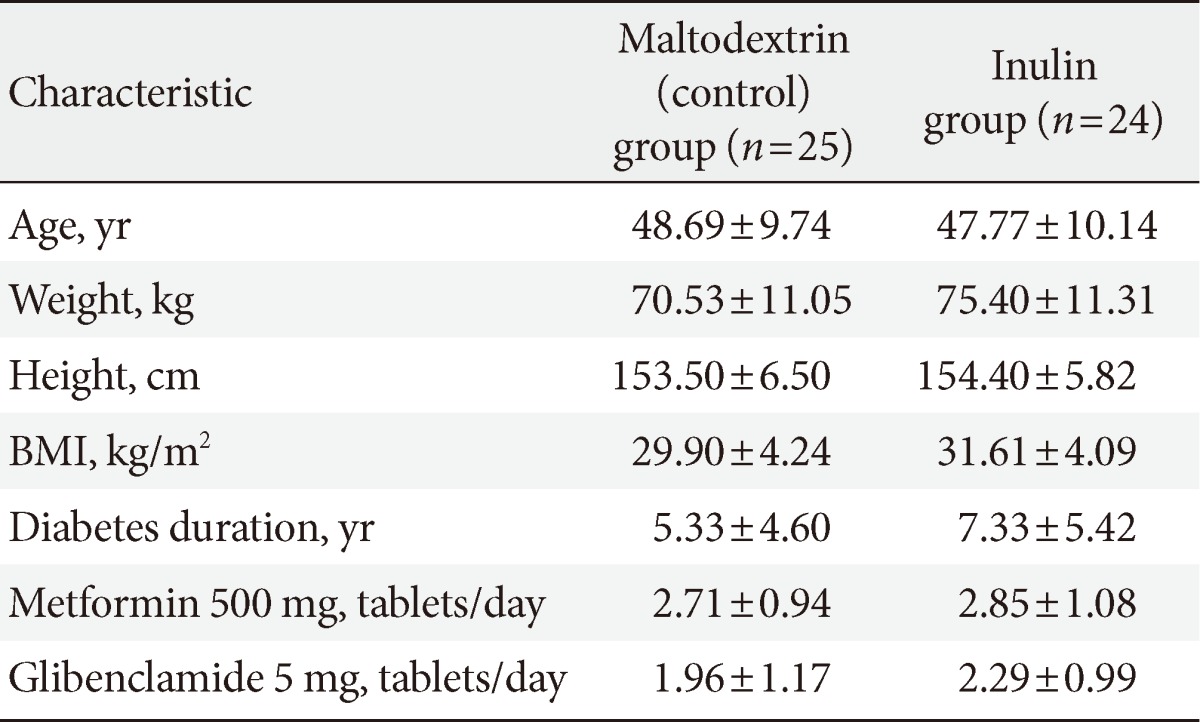
Of the 65 participants that were assessed for study eligibility, 49 of the participants completed the study (inulin group, 24; placebo group, 25) (Fig. 1). Participants did not report any adverse effects or symptoms with the inulin supplementation. Table 1 shows the baseline characteristics of the participants in the two groups. The two groups were similar in their initial characteristics.
Baseline characteristics of the study participants
Effect of inulin supplementation on body weight and dietary intakes
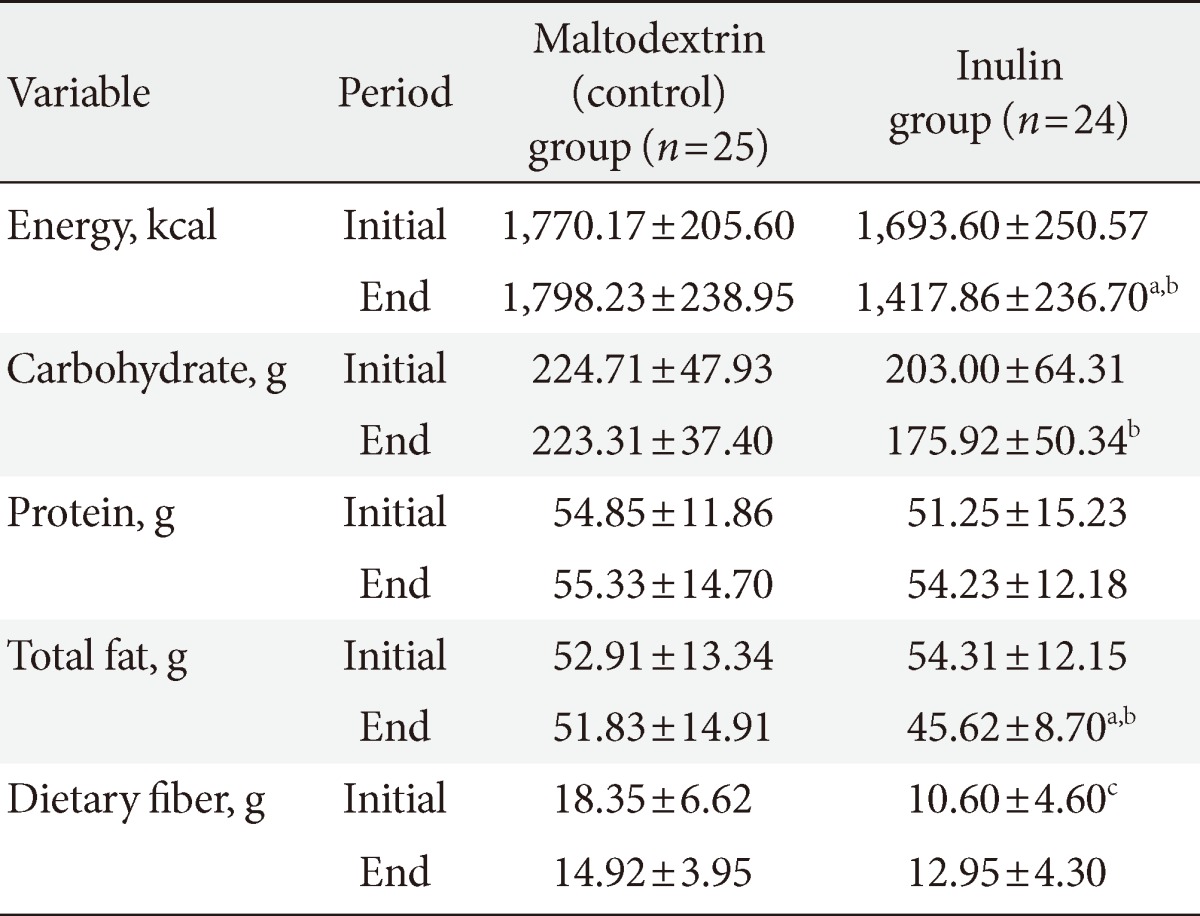
The comparisons between the two groups showed that there were no significant differences in regards to the baseline body weight and the BMI (Table 1). The dietary intake of the macronutrients is shown in Table 2. The comparison between the baseline dietary intakes of the two groups showed that there was no significant differences in the energy or the macronutrients intake, with the exception of dietary fiber which was significantly higher in the maltodextrin group.
Daily dietary intake of participants at baseline and the end of the study
After 2 months of supplementation, the body weight and BMI remained unchanged in the maltodextrin group, while both the body weight and BMI significantly decreased in the inulin group (75.40±11.31 to 72.85±11.16, 31.60±4.09 to 30.50±4.02, respectively; P<0.05). These changes were significant in the inulin group when compared to the baseline values (P<0.05). Intakes of energy, carbohydrate and total fat were significantly different between the two groups at the end of the study. In the inulin group the intake of energy and the total fat decreased significantly, while in the maltodextrin group they remained unchanged.
Effects of inulin supplementation on glycemic indices and oxidative stress parameters
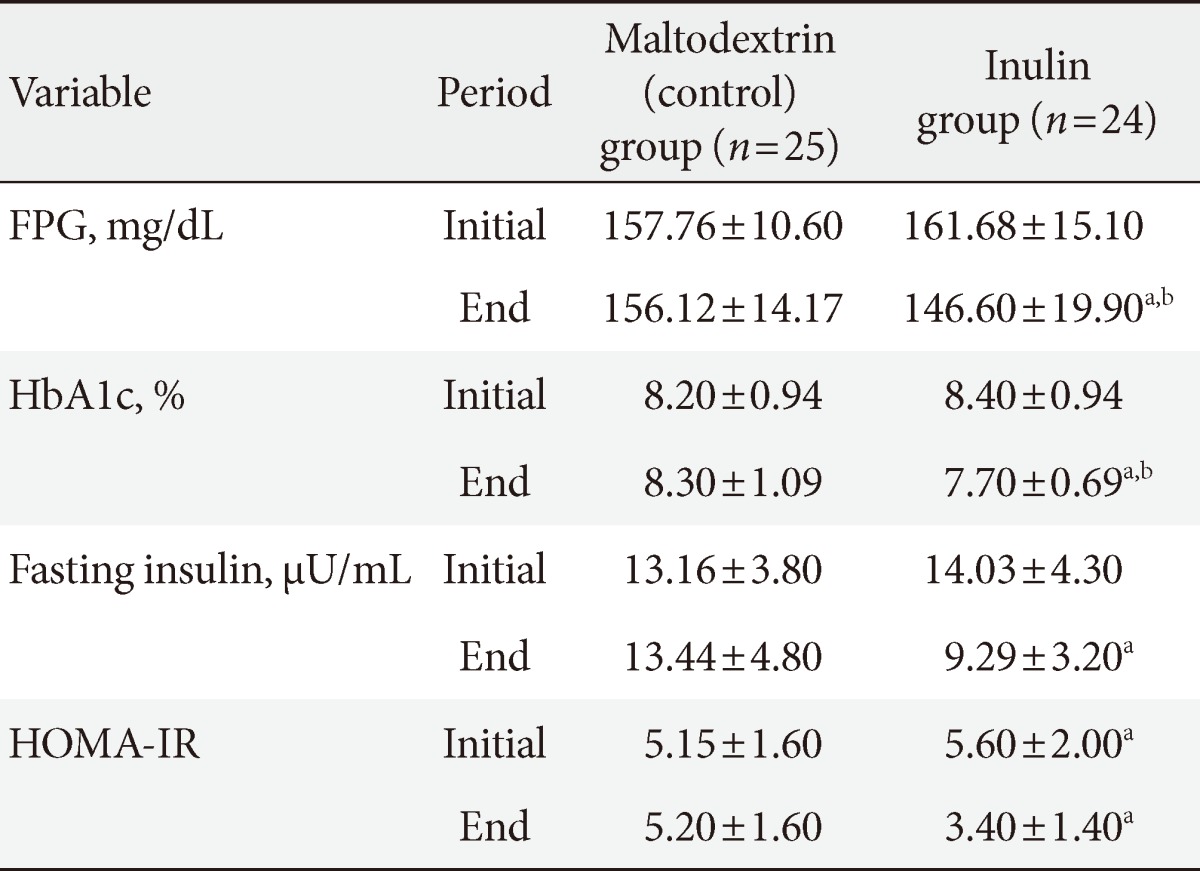
At the beginning of the study, there were no significant differences between the inulin group and the maltodextrin group in regards to the glycemic indices and the oxidative stress parameters (Tables 3 and 4). At the end of the study, there was a significant decrease in the FPG (8.47%), HbA1c (10.43%), and MDA (37.21%) in the inulin group when compared to that of the maltodextrin group (P<0.05, ANCOVA when adjusted for dietary fiber, energy changes, weight changes, and baselines values). We observed no significant reduction in the fasting insulin (34.32%) or the HOMA-IR (39.48%) in the inulin group when compared to the maltodextrin group (P>0.05, analysis of the covariance when adjusted for dietary fiber, energy changes, weight changes, and baselines values).
Effects of 2 months of inulin or maltodextrin supplementation on glycemic indices in studied subjects
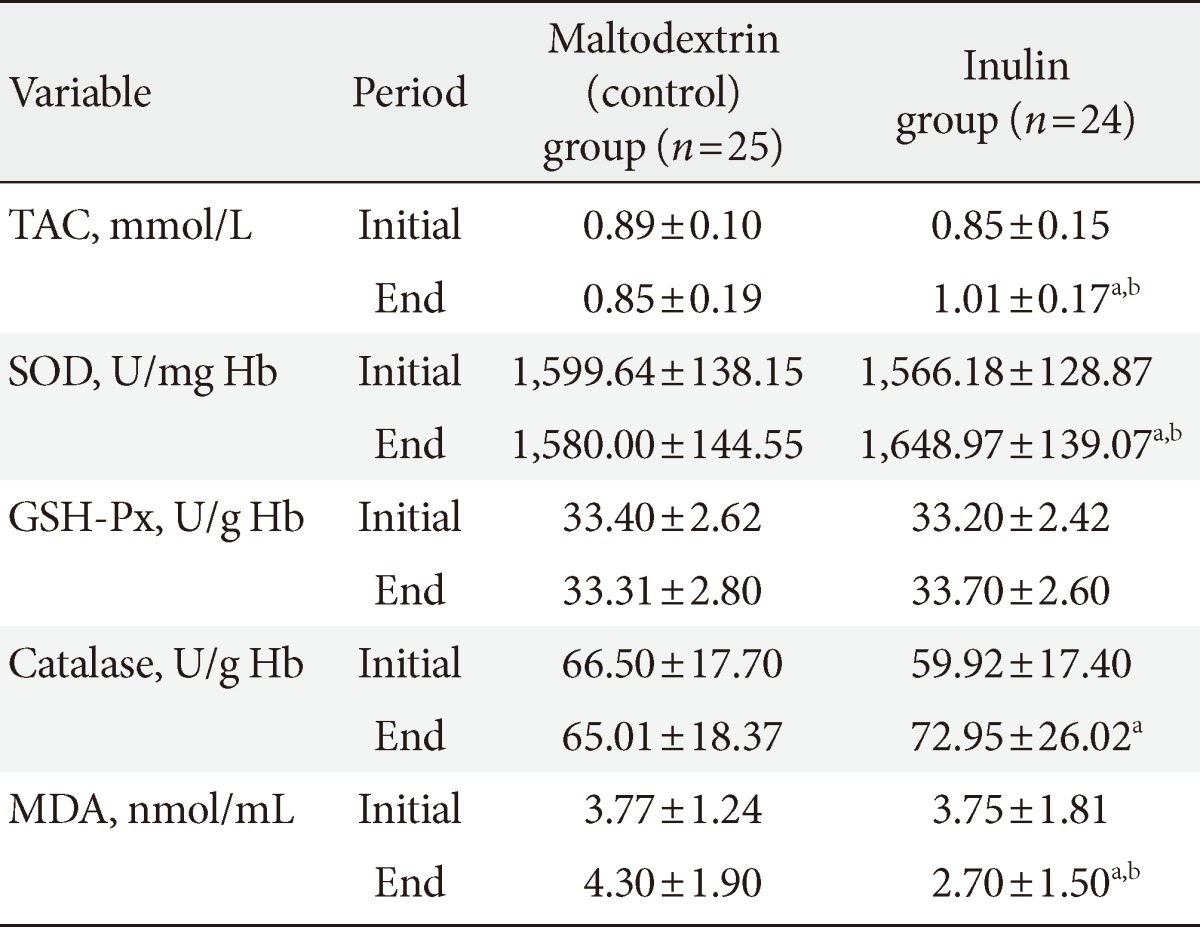
Effects of 2 months of inulin or maltodextrin supplementation on the antioxidative indices and MDA in studied subjects
Inulin supplementation caused a 18.82% increase in the TAC and a 4.36% increase in the SOD when compared with the maltodextrin group after adjusting for dietary fiber, energy changes, weight changes and baselines values (P<0.05). The TAC levels increased (0.85±0.15 to 1.01±0.17 mmol/L) and the MDA levels decreased (3.75±1.81 to 2.70±1.50 nmol/mL) in the inulin group (P<0.05). Levels of catalase increased in the inulin group (P<0.05, paired t-test), but this change was not significant when compared to that of the maltodextrin group (P>0.05, ANCOVA adjusted for dietary fiber, energy changes, weight changes, and baseline values). GSH-Px activity remained unchanged in both groups. In the maltodextrin group the TAC, MDA, SOD, and catalase changes that were observed were not significant.
DISCUSSION
High fiber diets can be beneficial in the prevention and management of diabetes. Some studies have reported that prebiotic fibers may have a dominant effect on the control of diabetes [17]. Therefore, in this clinical trial, we investigated the effect that HP inulin supplementation has on glycemic indices and on antioxidant markers of type 2 diabetic patients. Our results showed that two months of HP inulin supplementation significantly decreased body weight and BMI when compared to the group that received maltodextrin supplementation. Similar results have been shown with oligofructose supplementation in animal studies and in studies with diabetic patients [11,18,19]. Parnell and Reimer [20] have reported that the supplementation of healthy adults with oligofructose at a dose of 21 g/day for 12 weeks decreased body weight. In our study, the energy intake of the inulin group significantly decreased (1,693.60±250.57 to 1,417.86±236.70, P<0.05). The exact mechanism(s) of weight reduction by inulin remains unclear. Some gut satiety hormones, especially those that are responsive to diet composition, including glucagon-like peptide 1 (GLP-1), PYY, and ghrelin, are proposed to influence weight reduction [21].
In order to consider weight reduction as a main interventional cause of observed changes in studied biochemical parameters, we included it in the ANCOVA model as a confounding factor. After the adjustment for weight reduction, and energy intake, we showed that 2 months of inulin supplementation reduced the FPG, HbA1c, fasting insulin, and HOMA-IR when compared to that of the maltodextrin group. There were no statistically significant differences in the fasting insulin and HOMA-IR between the two groups.
To the best of our knowledge there have not been any studies to date on the HP inulin effects in diabetic patients and there have only been three studies that have investigated the effects of fructans other than HP inulin on glucose and insulin in type 2 DM patients [9-11]. Yamashita et al. [9] have shown that oligofructose supplementation at a dose of 8 g/day for 2 weeks decreased the FPG levels in type 2 DM patients. Luo et al. [10] and Alles et al. [11] have reported that there were no significant changes that were observed with oligofructose supplementation, on FPG fasting insulin in patients with type 2 DM.
Jackson et al. [22] and Giacco et al. [23] have shown that prebiotic supplementation (10 g/day inulin for 8 weeks in healthy subjects and 10 g/day of short-chain-fructo-oligosaccharides for 2 months in individuals with mild hypercholesterolaemia, respectively) decreased fasting insulin. Russo et al. [24] have reported that a significant decrease in HbA1c and HOMA-IR in healthy young volunteers can be achieved by introducing inulin-enriched pasta. The different results obtained in these studies may be explained by the dose and the kind of supplementation, pathologic state and basal levels of the glycemic indices of the type 2 DM patients being studied.
Several mechanisms have been proposed to explain the hypoglycemic effect of fibers. Soluble fibers, such as inulin, can control or lower serum glucose by delaying gastric emptying, retarding entry of glucose into the blood stream, and reducing the post-meal rise of serum glucose [25]. Also, the modification of the secretion of the gut hormones such as GLP-1 [26] and short-chain fatty acids (SCFA), which are produced from colonic fermentation of prebiotics [27], can affect serum glucose and insulin levels. SCFA may play a role in the so-called ileocolonic brake, which explains the inhibition of gastric emptying when nutrients reach the ileocolonic junction [27]. Oligofructose also increases glucose tolerance with increasing levels of GLP-1, plasma insulin, pancreatic insulin, and β-cell mass [19], as well as an increase of GLP-2 [18].
Lipid peroxidation is higher in type 2 DM patients. Reduced lipid peroxidation and improved antioxidant status might be one of the mechanisms that may prevent and treat diabetic complications [28]. MDA is the main product of polyunsaturated fatty acids peroxidation in cells. MDA is a good marker of oxidative stress [29]. There are antioxidant systems that fight free-mediated damage. Antioxidant systems involve enzymes such as SOD, catalase, and GSH-Px as well as nonenzymatic substances such as vitamins and GSH [30].
There is consistent evidence that the total antioxidant status in type 1 or 2 DM is lower than that of age-matched controls [28]. We found significantly decreased levels of serum MDA in the inulin group when compared to that of the maltodextrin group. Also, our study showed that inulin supplementation significantly increased the TAC levels and SOD activity. Catalase levels increased in the inulin group (P<0.05, paired t-test), but it was not different when compared to the maltodextrin group (P>0.05, unpaired t-test). The activity of GSH-Px did not significantly change in either group.
According to the review of the existing literature, there have been no studies on the effect that inulin may have on the antioxidant status of type 2 DM patients, and so we have reported the results of some similar studies. Wang et al. [31] have shown that 5% of xylooligosaccharides increase the activity of catalase, SOD, and GSH-Px and decreased MDA in rats. Rishi et al. [30] have shown that the activity of SOD and glutathione increased in mice treated with probiotics in conjunction with a prebiotic and observed a decrease in the activity of MDA. Baynes [32] has suggested that the supplementation of xylo-oligosaccharides reduces the activity of catalase and that it did not change the activity of SOD and GSH-Px in type 2 DM patients. Gourineni et al. [33] have reported that dietary bioactive compounds such as prebiotics, their byproducts, and metabolites may increase the activity of glutathion-S-transferase, catalase, and SOD in prebiotic (synergy1)-fed mice. These results are in agreement with the results of our study.
Conversely, Seidel et al. [34] have reported that the consumption of bread that is supplemented with inulin did not significantly change the ferric reducing ability of plasma in male smokers and nonsmokers. Another study on the supplementation with inulin and FOS shows that there is no affect on serum TAC, GSH-Px, and SOD activities, while it decreases TBARS in rats [7]. Kozmus et al. [8] have reported that dietary supplementation with dextrin or oligofructose leads to a 20% decrease in total glutathione and reduced glutathione (GSH). The activities of glutathione dependent antioxidant enzymes, SOD, catalase, and MDA remain unchanged in the dextrin or oligofructose groups [8]. These different results may be related to dose and type of prebiotic, species, genotype of subject, basal antioxidant, and glycemic status, and pathologic state of the subjects.
The exact mechanisms of the fructans antioxidant properties remain unclear. Further research studies should be designed in order to obtain a precise perception of the mechanism(s) that are responsible for these potential beneficial effects of fructans against the complications of diabetes. Inulin-type fructans may act as antioxidant themselves and, they could act directly as reactive oxygen species (ROS) that indirectly scavenge through SCFAs and antioxidant enzymes [35]. One of the possible mechanisms is the prebiotics ability to modify microflora in the gastrointestinal tract. Gobinath et al. [36] have shown that the consumption of prebiotics, such as oligosaccharides and xylo-oligosaccharides, stimulate the growth of bifidobacteria and lactobacicilli. Lactic acid bacteria have SOD and in vitro studies have shown that lactic acid per se and the fermentations of FOS by deferent strains of bifidobacteria lead to the elimination of free radicals [37]. Also, it may be that lactobacilli resident in gut lyses and release their intracellular antioxidative constituents that in turn help to decrease the MDA [31]. Another possible mechanism may be due to the ability of prebiotics to modify gene expression of antioxidant enzymes. It is reported that the consumption of chicory reduces oxidative stress, restores GSH levels and induces gene expression, which results in the overexpression of the activity of the antioxidant enzyme catalase and in turn, up-regulating the endogenous antioxidant defense system [38]. It has been suggested that the consumption of inulin supplementation exerts these same systemic antioxidative effects in the colon. It is known that enhanced concentrations of butyrate in colonic cells results in reduced colonic myeloperoxidase activity and restored GSH concentration. Also, butyrate has been effective in controlling the enhancement of ROS levels and in decreasing ROS-mediated p42/44 MAPK phosphorylation [39]. Another mechanism that may have contributed to the antioxidant indices is the lowering of the formation of advanced glycation end products (AGEs). Increased blood glucose levels could be due to oxidative stress and this would results in the formation of AGE products. It is suggested that the dietary oligosaccharides may reduce the oxidative stress by reducing the formation of these AGE products [38].
Our study did have some limitations, including a small sample size and a short intervention time. We did not measure serum fatty acids or take into consideration the glucose clamp. We also did not define gut microflora changes with inulin supplementation. Measuring of other oxidative stress indices, such as F2-isoprostanes, could strengthen the results of our study.
In conclusion, the results of this study showed that inulin supplementation reduces body weight and improves glycemic indices, antioxidant indices, and the MDA levels in type 2 DM patients. These findings suggest a safe and inexpensive intervention for the management of type 2 DM. Further investigations are needed in order to confirm the positive effect that inulin had on the glycemic and antioxidant indices and the MDA in type 2 DM patients.
ACKNOWLEDGMENTS
The authors would like to thank all of the patients for their participation in this study. They would also like to thank Mr. Firuz Purrahim for his help in recruiting these participants and also to Mr. Amir M. Vatankhah for his technical assistance throughout this project. This research project was also financially supported by the Health and Nutrition Faculty of the Nutrition Research Center and the Vice Chancellor of Research of the Tabriz University of Medical Sciences in Iran. This article was written based on the data from a PhD thesis on nutrition, which was registered in the Tabriz University of Medical Sciences.