- Current
- Browse
- Collections
-
For contributors
- For Authors
- Instructions to authors
- Article processing charge
- e-submission
- For Reviewers
- Instructions for reviewers
- How to become a reviewer
- Best reviewers
- For Readers
- Readership
- Subscription
- Permission guidelines
- About
- Editorial policy
Articles
- Page Path
- HOME > Diabetes Metab J > Volume 44(4); 2020 > Article
-
Original ArticleCovid-19 The Clinical Characteristics and Outcomes of Patients with Moderate-to-Severe Coronavirus Disease 2019 Infection and Diabetes in Daegu, South Korea
-
Mi Kyung Kim1
 , Jae-Han Jeon2, Sung-Woo Kim3, Jun Sung Moon4, Nan Hee Cho1, Eugene Han1, Ji Hong You1, Ji Yeon Lee1, Miri Hyun1, Jae Seok Park1, Yong Shik Kwon1, Yeon-Kyung Choi2, Ki Tae Kwon2, Shin Yup Lee2, Eon Ju Jeon3, Jin-Woo Kim3, Hyo-Lim Hong3, Hyun Hee Kwon3, Chi Young Jung3, Yin Young Lee4, Eunyeoung Ha4, Seung Min Chung4, Jian Hur4, June Hong Ahn4, Na-young Kim5, Shin-Woo Kim5, Hyun Ha Chang5, Yong Hoon Lee5, Jaehee Lee5, Keun-Gyu Park5, Hyun Ah Kim1, Ji-Hyun Lee3
 -
Diabetes & Metabolism Journal 2020;44(4):602-613.
DOI: https://doi.org/10.4093/dmj.2020.0146
Published online: August 12, 2020
1Department of Internal Medicine, Keimyung University Dongsan Hospital, Keimyung University School of Medicine, Daegu, Korea.
2Department of Internal Medicine, Kyungpook National University Chilgok Hospital, School of Medicine, Kyungpook National University, Daegu, Korea.
3Department of Internal Medicine, Daegu Catholic University Hospital, Daegu Catholic University School of Medicine, Daegu, Korea.
4Department of Internal Medicine, Yeungnam University Hospital, Yeungnam University College of Medicine, Daegu, Korea.
5Department of Internal Medicine, Kyungpook National University Hospital, School of Medicine, Kyungpook National University, Daegu, Korea.
- Corresponding author: Hyun Ah Kim. Department of Internal Medicine, Keimyung University Dongsan Hospital, Keimyung University School of Medicine, 1035 Dalgubeol-daero, Dalseo-gu, Daegu 42601, Korea. hyunah1118@dsmc.or.kr
- Corresponding author: Ji-Hyun Lee. Department of Internal Medicine, Daegu Catholic University Hospital, Daegu Catholic University School of Medicine, 33 Duryugongwon-ro 17-gil, Nam-gu, Daegu 42472, Korea. jhlee9@cu.ac.kr
- *Mi Kyung Kim and Jae-Han Jeon contributed equally to this study as first authors.
Copyright © 2020 Korean Diabetes Association
This is an Open Access article distributed under the terms of the Creative Commons Attribution Non-Commercial License (http://creativecommons.org/licenses/by-nc/4.0/) which permits unrestricted non-commercial use, distribution, and reproduction in any medium, provided the original work is properly cited.
ABSTRACT
-
Background
- Coronavirus disease 2019 (COVID-19) is a global pandemic that had affected more than eight million people worldwide by June 2020. Given the importance of the presence of diabetes mellitus (DM) for host immunity, we retrospectively evaluated the clinical characteristics and outcomes of moderate-to-severe COVID-19 in patients with diabetes.
-
Methods
- We conducted a multi-center observational study of 1,082 adult inpatients (aged ≥18 years) who were admitted to one of five university hospitals in Daegu because of the severity of their COVID-19-related disease. The demographic, laboratory, and radiologic findings, and the mortality, prevalence of severe disease, and duration of quarantine were compared between patients with and without DM. In addition, 1:1 propensity score (PS)-matching was conducted with the DM group.
-
Results
- Compared with the non-DM group (n=847), patients with DM (n=235) were older, exhibited higher mortality, and required more intensive care. Even after PS-matching, patients with DM exhibited more severe disease, and DM remained a prognostic factor for higher mortality (hazard ratio, 2.40; 95% confidence interval, 1.38 to 4.15). Subgroup analysis revealed that the presence of DM was associated with higher mortality, especially in older people (≥70 years old). Prior use of a dipeptidyl peptidase-4 inhibitor or a renin-angiotensin system inhibitor did not affect mortality or the clinical severity of the disease.
-
Conclusion
- DM is a significant risk factor for COVID-19 severity and mortality. Our findings imply that COVID-19 patients with DM, especially if elderly, require special attention and prompt intensive care.
- Within a few weeks of the first report of coronavirus disease 2019 (COVID-19) in Wuhan, China, the first case of COVID-19 was confirmed in South Korea [1]. Subsequently, there was an exponential increase in the number of COVID-19 cases in South Korea during February and March 2020 [2]. In May 2020, of the 11,344 virus-positive patients in the whole of Korea, 65% (6,880 patients) were in the fourth-largest city, Daegu, because of a large outbreak that was attributed to a religious assembly. Among the patients, those whose symptoms were mild were primarily cared for at “therapeutic living centers,” whereas acutely and severely ill patients were admitted to five university hospitals in Daegu [3]. These hospitals had readily available high-flow nasal cannulae, mechanical ventilation, continuous renal replacement therapy (CRRT), extracorporeal membrane oxygenation (ECMO), and intensive care units (ICUs), the provision of which was managed by mutual cooperation among the staff of the hospitals. Therefore, patients with COVID-19 in the Daegu region who were admitted to these hospitals were moderately-to-severely ill, but were cared for appropriately and in a timely fashion.
- Patients with diabetes mellitus (DM) or hyperglycemia are susceptible to infection because of defects in their innate immunity that result in defective phagocytosis and neutrophil chemotaxis [45]. Moreover, among several risk factors, DM per se is considered to be a major contributor to the severity and mortality rate associated with previously identified respiratory viral infections, including Middle East respiratory syndrome coronavirus and severe acute respiratory syndrome coronavirus 2 [67]. Therefore, DM is considered to be an important risk factor for the severity of and mortality associated with COVID-19. Furthermore, some previous studies have shown that DM increases the mortality rate of patients with COVID-19 [89], although others did not show a difference in mortality between COVID-19 patients with or without DM [1011]. Because individuals with DM tend to be older and have more co-morbidities than those without DM, the assessment of DM as an independent risk factor for COVID-19 outcomes is challenging. In addition, because COVID-19 infection, as its nomenclature suggests, is a novel viral disease, the impact of DM on the outcome of resulting disease has yet to be fully and appropriately assessed.
- Therefore, in the present study, we determined whether the presence of DM affected the severity or mortality of COVID-19 by comparing patients with or without DM, and patients who were matched 1:1 using propensity score (PS)-matching.
INTRODUCTION
- Study design and participants
- We conducted a multi-center, retrospective, observational study. The study protocol was approved by the Institutional Review Board of Keimyung University Dongsan Hospital (2020-04-111) and individually by the Institutional Review Boards of each collaborating hospital. The necessity for informed consent was waived by the ethics boards of the hospitals because of the retrospective study design.
- The study participants comprised adult patients (age >18 years) with COVID-19 that was laboratory-confirmed between 18 February 2020 and 31 March 2020. They were recruited from university hospitals (Daegu Catholic University Hospital, Keimyung University Dongsan Medical Center [Dongsan Hospital and Daegu Dongsan Hospital], Kyungpook National University Hospital, Kyungpook National University Chilgok Hospital, and Yeungnam University Hospital) in Daegu.
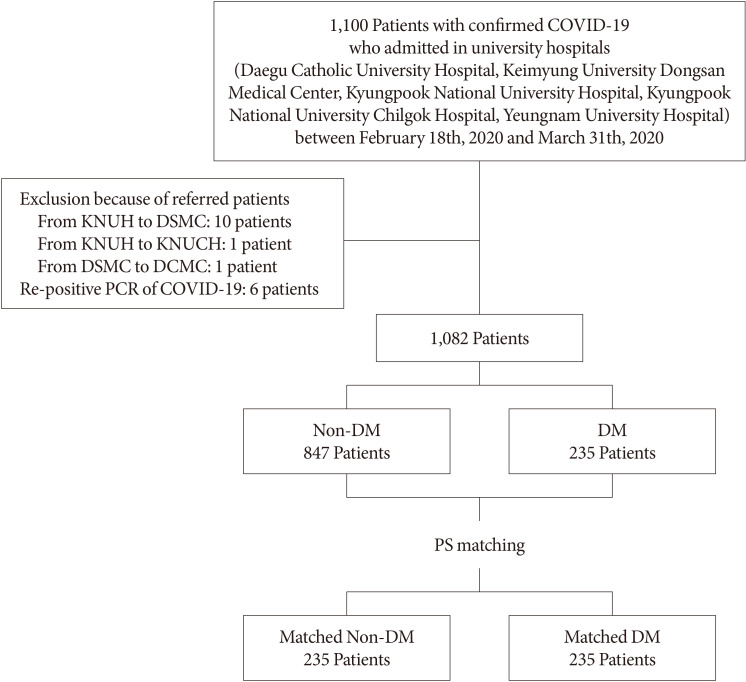
- COVID-19 was diagnosed using a reverse transcription-polymerase chain reaction (RT-PCR) assay of nasal or pharyngeal swab specimens, and a confirmed case of COVID-19 was defined using a positive result on RT-PCR, irrespective of the clinical signs and symptoms present. A total of 1,100 patients were included in the study. Patients who were diagnosed with re-positive COVID-19 were excluded from the study. Patients who were admitted to more than two hospitals because of referral within the cohort were counted as a single case. After the exclusion of 18 patients, 1,082 were enrolled and allocated to a DM (n=235) or a non-DM (n=847) group. After PS-matching, 235 DM patients and 235 non-DM patients who had been matched for age, sex, and the presence of underlying disease (hypertension, cerebrovascular disease, cardiovascular disease, chronic kidney disease, chronic pulmonary disease, and cancer) were also compared (Fig. 1).
- Data collection and definitions
- We collected data from electronic medical records regarding the age, sex, vital signs, co-morbidities (hypertension, cerebrovascular disease, cardiovascular disease, chronic kidney disease, chronic pulmonary disease, and cancer), medication, laboratory findings, presence of pneumonia on chest radiographs or computed tomography (CT), treatment modality, and outcomes during hospitalization for all the participants. The major symptoms present (fever, cough, sputum, rhinorrhea, sore throat, myalgia, diarrhea, and shortness of breath) were also recorded. The laboratory findings included routine blood tests, glycosylated hemoglobin (HbA1c), C-reactive protein (CRP), procalcitonin, and serum indicators of liver or kidney injury. The presence of DM was defined on the basis of the participants' medical history and the diagnostic criteria for DM of the Korean Diabetes Association [12]. Release from quarantine was defined using the instructions from the Korean Central Disease Control Headquarters: (1) clinically, the absence of a fever, without the necessity for an anti-pyretic agent, and an improvement in symptoms; (2) negative results of PCR tests performed twice at a 24-hour interval [13]; (3) severe disease defined as the necessity for the use of a high-flow nasal cannula, mechanical ventilation, CRRT, or ECMO, or admission to an ICU.
- Quantification and statistical analysis
- Statistical analyses were performed using SPSS Statistics version 18.0 (SPSS Inc., Chicago, IL, USA). Continuous data are presented as means and standard deviations, and categorical data as frequency rates and percentages. Comparisons between two groups were made using Student's t-tests for continuous data and chi-square tests for categorical data. The risk of death and the corresponding hazard ratio (HR) were analyzed using the Kaplan-Meier method and a Cox proportional hazard model. Multivariate logistic analysis of the initial laboratory findings was performed to identify prognostic factors for severe disease and death from COVID-19. The relationships of severe disease and death with the current medication of patients with DM were also evaluated using multivariate logistic analysis. Differences with a two-sided α<0.05 were considered to be statistically significant.
METHODS
- Baseline characteristics of patients with COVID-19 on admission
- The baseline characteristics of unmatched and PS-matched patients are shown in Table 1. A total of 1,082 patients with confirmed COVID-19 were enrolled, and 235 (21.81%) of these had DM (Table 1, Fig. 1). The mean ages of the participants were 56.5±18.0 and 68.3±11.9 years in the non-DM and DM group, respectively. Patients in their 50s were most common in the non-DM group, whereas in the DM group, patients in their 60s were most common, followed by those in their 70s (Supplementary Fig. 1). Five hundred and sixty-nine participants (67.2%) in the non-DM group and 129 (54.9%) in the DM group were women (P<0.01) (Table 1). After PS-matching, the percentages of women were 59.6% and 54.9%, respectively (P>0.05). As expected, patients with DM (73.7%) had more co-morbidities than those without DM (37.8%) (Table 1). After PS-matching, however, the prevalences of co-morbidities, such as hypertension, cerebrovascular accident, heart disease, chronic kidney disease, and cancer, did not differ between the two groups (Table 1). Among the participants with DM, 8.1% were using insulin. Metformin was the most commonly used oral antidiabetic drug (48.1%), followed by a dipeptidyl peptidase-4 (DPP-4) inhibitor (36.2%). With regard to antihypertensive drugs, renin-angiotensin system (RAS) inhibitors were the most commonly prescribed type of drug in the DM group, whereas calcium channel blockers were the most commonly prescribed type of drug in the non-DM group (Table 1).
- Approximately 16% of the participants did not present with any symptoms. Cough, sputum, rhinorrhea, sore throat, myalgia, headache, and diarrhea, which are indicative of upper respiratory tract infection or viral infection, were more prevalent in the non-DM group of the unmatched cohort (Table 1). By contrast, dyspnea and radiographically diagnosed pneumonia were significantly more prevalent in the DM group (Table 1). Although PS-matching abrogated the differences in the prevalence of the majority of the symptoms listed above, rhinorrhea remained more common in the non-DM group (Table 1). Two-thirds of the participants were diagnosed as having pneumonia by radiologic examination following their admission. Pneumonia was more prevalent on X-ray or chest CT in the DM group than in the non-DM group, although this difference was not significant in the PS-matched cohort (P=0.08). Analysis of the laboratory findings on admission showed higher HbA1c, serum glucose concentration, white blood cell (WBC) count, serum CRP, lactate dehydrogenase (LDH) activity, blood urea nitrogen, and creatinine; and lower lymphocyte count and serum albumin in participants with DM in the unmatched cohort. Furthermore, even after PS-matching, there were significantly higher serum glucose, HbA1c, LDH, and neutrophil count; and significantly lower lymphocyte count and serum albumin concentration. However, the serum CRP and creatinine concentrations were not significantly different (Table 1).
- In-hospital management and outcomes
- The number of deaths in the entire cohort was 85 (mortality rate, 7.85%) (Table 2). During hospitalization, 152 participants (14.04%) had severe disease, which was defined as a reliance on one or more of ICU care, high-flow O2 nasal cannulae, mechanical ventilation, CRRT, or ECMO (Table 2). In the PS-matched cohort, more of the participants with DM developed severe disease than those without DM (Table 2). The prevalence of quarantine release was also significantly lower in the DM group (Table 2). In addition, in the unmatched cohort, the period of time between COVID-19 confirmation and quarantine release, and the duration of stay in hospital, were significantly longer in participants with DM than in those without DM (Table 2). However, after PS-matching, these differences were not statistically significant (Table 2).
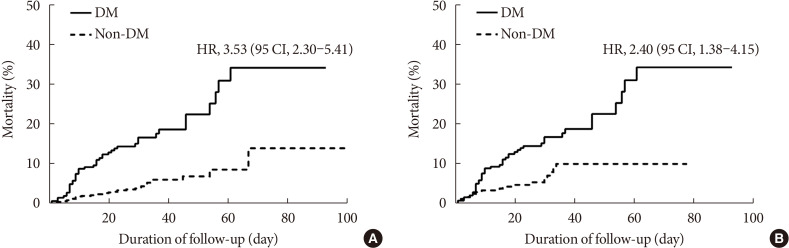
- The mortality rate was significantly higher in the DM group than in the non-DM group (18.7% vs. 7.7%) (Table 2). Not only in the entire cohort (Fig. 2A), but also in PS-matched participants, the DM group exhibited higher mortality than the non-DM group, as illustrated by the cumulative death rate (HR, 2.40; 95% confidence interval [CI], 1.38 to 4.15) (Fig. 2B).
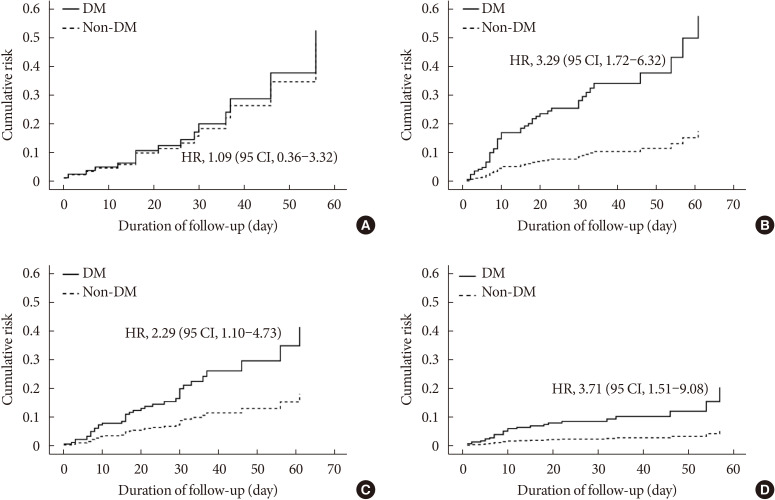
- We also stratified the PS-matched cohort according to their age and sex. Subgroup analysis showed that DM significantly increased the risk of mortality in participants aged ≥70 years (HR, 3.29; 95% CI, 1.72 to 6.32) (Fig. 3B), whereas DM did not increase this risk in participants aged <70 years (HR, 1.06; 95% CI, 0.36 to 3.32) (Fig. 3A). DM was associated with higher mortality, irrespective of sex (Fig. 3C and D).
- Identification of the baseline laboratory parameters that influence the severity of COVID-19-related disease and death
- Multivariate logistic analysis showed that high baseline WBC count, high hemoglobin concentration, low platelet count, low albumin concentration, and high aspartate aminotransferase (AST) activity were associated with a higher risk of death in participants with DM (Table 3). Low platelet count, high AST activity, low alanine aminotransaminase (ALT) activity, and high LDH activity were associated with severe disease (Table 3). Among participants with DM, the baseline random serum glucose and CRP concentrations were not associated with severe disease or death (Table 3). However, among non-DM participants, high CRP concentration, low albumin concentration, high AST activity, and low ALT activity were predictors of severe disease. Of these, only high AST activity was also a predictor of death (Table 3).
- Analysis of the relationships between the use of particular medications and in-hospital mortality
- Angiotensin-converting enzyme 2 (ACE2) inhibitor and DPP-4 inhibitor use appear to affect the pathogenesis of coronaviruses [1415]. Therefore, we next investigated whether the prior use of such medications affected the prognosis or mortality rate of participants with COVID-19, after adjustment for age, sex, and the presence of underlying diseases. As shown in Supplementary Table 1, the use of neither a RAS inhibitor nor a DPP-4 inhibitor was associated with higher prevalence of severe disease or death. Instead, the use of metformin or insulin tended to be associated with less severe disease and lower mortality, although these findings did not achieve statistical significance (Supplementary Table 1).
RESULTS
- In the present study, we showed that patients with DM are at higher risk of severe COVID-19-related disease and mortality. Given the importance of the relationship between COVID-19 and DM, an international panel of experts has recently made practical recommendations for the management of DM in patients with COVID-19 [16]. Our findings underscore the importance of taking extra care of patients with DM who contract COVID-19.
- In the present study, 21.8% of patients with COVID-19 had DM. A previous meta-analysis showed a mean prevalence of DM of 11% among patients with COVID-19 [9]. Because of the exponential increase in COVID-19 infections, doctors from the Daegu Medical Associations performed telephone consultations to check the status of patients who were confined at home and classified them on the basis of their disease severity. They were hospitalized if they exceeded a threshold score on a scoring system that consisted of the severity of disease, age, the presence of underlying disease, and social factors. Asymptomatic or mild cases were admitted to a “therapeutic living center” and closely monitored, whereas those with moderate-to-severe disease were admitted to university hospitals [3]. On the basis of the scoring system, most of the participants in the present study were classified as having moderate-to-severe disease.
- The prevalence of DM in the present study cohort was almost twice that of the general population, presumably because individuals with severe disease who were at high risk of severe disease or death were preferentially admitted to the university hospitals. Notably, unlike in other recently published studies [1718], female patients made up the larger proportions of both the non-DM and DM groups in the present study. This is in contrast to the Chinese data [18] and data from another region of Korea [19]. This difference might be attributable to a specific demographic characteristic: the exponential spread of the virus in Daegu was initiated in a female-dominated religious group.
- DM is an independent risk factor for the severity of and mortality associated with COVID-19 [920]. A previous large cohort study (a cohort of 7,336 COVID-19 patients with or without DM) showed that DM increases the mortality of patients and that strict glucose control improves the outcomes of COVID-19 [17]. An analysis of 1,950 COVID-19 patients also revealed that DM is a risk factor (HR, 1.59; 95% CI, 1.03 to 2.45) [8]. In addition, a meta-analysis showed that DM in patients with COVID-19 is associated with two-fold higher mortality compared with patients without DM [9]. These findings are highly suggestive that DM is an important factor in the prognosis of COVID-19. Nevertheless, several COVID-19 studies have not shown significant differences in disease severity or mortality in patients with or without DM, presumably because of the small numbers of participants [1021]. In addition, a recent observational study showed that DM is not an independent risk factor for COVID-19-related mortality [11].
- The findings of the present study also show that DM is associated with a higher risk of severe disease and mortality, regardless of sex. Furthermore, we identified a relationship between the presence of DM and higher mortality due to COVID-19 in older patients, but this relationship was not present in younger patients. A series of recent studies suggest that old age is a risk factor for mortality in patients with DM [1122], but this evidence is insufficient to conclude that DM is not a risk factor for COVID-19-related mortality in young patients. However, on the basis of the results of the present study, it is possible to surmise that DM is more likely to be a risk factor in older patients than in younger patients.
- In the present study, we did not identify any relationships between the use of specific medications and the outcomes associated with COVID-19 in DM patients. DPP-4 is a receptor for the human coronavirus-Erasmus Medical Center (hCoV-EMC) [15]. Although it is not clear whether this is also the case for COVID-19, and early studies have failed to identify relationships between the exposure to DPP-4 inhibitors and the outcomes of COVID-19 [23], an upregulation of DPP-4 in patients with type 2 DM remains a plausible explanation for the greater severity of COVID-19 in patients with DM [24]. Furthermore, it has been suggested that the ACE2 receptor is the primary receptor for coronavirus spike protein [1625]. Greater glycosylation of both the spike protein and the ACE2 receptor, secondary to hyperglycemia, may modulate the binding of the virus and therefore might account for the greater severity of COVID-19 in hyperglycemic patients. In the present study, the disease was slightly less severe in patients who were administering metformin or insulin, but this trend did not achieve statistical significance. Furthermore, the use of RAS inhibitors did not affect mortality. The effect of medication on the mortality associated with COVID-19 remains controversial [23262728]. Therefore, our findings are in line with recent recommendations that unless contraindicated, the continuation of current medication is strongly recommended [1729].
- The present study had some limitations. First, after the diagnosis of the 31st case of COVID-19 in South Korea, there was an exponential increase in the number of COVID-19 diagnoses in Daegu. Because of a shortage of infrastructure and training of medical staff, there was incomplete documentation regarding exposure history and laboratory testing conducted in the patients. In particular, and as previously documented [22], HbA1c values for a considerable proportion of the participants were missing; therefore, our analysis of the impact of the degree of baseline glycemic control (i.e., HbA1c on admission) on the severity and mortality associated with COVID-19 was limited. Second, of the confirmed cases of COVID-19 in Daegu, 65.6% were associated with a single religious group, so it is unlikely that the data collected are representative of the general population. Furthermore, these patients were admitted to university hospitals because of their moderate-to-severe disease, and therefore the data are not representative of COVID-19 patients with mild disease. However, in spite of these limitations, the present study has a substantial strength: it is the first multi-center study to investigate the association between COVID-19 and DM in Daegu, Korea, the site of the first outbreak of COVID-19 outside Wuhan, China.
- Our findings regarding severe COVID-19 patients corroborate a series of recent observations that DM is a risk factor for severe COVID-19-related disease, as well as mortality. Accumulating evidence and our own data both also suggest that old age is an independent risk factor for COVID-19 infection and the severity of the disease. The present findings strongly suggest that DM contributes to higher COVID-19-related mortality, especially in the elderly. Therefore, special attention should be paid to older patients with DM during the treatment of COVID-19.
DISCUSSION
-
Acknowledgements
- This study was supported by a research grant from the Daegu Medical Association COVID-19 Scientific Committee. We also would like to express sincere gratitude to all the members of the Daegu-Gyeongbuk Diabetes and Endocrinology Society who actively participated in the study.
ACKNOWLEDGMENTS
-
CONFLICTS OF INTEREST: No potential conflict of interest relevant to this article was reported.
-
AUTHOR CONTRIBUTIONS:
Conception or design: J.S.M.
Acquisition, analysis, or interpretation of data: M.K.K., J.H.J., S.W.K., J.S.M., N.H.C., E.H., J.H.Y., J.Y.L., M.H., J.S.P., Y.S.K., Y.K.C., K.T.K., S.Y.L., E.J.J., J.W.K., H.L.H., H.H.K., C.Y.J., Y.Y.L., E.H., S.M.C., J.H., J.H.A., N.K, S.W.K., H.H.C., Y.H.L., J.L., K.G.P., H.A.K., J.H.L.
Drafting the work or revising: M.K.K., J.H.J.
Final approval of the manuscript: M.K.K., J.H.J., S.W.K., J.S.M.
NOTES
SUPPLEMENTARY MATERIALS
Supplementary Table 1
Supplementary Fig. 1
- 1. COVID-19 National Emergency Response Center. Epidemiology and Case Management Team. Korea Centers for Disease Control and Prevention. Coronavirus disease-19: summary of 2,370 contact investigations of the first 30 cases in the Republic of Korea. Osong Public Health Res Perspect 2020;11:81-84. ArticlePubMedPMCPDF
- 2. COVID-19 National Emergency Response Center. Epidemiology and Case Management Team. Korea Centers for Disease Control and Prevention. Coronavirus disease-19: the first 7,755 cases in the Republic of Korea. Osong Public Health Res Perspect 2020;11:85-90. ArticlePubMedPMCPDF
- 3. Kim SW, Lee KS, Kim K, Lee JJ, Kim JY. Daegu Medical Association. A brief telephone severity scoring system and therapeutic living centers solved acute hospital-bed shortage during the COVID-19 outbreak in Daegu, Korea. J Korean Med Sci 2020;35:e152. ArticlePubMedPMCPDF
- 4. Jafar N, Edriss H, Nugent K. The effect of short-term hyperglycemia on the innate immune system. Am J Med Sci 2016;351:201-211. ArticlePubMed
- 5. Turina M, Fry DE, Polk HC Jr. Acute hyperglycemia and the innate immune system: clinical, cellular, and molecular aspects. Crit Care Med 2005;33:1624-1633. ArticlePubMed
- 6. Cristelo C, Azevedo C, Marques JM, Nunes R, Sarmento B. SARS-CoV-2 and diabetes: new challenges for the disease. Diabetes Res Clin Pract 2020;164:108228. ArticlePubMedPMC
- 7. Memish ZA, Perlman S, Van Kerkhove MD, Zumla A. Middle East respiratory syndrome. Lancet 2020;395:1063-1077. ArticlePubMedPMC
- 8. Guan WJ, Liang WH, Zhao Y, Liang HR, Chen ZS, Li YM, Liu XQ, Chen RC, Tang CL, Wang T, Ou CQ, Li L, Chen PY, Sang L, Wang W, Li JF, Li CC, Ou LM, Cheng B, Xiong S, Ni ZY, Xiang J, Hu Y, Liu L, Shan H, Lei CL, Peng YX, Wei L, Liu Y, Hu YH, Peng P, Wang JM, Liu JY, Chen Z, Li G, Zheng ZJ, Qiu SQ, Luo J, Ye CJ, Zhu SY, Cheng LL, Ye F, Li SY, Zheng JP, Zhang NF, Zhong NS, He JX. China Medical Treatment Expert Group for COVID-19. Comorbidity and its impact on 1590 patients with COVID-19 in China: a nationwide analysis. Eur Respir J 2020;55:2000547. ArticlePubMedPMC
- 9. Kumar A, Arora A, Sharma P, Anikhindi SA, Bansal N, Singla V, Khare S, Srivastava A. Is diabetes mellitus associated with mortality and severity of COVID-19?: a meta-analysis. Diabetes Metab Syndr 2020;14:535-545. ArticlePubMedPMC
- 10. Guo W, Li M, Dong Y, Zhou H, Zhang Z, Tian C, Qin R, Wang H, Shen Y, Du K, Zhao L, Fan H, Luo S, Hu D. Diabetes is a risk factor for the progression and prognosis of COVID-19. Diabetes Metab Res Rev 2020 3 31 [Epub].
- 11. Docherty AB, Harrison EM, Green CA, Hardwick HE, Pius R, Norman L, Holden KA, Read JM, Dondelinger F, Carson G, Merson L, Lee J, Plotkin D, Sigfrid L, Halpin S, Jackson C, Gamble C, Horby PW, Nguyen-Van-Tam JS, Ho A, Russell CD, Dunning J, Openshaw PJ, Baillie JK, Semple MG. ISARIC4C investigators. Features of 20 133 UK patients in hospital with COVID-19 using the ISARIC WHO Clinical Characterisation Protocol: prospective observational cohort study. BMJ 2020;369:m1985. ArticlePubMedPMC
- 12. Kim MK, Ko SH, Kim BY, Kang ES, Noh J, Kim SK, Park SO, Hur KY, Chon S, Moon MK, Kim NH, Kim SY, Rhee SY, Lee KW, Kim JH, Rhee EJ, Chun S, Yu SH, Kim DJ, Kwon HS, Park KS. Committee of Clinical Practice Guidelines, Korean Diabetes Association. 2019 Clinical practice guidelines for type 2 diabetes mellitus in Korea. Diabetes Metab J 2019;43:398-406. ArticlePubMedPMCPDF
- 13. Ministry of Health and Welfare. Central Disaster Management Headquarters cited 2020 Jul 8. Available from: http://ncov.mohw.go.kr.
- 14. Hoffmann M, Kleine-Weber H, Pohlmann S. A multibasic cleavage site in the spike protein of SARS-CoV-2 is essential for infection of human lung cells. Mol Cell 2020;78:779-784. ArticlePubMedPMC
- 15. Raj VS, Mou H, Smits SL, Dekkers DH, Muller MA, Dijkman R, Muth D, Demmers JA, Zaki A, Fouchier RA, Thiel V, Drosten C, Rottier PJ, Osterhaus AD, Bosch BJ, Haagmans BL. Dipeptidyl peptidase 4 is a functional receptor for the emerging human coronavirus-EMC. Nature 2013;495:251-254. ArticlePubMedPMCPDF
- 16. Bornstein SR, Rubino F, Khunti K, Mingrone G, Hopkins D, Birkenfeld AL, Boehm B, Amiel S, Holt RI, Skyler JS, DeVries JH, Renard E, Eckel RH, Zimmet P, Alberti KG, Vidal J, Geloneze B, Chan JC, Ji L, Ludwig B. Practical recommendations for the management of diabetes in patients with COVID-19. Lancet Diabetes Endocrinol 2020;8:546-550. ArticlePubMedPMC
- 17. Guan WJ, Ni ZY, Hu Y, Liang WH, Ou CQ, He JX, Liu L, Shan H, Lei CL, Hui DSC, Du B, Li LJ, Zeng G, Yuen KY, Chen RC, Tang CL, Wang T, Chen PY, Xiang J, Li SY, Wang JL, Liang ZJ, Peng YX, Wei L, Liu Y, Hu YH, Peng P, Wang JM, Liu JY, Chen Z, Li G, Zheng ZJ, Qiu SQ, Luo J, Ye CJ, Zhu SY, Zhong NS. China Medical Treatment Expert Group for Covid-19. Clinical characteristics of coronavirus disease 2019 in China. N Engl J Med 2020;382:1708-1720. ArticlePubMed
- 18. Zhu L, She ZG, Cheng X, Qin JJ, Zhang XJ, Cai J, Lei F, Wang H, Xie J, Wang W, Li H, Zhang P, Song X, Chen X, Xiang M, Zhang C, Bai L, Xiang D, Chen MM, Liu Y, Yan Y, Liu M, Mao W, Zou J, Liu L, Chen G, Luo P, Xiao B, Zhang C, Zhang Z, Lu Z, Wang J, Lu H, Xia X, Wang D, Liao X, Peng G, Ye P, Yang J, Yuan Y, Huang X, Guo J, Zhang BH, Li H. Association of blood glucose control and outcomes in patients with COVID-19 and pre-existing type 2 diabetes. Cell Metab 2020;31:1068-1077. ArticlePubMedPMC
- 19. Korean Society of Infectious Diseases. Korean Society of Pediatric Infectious Diseases. Korean Society of Epidemiology. Korean Society for Antimicrobial Therapy. Korean Society for Healthcare-associated Infection Control and Prevention. Korea Centers for Disease Control and Prevention. Report on the epidemiological features of coronavirus disease 2019 (COVID-19) outbreak in the Republic of Korea from January 19 to March 2, 2020. J Korean Med Sci 2020;35:e112. ArticlePubMedPMCPDF
- 20. Katulanda P, Dissanayake HA, Ranathunga I, Ratnasamy V, Wijewickrama PSA, Yogendranathan N, Gamage KKK, de Silva NL, Sumanatilleke M, Somasundaram NP, Matthews DR. Prevention and management of COVID-19 among patients with diabetes: an appraisal of the literature. Diabetologia 2020;63:1440-1452. ArticlePubMedPMCPDF
- 21. Chung SM, Lee YY, Ha E, Yoon JS, Won KC, Lee HW, Hur J, Hong KS, Jang JG, Jin HJ, Choi EY, Shin KC, Chung JH, Lee KH, Ahn JH, Moon JS. The risk of diabetes on clinical outcomes in patients with coronavirus disease 2019: a retrospective cohort study. Diabetes Metab J 2020;44:405-413. ArticlePubMedPMCPDF
- 22. Cariou B, Hadjadj S, Wargny M, Pichelin M, Al-Salameh A, Allix I, Amadou C, Arnault G, Baudoux F, Bauduceau B, Borot S, Bourgeon-Ghittori M, Bourron O, Boutoille D, Cazenave-Roblot F, Chaumeil C, Cosson E, Coudol S, Darmon P, Disse E, Ducet-Boiffard A, Gaborit B, Joubert M, Kerlan V, Laviolle B, Marchand L, Meyer L, Potier L, Prevost G, Riveline JP, Robert R, Saulnier PJ, Sultan A, Thebaut JF, Thivolet C, Tramunt B, Vatier C, Roussel R, Gautier JF, Gourdy P. CORONADO investigators. Phenotypic characteristics and prognosis of inpatients with COVID-19 and diabetes: the CORONADO study. Diabetologia 2020;63:1500-1515. ArticlePubMedPMCPDF
- 23. Fadini GP, Morieri ML, Longato E, Bonora BM, Pinelli S, Selmin E, Voltan G, Falaguasta D, Tresso S, Costantini G, Sparacino G, Di Camillo B, Tramontan L, Cattelan AM, Vianello A, Fioretto P, Vettor R, Avogaro A. Exposure to dipeptidyl-peptidase-4 inhibitors and COVID-19 among people with type 2 diabetes: a case-control study. Diabetes Obes Metab 2020 5 28 [Epub].
- 24. Bassendine MF, Bridge SH, McCaughan GW, Gorrell MD. COVID-19 and comorbidities: a role for dipeptidyl peptidase 4 (DPP4) in disease severity? J Diabetes 2020;12:649-658. PubMed
- 25. Brufsky A. Hyperglycemia, hydroxychloroquine, and the COVID-19 pandemic. J Med Virol 2020;92:770-775. ArticlePubMedPMCPDF
- 26. Ursini F, Ciaffi J, Landini MP, Meliconi R. COVID-19 and diabetes: is metformin a friend or foe? Diabetes Res Clin Pract 2020;164:108167. ArticlePubMedPMC
- 27. Luo P, Qiu L, Liu Y, Liu XL, Zheng JL, Xue HY, Liu WH, Liu D, Li J. Metformin treatment was associated with decreased mortality in COVID-19 patients with diabetes in a retrospective analysis. Am J Trop Med Hyg 2020;103:69-72. ArticlePubMedPMC
- 28. Chatterjee S. SGLT-2 inhibitors for COVID-19: a miracle waiting to happen or just another beat around the bush? Prim Care Diabetes 2020 5 28 [Epub].Article
- 29. Pal R, Bhadada SK. Should anti-diabetic medications be reconsidered amid COVID-19 pandemic? Diabetes Res Clin Pract 2020;163:108146. ArticlePubMedPMC
REFERENCES
Flow chart of the study. COVID-19, coronavirus disease 2019; KNUH, Kyungpook National University Hospital; DSMC, Dongsan Medical Center; KNUCH, Kyungpook National University Chilgok Hospital; DCMC, Daegu Catholic Medical Center; PCR, polymerase chain reaction; DM, diabetes mellitus; PS, propensity score.

Mortality due to coronavirus disease 2019 in all patients (A) and propensity score-matched patients (B). The data were analyzed using the Kaplan-Meier method, and hazard ratios were calculated using a Cox proportional hazards model. Data are expressed as hazard ratio (HR) (95% confidence intervals [CI]). DM, diabetes mellitus
Mortality of coronavirus disease 2019 patients in subgroups defined according to age and sex. Patients aged <70 years (A) and >70 years (B); and male (C) and female (D) patients. Data were analyzed using a Cox proportional hazards model. Data are expressed as hazard ratio (HR) (95% confidence intervals [CI]). The model was adjusted for age, sex, and the presence of underlying diseases.

Baseline characteristics of the full group of participants and of propensity score-matched patients with coronavirus disease 2019
Values are presented as mean±standard deviation or number (%). P values were calculated using Student's t-test or the chi-square test.
PS, propensity score; DM, diabetes mellitus; BMI, body mass index; SBP, systolic blood pressure; DBP, diastolic blood pressure; DPP-4, dipeptidyl peptidase-4; SGLT-2, sodium glucose cotransporter-2; RAS, renin-angiotensin system; HbA1c, glycosylated hemoglobin; WBC, white blood cell; Hb, hemoglobin; Hct, hematocrit; PLT, platelet; CRP, C-reactive protein; BUN, blood urea nitrogen; Cr, creatinine; eGFR, estimated glomerular filtration rate; AST, aspartate aminotransferase; ALT, alanine aminotransaminase; LDH, lactate dehydrogenase.
In-hospital management and outcomes of patients with coronavirus disease 2019
Values are presented as number (%) or mean±standard deviation. All P values were calculated using Student's t-test or the chi-square test.
PS, propensity score; DM, diabetes mellitus; ICU, intensive care unit; CRRT, continuous renal replacement therapy; ECMO, extracorporeal membrane oxygenation.
aOnly includes patients who had been released from quarantine.
Multivariate model for the prediction of severe disease or death in coronavirus disease 2019 patients
Data were analyzed using multivariate logistic regression, and all data are expressed as odds ratios (95% confidence intervals). The model was adjusted for age, sex, and the presence of underlying diseases.
DM, diabetes mellitus; WBC, white blood cell; Hb, hemoglobin; PLT, platelet; CRP, C-reactive protein; eGFR, estimated glomerular filtration rate; AST, aspartate aminotransferase; ALT, alanine aminotransaminase; LDH, lactate dehydrogenase.
aP<0.01, bP<0.05.
Figure & Data
References
Citations
- Potential use of sodium glucose co-transporter 2 inhibitors during acute illness: a systematic review based on COVID-19
Carmen Tisch, Eleni Xourgia, Aristomenis Exadaktylos, Mairi Ziaka
Endocrine.2024;[Epub] CrossRef - Insulin and Metformin Administration: Unravelling the Multifaceted Association with Mortality across Various Clinical Settings Considering Type 2 Diabetes Mellitus and COVID-19
Łukasz Lewandowski, Agnieszka Bronowicka-Szydełko, Maciej Rabczyński, Dorota Bednarska-Chabowska, Joanna Adamiec-Mroczek, Adrian Doroszko, Małgorzata Trocha, Krzysztof Kujawa, Agnieszka Matera-Witkiewicz, Edwin Kuźnik, Paweł Lubieniecki, Marcin Madziarski
Biomedicines.2024; 12(3): 605. CrossRef - Pre-admission use of sodium glucose transporter-2 inhibitor (SGLT-2i) may significantly improves Covid-19 outcomes in patients with diabetes: A systematic review, meta-analysis, and meta-regression
Hikmat Permana, Theo Audi Yanto, Timotius Ivan Hariyanto
Diabetes Research and Clinical Practice.2023; 195: 110205. CrossRef - Risk phenotypes of diabetes and association with COVID-19 severity and death: an update of a living systematic review and meta-analysis
Sabrina Schlesinger, Alexander Lang, Nikoletta Christodoulou, Philipp Linnerz, Kalliopi Pafili, Oliver Kuss, Christian Herder, Manuela Neuenschwander, Janett Barbaresko, Michael Roden
Diabetologia.2023; 66(8): 1395. CrossRef - Factors influencing the severity of COVID-19 course for patients with diabetes mellitus in tashkent: a retrospective cohort study
A. V. Alieva, A. A. Djalilov, F. A. Khaydarova, A. V. Alimov, D. Z. Khalilova, V. A. Talenova, N. U. Alimova, M. D. Aripova, A. S. Sadikova
Obesity and metabolism.2023; 20(2): 92. CrossRef - Pituitary Diseases and COVID-19 Outcomes in South Korea: A Nationwide Cohort Study
Jeonghoon Ha, Kyoung Min Kim, Dong-Jun Lim, Keeho Song, Gi Hyeon Seo
Journal of Clinical Medicine.2023; 12(14): 4799. CrossRef - Epidemiological features and consequences of COVID‐19 in patients with and without gastrointestinal symptoms in southwestern Iran. A retrospective observational study
Habibollah Azarbakhsh, Leila Moftakhar, Aliasghar Valipour, Alireza Mirahmadizadeh, Hekmat Allah Moradi, Elahe Piraee
Health Science Reports.2023;[Epub] CrossRef - The Impact of Long-Term Conditions and Comorbidity Patterns on COVID-19 Infection and Hospitalisation: A Cohort Study
Yun-Ting Huang, Andrew Steptoe, Riyaz S. Patel, Esme Fuller Thomson, Dorina Cadar
Gerontology.2023; 69(10): 1200. CrossRef - Association Between Anti-diabetic Agents and Clinical Outcomes of COVID-19 in Patients with Diabetes: A Systematic Review and Meta-Analysis
Tiantian Han, Shaodi Ma, Chenyu Sun, Huimei Zhang, Guangbo Qu, Yue Chen, Ce Cheng, Eric L. Chen, Mubashir Ayaz Ahmed, Keun Young Kim, Raveena Manem, Mengshi Chen, Zhichun Guo, Hongru Yang, Yue Yan, Qin Zhou
Archives of Medical Research.2022; 53(2): 186. CrossRef - Use of DPP4i reduced odds of clinical deterioration and hyperinflammatory syndrome in COVID-19 patients with type 2 diabetes: Propensity score analysis of a territory-wide cohort in Hong Kong
Carlos K.H. Wong, David T.W. Lui, Angel Y.C. Lui, Ashley C.Y. Kwok, Marshall C.H. Low, Kristy T.K. Lau, Ivan C.H. Au, Xi Xiong, Matthew S.H. Chung, Eric H.Y. Lau, Benjamin J. Cowling
Diabetes & Metabolism.2022; 48(1): 101307. CrossRef - Dipeptidyl peptidase-4 (DPP-IV) inhibitor was associated with mortality reduction in COVID-19 — A systematic review and meta-analysis
Ahmad Fariz Malvi Zamzam Zein, Wilson Matthew Raffaello
Primary Care Diabetes.2022; 16(1): 162. CrossRef - Prevalence and impact of diabetes in hospitalized COVID‐19 patients: A systematic review and meta‐analysis
Sian A. Bradley, Maciej Banach, Negman Alvarado, Ivica Smokovski, Sonu M. M. Bhaskar
Journal of Diabetes.2022; 14(2): 144. CrossRef - Interplay between Inflammaging, Frailty and Nutrition in Covid-19: Preventive and Adjuvant Treatment Perspectives
A. Padilha de Lima, M. Macedo Rogero, T. Araujo Viel, H.M. Garay-Malpartida, I. Aprahamian, Sandra Maria Lima Ribeiro
The Journal of nutrition, health and aging.2022; 26(1): 67. CrossRef - Increase in blood glucose level and incidence of diabetic ketoacidosis in children with type 1 diabetes mellitus in the Daegu-Gyeongbuk area during the coronavirus disease 2019 (COVID-19) pandemic: a retrospective cross-sectional study
Mi Seon Lee, Rosie Lee, Cheol Woo Ko, Jung Eun Moon
Journal of Yeungnam Medical Science.2022; 39(1): 46. CrossRef - Interrelationship between 2019-nCov receptor DPP4 and diabetes mellitus targets based on protein interaction network
Qian Gao, Wenjun Zhang, Tingting Li, Guojun Yang, Wei Zhu, Naijun Chen, Huawei Jin
Scientific Reports.2022;[Epub] CrossRef - Can sodium-glucose co-transporter-2 (SGLT-2) inhibitor reduce the risk of adverse complications due to COVID-19? – Targeting hyperinflammation
Afnan Alshnbari, Iskandar Idris
Current Medical Research and Opinion.2022; 38(3): 357. CrossRef - Commentary: Mortality Risk of Antidiabetic Agents for Type 2 Diabetes With COVID-19: A Systematic Review and Meta-Analysis
Li-Min Zhao, Xie-Hui Chen, Mei Qiu
Frontiers in Endocrinology.2022;[Epub] CrossRef - COVID-19 and Diabetes
Awadhesh Kumar Singh, Kamlesh Khunti
Annual Review of Medicine.2022; 73(1): 129. CrossRef - The enzymes in COVID-19: A review
Maria Helena Menezes Estevam Alves, Layla Carvalho Mahnke, Tifany Cerqueira Macedo, Thais Ketinly dos Santos Silva, Luiz Bezerra Carvalho Junior
Biochimie.2022; 197: 38. CrossRef - IMPACT OF ANTIDIABETIC DRUGS ON RISK AND OUTCOME OF COVID-19 INFECTION: A REVIEW
Adnan A. Zainal, Marwan M. Merkhan
Military Medical Science Letters.2022; 91(2): 140. CrossRef - Does metformin affect outcomes in COVID‐19 patients with new or pre‐existing diabetes mellitus? A systematic review and meta‐analysis
Adithan Ganesh, Michael D. Randall
British Journal of Clinical Pharmacology.2022; 88(6): 2642. CrossRef - Diabetes, Metformin and the Clinical Course of Covid-19: Outcomes, Mechanisms and Suggestions on the Therapeutic Use of Metformin
Clifford J. Bailey, Mike Gwilt
Frontiers in Pharmacology.2022;[Epub] CrossRef - The Role of Diabetes and Hyperglycemia on COVID-19 Infection Course—A Narrative Review
Evangelia Tzeravini, Eleftherios Stratigakos, Chris Siafarikas, Anastasios Tentolouris, Nikolaos Tentolouris
Frontiers in Clinical Diabetes and Healthcare.2022;[Epub] CrossRef - Preadmission use of antidiabetic medications and mortality among patients with COVID-19 having type 2 diabetes: A meta-analysis
Nam Nhat Nguyen, Dung Si Ho, Hung Song Nguyen, Dang Khanh Ngan Ho, Hung-Yuan Li, Chia-Yuan Lin, Hsiao-Yean Chiu, Yang-Ching Chen
Metabolism.2022; 131: 155196. CrossRef - Glucose-Lowering Agents and COVID-19
Ah Reum Khang
The Journal of Korean Diabetes.2022; 23(1): 1. CrossRef - Impact of diabetes on COVID‐19 mortality and hospital outcomes from a global perspective: An umbrella systematic review and meta‐analysis
Stavroula Kastora, Manisha Patel, Ben Carter, Mirela Delibegovic, Phyo Kyaw Myint
Endocrinology, Diabetes & Metabolism.2022;[Epub] CrossRef - The Association Between Antidiabetic Agents and Clinical Outcomes of COVID-19 Patients With Diabetes: A Bayesian Network Meta-Analysis
Yidan Chen, Xingfei Lv, Sang Lin, Mohammad Arshad, Mengjun Dai
Frontiers in Endocrinology.2022;[Epub] CrossRef - Renin‐Angiotensin Aldosterone System Inhibitors and COVID‐19: A Systematic Review and Meta‐Analysis Revealing Critical Bias Across a Body of Observational Research
Jordan Loader, Frances C. Taylor, Erik Lampa, Johan Sundström
Journal of the American Heart Association.2022;[Epub] CrossRef - Diabetes and SARS-CoV-2–Is There a Mutual Connection?
Anna P. Jedrzejak, Edyta K. Urbaniak, Jadwiga A. Wasko, Natalia Ziojla, Malgorzata Borowiak
Frontiers in Cell and Developmental Biology.2022;[Epub] CrossRef - The relationship of age, sex and prothrombin time related to the severity and mortality of COVID-19 patients with diabetes mellitus: a systematic review and meta analysis
Audrey Fabianisa Mirza, Ceria Halim, Mutiara Indah Sari
F1000Research.2022; 11: 729. CrossRef - Are lipid ratios and triglyceride-glucose index associated with critical care outcomes in COVID-19 patients?
Marzieh Rohani-Rasaf, Kosar Mirjalili, Akram Vatannejad, Maryam Teimouri, Xiao-Feng Yang
PLOS ONE.2022; 17(8): e0272000. CrossRef - Early glycaemic variability increases 28-day mortality and prolongs intensive care unit stay in critically ill patients with pneumonia
Seong Ho Kim, Ji Young Kim, Eun Song Kim, Il Rae Park, Eun Yeong Ha, Seung Min Chung, Jun Sung Moon, Ji Sung Yoon, Kyu Chang Won, Hyoung Woo Lee
Annals of Medicine.2022; 54(1): 2724. CrossRef - Dipeptidyl peptidase 4 inhibitors in COVID-19: Beyond glycemic control
Niya Narayanan, Dukhabandhu Naik, Jayaprakash Sahoo, Sadishkumar Kamalanathan
World Journal of Virology.2022; 11(6): 399. CrossRef - Prevalencia de secuelas en pacientes con diabetes mellitus tipo 2 sobrevivientes al COVID-19
Gianela M. Cancino-Castillo, Miguel A. Tresierra-Ayala, Jorge L. Campos-Reyna, Jaime Rosales-Rimache
REVISTA MÉDICA VALLEJIANA/ Vallejian Medical Journal.2022; 11(2): 48. CrossRef - Predictors of adverse in-hospital outcome and recovery in patients with diabetes mellitus and COVID-19 pneumonia in Iraq
Hussein Nafakhi, Mohammed Alareedh, Karrar Al-Buthabhak, Foaad Shaghee, Ahmed Nafakhi, Samet Kasim
Diabetes & Metabolic Syndrome: Clinical Research & Reviews.2021; 15(1): 33. CrossRef - Non-insulin anti-diabetic agents in patients with type 2 diabetes and COVID-19: A Critical Appraisal of Literature
Awadhesh Kumar Singh, Ritu Singh, Banshi Saboo, Anoop Misra
Diabetes & Metabolic Syndrome: Clinical Research & Reviews.2021; 15(1): 159. CrossRef - COVID-19 associated with diabetes and other noncommunicable diseases led to a global health crisis
Mark Thomaz Ugliara Barone, Belinda Ngongo, Simone Bega Harnik, Lucas Xavier de Oliveira, Dániel Végh, Patrícia Vieira de Luca, Hermelinda Cordeiro Pedrosa, Franco Giraudo, Roque Cardona-Hernandez, Nayanjeet Chaudhury, Luiz Menna-Barreto
Diabetes Research and Clinical Practice.2021; 171: 108587. CrossRef - A meta-analysis on the preadmission use of DPP-4 inhibitors and risk of a fatal or severe course of illness in patients with COVID-19
Chia Siang Kow, Syed Shahzad Hasan
Therapies.2021; 76(4): 361. CrossRef - Disentangling conflicting evidence on DPP-4 inhibitors and outcomes of COVID-19: narrative review and meta-analysis
B. M. Bonora, A. Avogaro, G. P. Fadini
Journal of Endocrinological Investigation.2021; 44(7): 1379. CrossRef - Prognostic bioindicators in severe COVID-19 patients
L. Bergantini, E. Bargagli, M. d'Alessandro, R.M. Refini, P. Cameli, L. Galasso, C. Scapellato, F. Montagnani, S. Scolletta, F. Franchi, S. Valente, D. Bennett, G. Sebastiani, B. Frediani, F. Dotta
Cytokine.2021; 141: 155455. CrossRef - Epidemiological characteristics and outcomes of COVID-19 in diabetic versus non-diabetic patients
Leila Moftakhar, Parisa Moftakhar, Elahe Piraee, Haleh Ghaem, Aliasghar Valipour, Habibollah Azarbakhsh
International Journal of Diabetes in Developing Countries.2021; 41(3): 383. CrossRef - DPP-4 inhibition and COVID-19: From initial concerns to recent expectations
André J. Scheen
Diabetes & Metabolism.2021; 47(2): 101213. CrossRef - Use of dipeptidyl peptidase‐4 inhibitors and prognosis of COVID‐19 in hospitalized patients with type 2 diabetes: A propensity score analysis from the CORONADO study
Ronan Roussel, Patrice Darmon, Matthieu Pichelin, Thomas Goronflot, Yawa Abouleka, Leila Ait Bachir, Ingrid Allix, Deborah Ancelle, Sara Barraud, Lyse Bordier, Aurélie Carlier, Nicolas Chevalier, Christine Coffin‐Boutreux, Emmanuel Cosson, Anne Dorange, O
Diabetes, Obesity and Metabolism.2021; 23(5): 1162. CrossRef - Dipeptidyl peptidase-4 inhibitor use and mortality in COVID-19 patients with diabetes mellitus: an updated systematic review and meta-analysis
Rimesh Pal, Mainak Banerjee, Soham Mukherjee, Ranjitpal Singh Bhogal, Amanpreet Kaur, Sanjay K. Bhadada
Therapeutic Advances in Endocrinology and Metabolism.2021; 12: 204201882199648. CrossRef - Renin–angiotensin-system inhibitors and all-cause mortality in patients with COVID-19: a systematic review and meta-analysis of observational studies
Chirag Bavishi, Paul K. Whelton, Giuseppe Mancia, Giovanni Corrao, Franz H. Messerli
Journal of Hypertension.2021; 39(4): 784. CrossRef - Evaluation of the Current Therapeutic Approaches for COVID-19: A Systematic Review and a Meta-analysis
Zeinab Abdelrahman, Qian Liu, Shanmei Jiang, Mengyuan Li, Qingrong Sun, Yue Zhang, Xiaosheng Wang
Frontiers in Pharmacology.2021;[Epub] CrossRef - Dipeptidyl peptidase 4 (DPP4) inhibitor and outcome from coronavirus disease 2019 (COVID-19) in diabetic patients: a systematic review, meta-analysis, and meta-regression
Timotius Ivan Hariyanto, Andree Kurniawan
Journal of Diabetes & Metabolic Disorders.2021; 20(1): 543. CrossRef - Impact of diabetes mellitus on in-hospital mortality in adult patients with COVID-19: a systematic review and meta-analysis
Halla Kaminska, Lukasz Szarpak, Dariusz Kosior, Wojciech Wieczorek, Agnieszka Szarpak, Mahdi Al-Jeabory, Wladyslaw Gawel, Aleksandra Gasecka, Milosz J. Jaguszewski, Przemyslawa Jarosz-Chobot
Acta Diabetologica.2021; 58(8): 1101. CrossRef - Dipeptidyl peptidase-4 (DPP-4) inhibitor and mortality in coronavirus disease 2019 (COVID-19) – A systematic review, meta-analysis, and meta-regression
Iis Inayati Rakhmat, Yudith Yunia Kusmala, Dewi Ratih Handayani, Henny Juliastuti, Eka Noneng Nawangsih, Arief Wibowo, Michael Anthonius Lim, Raymond Pranata
Diabetes & Metabolic Syndrome: Clinical Research & Reviews.2021; 15(3): 777. CrossRef - Post-infection depressive, anxiety and post-traumatic stress symptoms: A prospective cohort study in patients with mild COVID-19
Flavia Ismael, João C.S. Bizario, Tatiane Battagin, Beatriz Zaramella, Fabio E. Leal, Julio Torales, Antonio Ventriglio, Megan E. Marziali, Silvia S. Martins, João M. Castaldelli-Maia
Progress in Neuro-Psychopharmacology and Biological Psychiatry.2021; 111: 110341. CrossRef - Managing diabetes in diabetic patients with COVID: where do we start from?
Angelo Avogaro, Benedetta Bonora, Gian Paolo Fadini
Acta Diabetologica.2021; 58(11): 1441. CrossRef - Is diabetes mellitus a wrongdoer to COVID-19 severity?
Sanjib Sarkar, Dibyendu Das, Sawlang Borsingh Wann, Jatin Kalita, Prasenjit Manna
Diabetes Research and Clinical Practice.2021; 178: 108936. CrossRef - Dipeptidyl Peptidase 4 Inhibitor, an Update
Ju Hee Lee
The Journal of Korean Diabetes.2021; 22(2): 91. CrossRef - Correlation Analysis Between Serum Uric Acid, Prealbumin Level, Lactate Dehydrogenase, and Severity of COVID-19
Zhenmu Jin, Mo Zheng, Jichan Shi, Xinchun Ye, Fang Cheng, Que-Lu Chen, Jianping Huang, Xian-Gao Jiang
Frontiers in Molecular Biosciences.2021;[Epub] CrossRef - Association Between Glucagon-Like Peptide 1 Receptor Agonist and Sodium–Glucose Cotransporter 2 Inhibitor Use and COVID-19 Outcomes
Anna R. Kahkoska, Trine Julie Abrahamsen, G. Caleb Alexander, Tellen D. Bennett, Christopher G. Chute, Melissa A. Haendel, Klara R. Klein, Hemalkumar Mehta, Joshua D. Miller, Richard A. Moffitt, Til Stürmer, Kajsa Kvist, John B. Buse, Tim Q. Duong
Diabetes Care.2021; 44(7): 1564. CrossRef - The effect of metformin on mortality and severity in COVID-19 patients with diabetes mellitus
Wenxing Yang, Xuehong Sun, Jun Zhang, Kui Zhang
Diabetes Research and Clinical Practice.2021; 178: 108977. CrossRef - Renin‐Angiotensin Aldosterone System Inhibitors in Primary Prevention and COVID‐19
Jordan Loader, Erik Lampa, Stefan Gustafsson, Thomas Cars, Johan Sundström
Journal of the American Heart Association.2021;[Epub] CrossRef - Factors influencing on development of COVID-19 pneumonia and association with oral anti-diabetic drugs in hospitalized patients with diabetes mellitus
Ayça Elibol, Didem Eren, Macide Deniz Erdoğan, Merve Elmaağaç, Oguzhan Sıtkı Dizdar, İlhami Çelik, Ali İhsan Günal
Primary Care Diabetes.2021; 15(5): 806. CrossRef - Aging & COVID-19 susceptibility, disease severity, and clinical outcomes: The role of entangled risk factors
Melina Farshbafnadi, Sara Kamali Zonouzi, Mohammadmahdi Sabahi, Mahsa Dolatshahi, Mohammad Hadi Aarabi
Experimental Gerontology.2021; 154: 111507. CrossRef - Classical and Counter-Regulatory Renin–Angiotensin System: Potential Key Roles in COVID-19 Pathophysiology
Moudhi Almutlaq, Abir Abdullah Alamro, Fayhan Alroqi, Tlili Barhoumi
CJC Open.2021; 3(8): 1060. CrossRef - Metformin in Patients With COVID-19: A Systematic Review and Meta-Analysis
Yin Li, Xue Yang, Peijing Yan, Tong Sun, Zhi Zeng, Sheyu Li
Frontiers in Medicine.2021;[Epub] CrossRef - Pre-existing health conditions and severe COVID-19 outcomes: an umbrella review approach and meta-analysis of global evidence
Marina Treskova-Schwarzbach, Laura Haas, Sarah Reda, Antonia Pilic, Anna Borodova, Kasra Karimi, Judith Koch, Teresa Nygren, Stefan Scholz, Viktoria Schönfeld, Sabine Vygen-Bonnet, Ole Wichmann, Thomas Harder
BMC Medicine.2021;[Epub] CrossRef - COVID-19 Vaccination for Endocrine Patients: A Position Statement from the Korean Endocrine Society
Cheol Ryong Ku, Kyong Yeun Jung, Chang Ho Ahn, Jun Sung Moon, Ju Hee Lee, Eun Heui Kim, Hyemi Kwon, Hee Kyung Kim, Sunghwan Suh, Sangmo Hong, Jeonghoon Ha, Eun Roh, Jin Hwa Kim, Mi-kyung Kim
Endocrinology and Metabolism.2021; 36(4): 757. CrossRef - High Fibrosis-4 Index Is Related with Worse Clinical Outcome in Patients with Coronavirus Disease 2019 and Diabetes Mellitus: A Multicenter Observational Study
Sung-Woo Kim, Jae-Han Jeon, Jun Sung Moon, Mi Kyung Kim
Endocrinology and Metabolism.2021; 36(4): 800. CrossRef - Mortality Risk of Antidiabetic Agents for Type 2 Diabetes With COVID-19: A Systematic Review and Meta-Analysis
Chengxia Kan, Yang Zhang, Fang Han, Qian Xu, Tongtong Ye, Ningning Hou, Xiaodong Sun
Frontiers in Endocrinology.2021;[Epub] CrossRef - Analysis of influence of background therapy for comorbidities in the period before infection on the risk of the lethal COVID outcome. Data from the international ACTIV SARS-CoV-2 registry («Analysis of chronic non-infectious diseases dynamics after COVID-
E. I. Tarlovskaya, A. G. Arutyunov, A. O. Konradi, Yu. M. Lopatin, A. P. Rebrov, S. N. Tereshchenko, A. I. Chesnikova, H. G. Hayrapetyan, A. P. Babin, I. G. Bakulin, N. V. Bakulina, L. A. Balykova, A. S. Blagonravova, M. V. Boldina, A. R. Vaisberg, A. S.
Kardiologiia.2021; 61(9): 20. CrossRef - Association of clinical characteristics, antidiabetic and cardiovascular agents with diabetes mellitus and COVID-19: a 7-month follow-up cohort study
Marzieh Pazoki, Fatemeh Chichagi, Azar Hadadi, Samira Kafan, Mahnaz Montazeri, Sina Kazemian, Arya Aminorroaya, Mehdi Ebrahimi, Haleh Ashraf, Mojgan Mirabdolhagh Hazaveh, Mohammad Reza Khajavi, Reza Shariat Moharari, Seyed Hamidreza Sharifnia, Shahrokh Ka
Journal of Diabetes & Metabolic Disorders.2021; 20(2): 1545. CrossRef - COVID-19 and Diabetes: A Comprehensive Review of Angiotensin Converting Enzyme 2, Mutual Effects and Pharmacotherapy
Lingli Xie, Ziying Zhang, Qian Wang, Yangwen Chen, Dexue Lu, Weihua Wu
Frontiers in Endocrinology.2021;[Epub] CrossRef - Impact of Diabetes on COVID-19 Mortality and Hospital Outcomes, a Global Perspective: An ONTOP Systematic Review and Meta-Analysis
Stavroula Kastora, Manisha Patel, Ben Carter, Mirela Delibegovic, Phyo Kyaw Myint
SSRN Electronic Journal .2021;[Epub] CrossRef - Decision Trees: Predictions of Global Vulnerability to Coronavirus Outbreaks
Moacir José da Silva
SSRN Electronic Journal .2020;[Epub] CrossRef - The potential association between common comorbidities and severity and mortality of coronavirus disease 2019: A pooled analysis
Liman Luo, Menglu Fu, Yuanyuan Li, Shuiqing Hu, Jinlan Luo, Zhihui Chen, Jing Yu, Wenhua Li, Ruolan Dong, Yan Yang, Ling Tu, Xizhen Xu
Clinical Cardiology.2020; 43(12): 1478. CrossRef - The Effect of Metformin Consumption on Mortality in Hospitalized COVID-19 patients: a systematic review and meta-analysis
Antonia Anna Lukito, Raymond Pranata, Joshua Henrina, Michael Anthonius Lim, Sherly Lawrensia, Ketut Suastika
Diabetes & Metabolic Syndrome: Clinical Research & Reviews.2020; 14(6): 2177. CrossRef - Risk Factors on the Progression to Clinical Outcomes of COVID-19 Patients in South Korea: Using National Data
Seon-Rye Kim, Seoul-Hee Nam, Yu-Rin Kim
International Journal of Environmental Research and Public Health.2020; 17(23): 8847. CrossRef - Clinical Outcomes of COVID-19 Patients with Type 2 Diabetes: A Population-Based Study in Korea
Ji Hong You, Sang Ah Lee, Sung-Youn Chun, Sun Ok Song, Byung-Wan Lee, Dae Jung Kim, Edward J. Boyko
Endocrinology and Metabolism.2020; 35(4): 901. CrossRef
 PubReader
 ePub Link
 Cite
Cite